1259 Tahoe Ct Ct · Lakeside, FL
Flood risk 1/10 · Minimal
- FEMA flood zone
- X (unshaded)
- Chance of flooding over 30 yrs
- 0.0%
- Est. flood insurance / yr
- $507 – $1,088
Fire risk 5/10 · Moderate
- Est. fire insurance / yr
- $947 – $1,759
Heat risk 8/10 · Major
- Hot days now (above 107°F)
- 7 days/yr
- Hot days in 30 yrs
- 19 days/yr
Wind risk 9/10 · Severe
- Chance of severe wind over 30 yrs
- 99.0%
Air-quality risk 3/10 · Minor
- Unhealthy air days now
- 3 days/yr
- Unhealthy air days in 30 yrs
- 3 days/yr
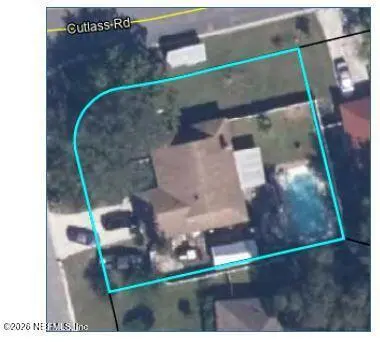
Risk factors via First Street. Map © Google.
Why this score? — see what drove the D- grade
The composite is a weighted blend of 9 inputs, each scored 0–100. Each bar is that input's sub-score; the figure is the points it added to the 100-point composite (weight × sub-score).
- Cash flow +11.7/30.0
- Schools +5.1/10.0
- ARV discount +3.6/15.0
- DSCR +3.5/10.0
- Rent growth +3.4/5.0
- Livability +3.4/5.0
- 1% rule +2.5/10.0
- Condition / age +2.5/5.0
- Appreciation +0.0/10.0
$258,000
🖨 Deal sheet (PDF) 📄 Offer letter ✓ Due diligence
Listing remarks MLS
Fantastic home. Has lot of xtras - inground pool, sprinkler system w/well, glassed porch, ceramic tile, fireplace & skylights. Home needs a little TLC. Mostly cosmetic. Bring your buyers and best offers. Thanks for showing. Please leave card.
Key facts
- 250 garage spots
- Pool
- Built 1999
Neighborhood map
What this means for you Summary
Snapshot
- This is a 3-bed/2.0-bath single-family listed at $258k.
Deal economics
- At list price, monthly cash flow is $-74 ($-892/yr) — negative.
- To cash-flow at today's rent, offer at most $245k (5.1% below list).
- To meet the 1% rule (rent ≥ 1% of price), the offer needs to be $193k (25.0% below list).
- Recommended offer: $193k (25.0% below list) — sets the bar for 1% rule.
- Cap rate 5.9% vs local median 4.7% in Lakeside — meaningfully above typical; check what's discounted (condition, days-on-market, listing class) to confirm the premium yield is real.
Location & tenants
- Location reads 68/100 on livability (#505 in FL) — a middle-class / working-renter tenant base. Strengths: cost of living A+, housing A+, crime B; Watch: amenities F, commute F, health & safety F.
- Clay (suburban): math 58% / reading 59% proficiency, ranked #14 of 73 in FL (top 19%) — acceptable for families but not a draw, mixed tenant base, ~2y average lease.
- Zoned schools: Ridgeview Elementary School (math 59% / reading 64%, grade B, #634 of 2,144 statewide, top 30%, 588 students, 100% FRL); Orange Park Junior High School (math 38% / reading 45%, grade F, #348 of 571 statewide, top 62%, 744 students, 100% FRL); Ridgeview High School (math 41% / reading 53%, grade D-, #207 of 667 statewide, top 32%, 1,828 students, 46% FRL) — zoned schools average 82% FRL vs 35% district-wide (47 pts higher); higher-poverty schools than district average — tighter screening recommended.
- Market conditions: Rents rising (+3.7%/yr); 209 active listings in the ZIP; 25 comparable units currently listed for rent nearby; rentals at typical pace (median 17d on market — plan ~3-4 weeks tenant-placement turnaround); solid renter incomes; 1,876 units permitted in Clay County in 2024 (14 in 5+ unit buildings).
Forward outlook
- Local home prices are declining (-3.0%/yr); year-one equity from $2k of loan paydown is wiped out by about $8k of value loss. Plan a longer hold.
- Clay County population projected at +19% by 2050 — long-run rental-demand tailwind backs the buy-and-hold thesis.
Negotiation context
- Only 0 days on market — expect competitive offers; lowballing is unlikely to land.
- 2 sale attempts since 21y ago with the ask held roughly flat each time — persistent listings suggest the price (not the market) is what's stuck; bring a comps-based counter.
Risks & watch-outs
- Climate carrying-cost: severe wind risk, 99% chance of damaging wind over 30y; moderate wildfire risk; extreme-heat days projected 7→19/yr by 2055 (HVAC capex compounding) — expect insurance premiums to compound above CPI over the hold.
Questions for the listing agent
- What do current leases actually rent for vs. the listed asking? Can we see a recent rent roll and the last 12 months of T-12 income?
- Is there a deadline driving the sale (1031 exchange, divorce, estate, relocation)? That informs how much negotiation room exists.
- Schools are B-rated — typically a magnet for longer-tenancy family renters. What's the average tenant stay here, and is there a school-zone premium baked into asking?
- The area grade is low — what's the realistic commute time and amenity access for the typical tenant pool here? Any planned neighborhood developments (good or bad) we should know about?
- What's the average days-on-market for RENTAL listings here right now (not sales)? A rising rental-DOM trend means longer vacancies and softer asking-rent achievability than the comps imply.
- What's the recent tenant-quality profile in this submarket — average credit score on applications, eviction rate, late-payment / NSF rate, and stable-employment percentage? A property-management company in the area should have these aggregated.
- How much new for-sale + rental construction is in the pipeline within 1–3 miles? Heavy new supply typically softens prices + rents 12–24 months out; constrained supply supports both.
Investment metrics
- 1% rule
- 0.75% ✗
- Cap rate
- 5.95%
- Cash-on-cash
- -1.23%
- DSCR
- 0.95
- GRM
- 11.1
CMA / ARV
- ARV (on-the-fly)
- $237,510
- Comps found
- 9
Show comp detail 9 sales within ~0.75 mi
| Address | Dist | Beds/Ba | Sqft | Sold | Price | $/sf | Match |
|---|---|---|---|---|---|---|---|
| 1261 Cutlass Rd | 0.03mi | 3/2.0 | 1,305 (0%) | 20mo | $262,150 | $201 | 82 |
| 1295 Bear Run Blvd | 0.36mi | 3/2.0 | 1,304 (-0%) | 2mo | $232,500 | $178 | 81 |
| 1312 Rushing Dr | 0.20mi | 3/2.0 | 1,372 (+5%) | 2mo | $255,000 | $186 | 81 |
| 3186 Bee St E | 0.45mi | 3/2.0 | 1,328 (+2%) | 9mo | $185,000 | $139 | 69 |
| 1347 Bee St W | 0.58mi | 3/2.0 | 1,374 (+5%) | 3mo | $310,000 | $226 | 61 |
| 2920 Andy Ct | 0.35mi | 3/2.0 | 1,397 (+7%) | 13mo | $285,000 | $204 | 61 |
| 521 Opal Ave | 0.52mi | 2/1.5 (-1) | 1,272 (-2%) | 6mo | $163,500 | $129 | 60 |
| 3183 Bee St E | 0.42mi | 3/2.0 | 1,372 (+5%) | 18mo | $250,000 | $182 | 56 |
| 2933 Dakota Dr | 0.39mi | 3/2.0 | 1,464 (+12%) | 22mo | $265,000 | $181 | 43 |
Match score weights: distance 35% · size 25% · config 20% · recency 20%. Top-matched comps best support the ARV.
Projected returns pro-forma
-3.0% appreciation · 3.73% rent growth · sell at horizon
- IRR
- -17.6%
- Equity multiple
- 0.37×
- Total profit
- $-45,191
- Equity at exit
- $38,469
- IRR
- -8.6%
- Equity multiple
- 0.45×
- Total profit
- $-39,817
- Equity at exit
- $22,307
Cash invested: $72,240 (down + closing). Projections, not guarantees.
Landlord ↔ Tenant lean methodology
- Overall (STATE)
- 87 Strongly Landlord-Friendly
- State Florida
- 87 Strongly Landlord-Friendly · R+3
- County
- — inherits STATE
- City
- — inherits STATE
ZIP-level market 32065
- Home prices YoY
- -25.6%
- Rents YoY
- 3.7%
- Active inventory
- 209
- Price-to-rent
- 11.1×
Monthly cashflow live
- Estimated rent
- $1,935 high interval (Pro) →
- Mortgage (P&I)
- −$1,353
- Tax from tax record
- −$142 /mo · $1,708/yr
- Insurance
- −$108
- HOA
- −$0
- Vacancy / Maint / Mgmt
- −$406
- Net cashflow
- $-74
Break-even live
Sensitivity live
| Price | -10% $72 | -5% $-1 | +0% $-74 | +5% $-147 | +10% $-220 |
|---|---|---|---|---|---|
| Rent | -10% $-227 | -5% $-151 | +0% $-74 | +5% $2 | +10% $79 |
| Rate | -1.0pp $56 | -0.5pp $-9 | base $-74 | +0.5pp $-141 | +1.0pp $-209 |
UW: 25.0% down · 7.5% · 30yr · 1.5% tax · 5.0% vac · 8.0% maint · 8.0% mgmt
Financing live
Cash to close
- Down payment
- $64,500
- Closing costs
- $7,740
- Reserves months
- —
- Total cash needed
- —
Loan-product check · same deal, 3 products live
Conventional
25% down · 7.5% · 30yr
- Down + closing
- —
- Monthly P&I
- —
- Monthly cashflow
- —
- DSCR
- —
- Eligible?
- —
Personal DTI + credit; lowest rate.
DSCR
20% down · 8.5% · 30yr
- Down + closing
- —
- Monthly P&I
- —
- Monthly cashflow
- —
- DSCR
- —
- Eligible?
- —
No personal income docs; deal must DSCR.
Hard money
10% down · 12.0% · 12mo
- Down + closing
- —
- Monthly P&I
- —
- Monthly cashflow
- —
- DSCR
- —
- Eligible?
- —
Short-term bridge; refi at stabilization.
Rent comps 25 comps
| Address | Beds | Baths | Sqft | Rent | $/sqft | DOM | Units | Dist |
|---|---|---|---|---|---|---|---|---|
| 1255 Tahoe Ct Orange Park, FL | 3.0 | 2.0 | 1305 | $1,916 | $1.47 | 9d | 1 | 0.08mi |
| 2921 Andy Ct Orange Park, FL | 3.0 | 2.0 | 1658 | $1,885 | $1.14 | 6d | 1 | 0.34mi |
| 25 Knight Boxx Rd Orange Park, FL | 1.0–3.0 | 1.0–2.0 | 1109 | $1,863 | $1.68 | 4d | 18 | 0.86mi |
| 1281 Independence Dr Orange Park, FL | 3.0 | 2.0 | 1087 | $1,695 | $1.56 | 25d | 1 | 0.95mi |
| 1267 Suffolk Pl Orange Park, FL | 3.0 | 2.0 | 1209 | $1,820 | $1.51 | 0d | 1 | 0.99mi |
| 2804 Canyon Ct Orange Park, FL | 3.0 | 2.0 | 1367 | $1,824 | $1.33 | 16d | 1 | 1.00mi |
| 3248 Dowitcher Ln Orange Park, FL | 3.0 | 2.0 | 1156 | $1,550 | $1.34 | 25d | 1 | 1.03mi |
| 3223 Merganzer Trl Orange Park, FL | 3.0 | 2.0 | 1155 | $1,755 | $1.52 | 25d | 1 | 1.10mi |
| 1270 Ticonderoga Trl Unit C Orange Park, FL | 2.0 | 2.0 | 922 | $1,300 | $1.41 | 25d | 1 | 1.10mi |
| 1248 Ticonderoga Trl Unit C Orange Park, FL | 2.0 | 2.0 | 922 | $1,195 | $1.30 | 9d | 1 | 1.12mi |
| 1324 Jefferson Ave Orange Park, FL | 2.0 | 2.0 | 926 | $1,245 | $1.34 | 25d | 1 | 1.12mi |
| 1324 Jefferson Ave Orange Park, FL | 2.0 | 2.0 | 922 | $1,245 | $1.35 | 4d | 1 | 1.12mi |
| 1330 Jefferson Ave Orange Park, FL | 2.0 | 2.0 | 922 | $1,250 | $1.36 | 18d | 1 | 1.13mi |
| 1333 Jefferson Ave Unit D Orange Park, FL | 2.0 | 2.0 | 922 | $1,325 | $1.44 | 25d | 1 | 1.18mi |
| 3296 Isabella Ct Unit 3296 Orange Park, FL | 3.0 | 2.5 | 1714 | $2,050 | $1.20 | 25d | 1 | 1.20mi |
| 3296 Isabella Ct Unit 1 Orange Park, FL | 3.0 | 2.5 | 1800 | $2,050 | $1.14 | 5d | 1 | 1.20mi |
| 3296 Isabella Ct Orange Park, FL | 3.0 | 2.5 | 1800 | $2,050 | $1.14 | 6d | 1 | 1.20mi |
| 1504 Pawnee St Orange Park, FL | 3.0 | 2.0 | 1338 | $1,795 | $1.34 | 22d | 1 | 1.20mi |
| 2897 Gatling Blvd Orange Park, FL | 3.0 | 2.0 | 1338 | $1,650 | $1.23 | 9d | 1 | 1.24mi |
| 2796 Kiowa Ave Orange Park, FL | 3.0 | 2.0 | 1274 | $1,855 | $1.46 | 0d | 1 | 1.24mi |
| 1953 Longneedle Ln Middleburg, FL | 4.0 | 2.0 | 1564 | $1,965 | $1.26 | 19d | 1 | 1.38mi |
| 1568 Backwater Dr Middleburg, FL | 3.0 | 2.0 | 1594 | $1,895 | $1.19 | 25d | 1 | 1.38mi |
| 1608 Twin Oak Dr W Middleburg, FL | 3.0 | 2.0 | 1272 | $1,905 | $1.50 | 0d | 1 | 1.40mi |
| 3764 Athenian Way Middleburg, FL | 3.0 | 2.5 | 1433 | $1,900 | $1.33 | 5d | 1 | 1.43mi |
| 1338 Pawnee St Orange Park, FL | 3.0 | 2.0 | 1324 | $1,905 | $1.44 | 22d | 1 | 1.46mi |
Listing history 4 events
-
2026-04-16historical
-
2026-04-01$258,000
-
2006-03-10historical 246-char remark
Show marketing remark (246 chars)
Fantastic home. Has lot of xtras - inground pool, sprinkler system w/well, glassed porch, ceramic tile, fireplace & skylights. Home needs a little TLC. Mostly cosmetic. Bring your buyers and best offers. Thanks for showing. Please leave card.
-
2005-12-21$165,000 246-char remark
Show marketing remark (246 chars)
Fantastic home. Has lot of xtras - inground pool, sprinkler system w/well, glassed porch, ceramic tile, fireplace & skylights. Home needs a little TLC. Mostly cosmetic. Bring your buyers and best offers. Thanks for showing. Please leave card.
ⓘ Source: listings_history table (triggers on properties + properties_extension) + one-shot
backfill from property_details.listing_events for pre-trigger history.
Tax reassessment forecast FL · Resets to sale price
- Current annual tax
- $1,708 · $142/mo
- Projected year-2 tax
- $2,141 · $178/mo
- Expected delta
- +$434/yr (+$36/mo · 25.4%)
ⓘ Screening estimate from a state-policy table — verify with the county assessor before closing.
Climate risk First Street
- Flood 1/10 Low FEMA zone X (unshaded) · 0% chance over 30 yrs
- Wildfire 5/10 Major
- Heat 8/10 Severe 7 d/yr ≥107°F today · 19 d/yr by 30 yrs out
- Wind 9/10 Extreme 99% chance of damaging wind over 30 yrs
- Air quality 3/10 Moderate 3 unhealthy d/yr today · 3 by 30 yrs out
Nearby sold comps map
Loading sold comps map…
Walkable amenities ~0.75 mi
Loading nearby amenities…
Taxation est. · year 1
- Rental income
- $23,217
- − Mortgage interest
- −$14,452
- − Property taxes
- −$1,708
- − Insurance
- −$1,290
- − Repairs & maintenance
- −$1,857
- − Management
- −$1,857
- − Depreciation
- −$7,505
- Taxable loss
- −$5,453
- Est. tax savings @ 24.0%
- +$1,309
- After-tax cash flow
- $417/yr
For passive investors: Depreciation is non-cash, so a rental often shows a tax loss while cash-flowing — sheltering income. Rental losses are passive: they offset passive income freely, and up to $25,000/yr can offset ordinary (W-2) income if you actively participate and your MAGI is under $100k (phasing out to $0 by $150k); unused losses carry forward. On sale, claimed depreciation is recaptured at up to 25%, and gains may owe capital-gains tax (a 1031 exchange can defer both). Figures are a year-1 estimate at your 24.0% rate — not tax advice; consult a CPA.
Schools (NCES district)
- District
- Clay
- NCES district ID
- 1200300
- Math proficiency
- 58% ▼ -8.00%
- Reading proficiency
- 59% ▼ -3.00%
- Median HH income
- $59,379
- Composite
- 50.73/100
- National rank
- #1815
- State rank
- #14 of 73 in FL
Livability — Lakeside
- Score
- 68/100
- State rank
- #505
- US rank
- #9341
Category grades
Schools grade is shown separately in the Schools card above.
Census & demographics
- Census place
- Lakeside, FL
- County
- Clay County · 208,450 people
- Metro
- Jacksonville, FL
- Population (ZIP)
- 41,578
- Household income
- $97,455
- Rent vs Own
- Severe rent burden
- 1129.0
Population outlook (Clay County) Hauer SSP2
- Today (2025)
- 230,495 people
- By 2030
- 242,427 · +5.2%
- By 2040
- 262,244 · +13.8%
- By 2050
- 275,148 · +19.4%
- By 2075
- 295,397 · +28.2%
- By 2100
- 287,592 · +24.8%
Race, ethnicity, and origin ACS 2023
- Neighborhood character
- Diverse neighborhood (Simpson 0.67)
- Race & ethnicity
- White 51% Black 20% Hispanic / Latino 15% Two or more races 15% Asian 6%
- Hispanic origin (detail)
- Mexican 3% Puerto Rican 5% Cuban 3%
- Common ancestry
- Lithuanian 4% Romanian 2% Portuguese 2%
- Foreign-born
- 8% · Canada, China
- Languages at home
- 88% English-only · Spanish 7% Tagalog/Filipino 3% Other Asian/Pacific 1%
Political lean MEDSL · Clay
- 2024 margin
- Solid R (+39.3) · D 29.9% · R 69.2%
- 2008→2024 swing
- +3.6pp toward D · 2008: -42.8pp · 2024: -39.3pp
- All cycles
- 2024: R+39.3 2020: R+37.1 2016: R+44.3 2012: R+45.8 2008: R+42.8
Not yet ingested
- Civics
- —
Market trends
- HPI YoY
- ▼ -95.13%
- Current HPI
- 276.5987
- Rent YoY
- ▲ 3.73%
- Metro
- Jacksonville, FL
- State GDP YoY
- ▲ 3.28%
- F500 in state
- 36
Industry mix (Fortune 500 HQ in FL)
| Industry | F500 HQs | Revenue |
|---|---|---|
| Industrial Technology | 2 | $29B |
|
||
| Insurance | 2 | $17B |
|
||
| Retail | 1 | $60B |
|
||
| Technology Distribution | 1 | $58B |
|
||
| Homebuilding | 1 | $35B |
|
||
| Technology Manufacturing | 1 | $35B |
|
||
Price history
+56.4% since first listed4 events — show timeline
- 2026-04-16 Listing Removed — realMLS
- 2026-04-01 Listed $258,000 realMLS
- 2006-03-10 Listing Removed — realMLS
- 2005-12-21 Listed $165,000 realMLS
Property tax history
+3.0%/yrLatest (2025): $1,708 · +4.1% YoY. Source: county tax records.
Cash-flow waterfall
monthlySold comps — $/sqft
last 12 mo · ≤1 miLoading sold comps…