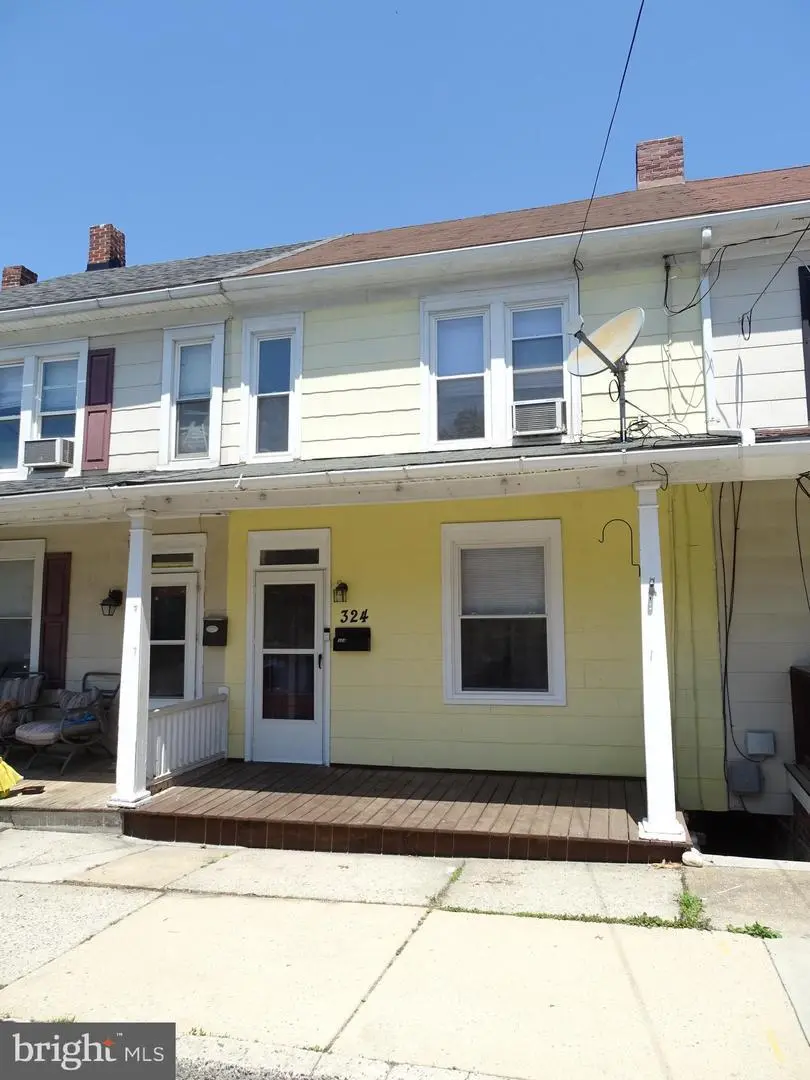
324 Atlantic Ave · Red Lion, PA
Flood risk 1/10 · Minimal
- FEMA flood zone
- X (unshaded)
- Chance of flooding over 30 yrs
- 0.0%
- Est. flood insurance / yr
- $473 – $860
Fire risk 1/10 · Minimal
- Est. fire insurance / yr
- $511 – $949
Heat risk 5/10 · Moderate
- Hot days now (above 100°F)
- 7 days/yr
- Hot days in 30 yrs
- 15 days/yr
Wind risk 4/10 · Minor
- Chance of severe wind over 30 yrs
- 12.0%
Air-quality risk 3/10 · Minor
- Unhealthy air days now
- 2 days/yr
- Unhealthy air days in 30 yrs
- 5 days/yr
Risk factors via First Street. Map © Google.
Why this score? — see what drove the D grade
The composite is a weighted blend of 9 inputs, each scored 0–100. Each bar is that input's sub-score; the figure is the points it added to the 100-point composite (weight × sub-score).
- Cash flow +15.4/30.0
- ARV discount +7.5/15.0
- DSCR +4.7/10.0
- 1% rule +4.0/10.0
- Livability +3.9/5.0
- Schools +3.8/10.0
- Rent growth +2.5/5.0
- Condition / age +2.5/5.0
- Appreciation +0.0/10.0
$164,900
🖨 Deal sheet (PDF) 📄 Offer letter ✓ Due diligence
Listing remarks MLS
This home is totally renovated. All new paint, carpet and vinyl floors plus all three bedrooms w/ nice size closets. New interior doors. New replacement windows through-out. New furnace, dishwasher and built-in microwave. All appliances included. Newly remodeled kitchen & bath. All this for under 105K in Red Lion Schools. Must take a look!
Key facts
- Covered front porch
- Walk up attic
- Updated eat-in-kit
Tags
Property features AI
Finance
- Other: Pets allowed with no restrictions
- HOA & community: Ground rent paid annually
Exterior
- Parking: Public on-street parking
- Utilities: Public water; Public sewer; 100 amp electric service; Natural gas available (heating and hot water); Cable available; Phone available
- Home design: Interior townhouse/rowhouse; Fee simple ownership; Not in a federal flood zone; Suburban location; Paved roads
- Construction: Built with asbestos siding; Asphalt roof; Brick/mortar foundation; Full poured concrete basement (unfinished); Building not winterized; Double-pane replacement insulated windows
- Exterior features: Sidewalks; Rear yard; Porch(es); Balcony
Interior
- Kitchen: Built-in microwave; Dishwasher; Gas range/oven; Refrigerator; Eat-in kitchen
- Bedrooms: Three bedrooms on the primary upper level
- Flooring: Carpet; Wood floors; Vinyl
- Bathrooms: One full bathroom
- Heating & cooling: Forced air heating (natural gas); Window air conditioning units; Ceiling fans
- Interior features: Attic; Tub with shower; Ceiling fans; Crown moldings; Traditional floor plan; Formal separate dining room; Eat-in kitchen; Window treatments
- Laundry & utility: Washer and dryer; Laundry in basement
Neighborhood map
What this means for you Summary
Snapshot
- This is a 3-bed/2.0-bath townhouse listed at $165k.
Deal economics
- At list price, monthly cash flow is $62 ($747/yr) — positive.
- The deal already cash-flows at list — no discount required.
- To meet the 1% rule (rent ≥ 1% of price), the offer needs to be $149k (9.5% below list).
- Recommended offer: $149k (9.5% below list) — sets the bar for 1% rule.
- Cap rate 6.7% vs local median 4.5% in Red Lion — top-decile yield for the area; either an underpriced asset or a hidden risk that comps aren't pricing in. Stress-test before assuming the spread holds.
Location & tenants
- Location reads 77/100 on livability (#349 in PA, #3,056 nationally) — a middle-class / working-renter tenant base. Strengths: cost of living A+, housing A+, health & safety A+; Watch: amenities D, commute F.
- Red Lion Area SD (suburban): math 36% / reading 50% proficiency, ranked #282 of 539 in PA (top 52%) — families likely to look elsewhere, expect single-tenant / working-renter base with shorter leases.
- Zoned schools: Mazie Gable El Sch (math 23% / reading 39%, grade F, #1,116 of 1,518 statewide, top 74%, 523 students, 73% FRL); Red Lion Area Jhs (math 23% / reading 49%, grade F, #313 of 512 statewide, top 62%, 813 students, 50% FRL); Red Lion Area Shs (math 63% / reading 24%, grade F, #211 of 437 statewide, top 48%, 1,432 students, 44% FRL) — zoned schools average 56% FRL vs 28% district-wide (27 pts higher); higher-poverty schools than district average — tighter screening recommended.
- Market conditions: 147 active listings in the ZIP; 7 comparable units currently listed for rent nearby; rentals at typical pace (median 23d on market — plan ~3-4 weeks tenant-placement turnaround); solid renter incomes; 1,328 units permitted in York County in 2024 (338 in 5+ unit buildings).
Forward outlook
- Local home prices are declining (-3.0%/yr); year-one equity from $1k of loan paydown is wiped out by about $5k of value loss. Plan a longer hold.
Negotiation context
- Only 8 days on market — expect competitive offers; lowballing is unlikely to land.
- 3 sale attempts since 17y ago with the ask held roughly flat each time — persistent listings suggest the price (not the market) is what's stuck; bring a comps-based counter.
- Current owner paid $102k; list at $165k implies a 62% gain — meaningful room to come down on a strong offer.
Risks & watch-outs
- Watch-outs: built in 1920 — expect roof / HVAC / electrical / plumbing capex.
- Climate carrying-cost: extreme-heat days projected 7→15/yr by 2055 (HVAC capex compounding) — expect insurance premiums to compound above CPI over the hold.
Questions for the listing agent
- Built in 1920 — when were the roof, HVAC, electrical panel, plumbing, and water heater last replaced?
- Is there a deadline driving the sale (1031 exchange, divorce, estate, relocation)? That informs how much negotiation room exists.
- The area grade is low — what's the realistic commute time and amenity access for the typical tenant pool here? Any planned neighborhood developments (good or bad) we should know about?
- What's the average days-on-market for RENTAL listings here right now (not sales)? A rising rental-DOM trend means longer vacancies and softer asking-rent achievability than the comps imply.
- What's the recent tenant-quality profile in this submarket — average credit score on applications, eviction rate, late-payment / NSF rate, and stable-employment percentage? A property-management company in the area should have these aggregated.
- How much new for-sale + rental construction is in the pipeline within 1–3 miles? Heavy new supply typically softens prices + rents 12–24 months out; constrained supply supports both.
Investment metrics
- 1% rule
- 0.90% ✗
- Cap rate
- 6.75%
- Cash-on-cash
- 1.62%
- DSCR
- 1.07
- GRM
- 9.2
CMA / ARV
- ARV (on-the-fly)
- $164,772
- Comps found
- 12
Show comp detail 12 sales within ~0.75 mi
| Address | Dist | Beds/Ba | Sqft | Sold | Price | $/sf | Match |
|---|---|---|---|---|---|---|---|
| 338 Atlantic Ave | 0.03mi | 3/1.5 | 1,194 (0%) | 7mo | $154,900 | $130 | 91 |
| 651 W Broadway | 0.15mi | 3/2.0 | 1,176 (-2%) | 12mo | $199,500 | $170 | 80 |
| 653 W Broadway | 0.15mi | 3/1.0 | 1,176 (-2%) | 12mo | $182,000 | $155 | 77 |
| 118 Keener Ave | 0.21mi | 3/— | 1,286 (+8%) | 1mo | $176,750 | $137 | 77 |
| 122 N Main St | 0.38mi | 3/1.0 | 1,176 (-2%) | 1mo | $150,000 | $128 | 75 |
| 347 W Broadway | 0.12mi | 4/1.0 (+1) | 1,260 (+6%) | 12mo | $135,000 | $107 | 67 |
| 254 W High St | 0.25mi | 3/2.0 | 1,313 (+10%) | 8mo | $205,000 | $156 | 65 |
| 171 Linden Ave | 0.25mi | 3/1.0 | 1,344 (+13%) | 2mo | $174,000 | $129 | 62 |
| 357 Country Clb #26 | 0.29mi | 2/2.0 (-1) | 1,080 (-10%) | 8mo | $170,000 | $157 | 59 |
| 116 Furlong Way | 0.68mi | 2/2.0 (-1) | 1,175 (-2%) | 4mo | $230,000 | $196 | 58 |
| 231 W High St | 0.27mi | 4/2.0 (+1) | 1,300 (+9%) | 12mo | $142,500 | $110 | 58 |
| 270 N Main St | 0.53mi | 4/1.0 (+1) | 1,340 (+12%) | 6mo | $185,000 | $138 | 41 |
Match score weights: distance 35% · size 25% · config 20% · recency 20%. Top-matched comps best support the ARV.
Projected returns pro-forma
-3.0% appreciation · 3.0% rent growth · sell at horizon
- IRR
- -13.7%
- Equity multiple
- 0.51×
- Total profit
- $-22,749
- Equity at exit
- $24,587
- IRR
- -4.8%
- Equity multiple
- 0.68×
- Total profit
- $-14,672
- Equity at exit
- $14,258
Cash invested: $46,172 (down + closing). Projections, not guarantees.
Landlord ↔ Tenant lean methodology
- Overall (STATE)
- 62 Landlord-Friendly
- State Pennsylvania
- 62 Landlord-Friendly · EVEN
- County
- — inherits STATE
- City
- — inherits STATE
ZIP-level market 17356
- Home prices YoY
- -21.0%
- Active inventory
- 147
- Price-to-rent
- 9.2×
Monthly cashflow live
- Estimated rent
- $1,492 high interval (Pro) →
- Mortgage (P&I)
- −$865
- Tax from tax record
- −$183 /mo · $2,198/yr
- Insurance
- −$69
- HOA
- −$0
- Vacancy / Maint / Mgmt
- −$313
- Net cashflow
- $62
Break-even live
Sensitivity live
| Price | -10% $156 | -5% $109 | +0% $62 | +5% $16 | +10% $-31 |
|---|---|---|---|---|---|
| Rent | -10% $-56 | -5% $3 | +0% $62 | +5% $121 | +10% $180 |
| Rate | -1.0pp $145 | -0.5pp $104 | base $62 | +0.5pp $19 | +1.0pp $-24 |
UW: 25.0% down · 7.5% · 30yr · 1.5% tax · 5.0% vac · 8.0% maint · 8.0% mgmt
Financing live
Cash to close
- Down payment
- $41,225
- Closing costs
- $4,947
- Reserves months
- —
- Total cash needed
- —
Loan-product check · same deal, 3 products live
Conventional
25% down · 7.5% · 30yr
- Down + closing
- —
- Monthly P&I
- —
- Monthly cashflow
- —
- DSCR
- —
- Eligible?
- —
Personal DTI + credit; lowest rate.
DSCR
20% down · 8.5% · 30yr
- Down + closing
- —
- Monthly P&I
- —
- Monthly cashflow
- —
- DSCR
- —
- Eligible?
- —
No personal income docs; deal must DSCR.
Hard money
10% down · 12.0% · 12mo
- Down + closing
- —
- Monthly P&I
- —
- Monthly cashflow
- —
- DSCR
- —
- Eligible?
- —
Short-term bridge; refi at stabilization.
Rent comps 7 comps
| Address | Beds | Baths | Sqft | Rent | $/sqft | DOM | Units | Dist |
|---|---|---|---|---|---|---|---|---|
| 305 W Broadway Red Lion, PA | 2.0 | 1.0 | 968 | $1,395 | $1.44 | 45d | 1 | 0.16mi |
| 16 W High St Red Lion, PA | 3.0 | 1.0 | 1075 | $1,075 | $1.00 | 23d | 1 | 0.35mi |
| 21 E Lancaster St Red Lion, PA | 2.0 | 1.0 | 900 | $1,295 | $1.44 | 45d | 1 | 0.57mi |
| 201 Burrows Rd Red Lion, PA | 3.0 | 2.5 | 1485 | $1,924 | $1.30 | 15d | 1 | 0.72mi |
| 361 E Maple St Dallastown, PA | 2.0 | 1.0 | 750 | $1,005 | $1.34 | 23d | 1 | 1.28mi |
| 100 E Broad St Dallastown, PA | 2.0 | 1.0 | 920 | $950 | $1.03 | 15d | 1 | 1.33mi |
| 306 Orchard Ct Red Lion, PA | 2.0 | 1.5 | 1300 | $1,495 | $1.15 | 23d | 1 | 1.49mi |
Listing history 6 events
-
2026-05-21$164,900 Active
-
2010-05-19soldstatus $102,000
-
2010-05-13soldstatus $102,000 347-char remark
Show marketing remark (347 chars)
This home is totally renovated. All new paint, carpet and vinyl floors plus all three bedrooms w/ nice size closets. New interior doors. New replacement windows through-out. New furnace, dishwasher and built-in microwave. All appliances included. Newly remodeled kitchen & bath. All this for under 105K in Red Lion Schools. Must take a look!
-
2010-02-01$104,900 347-char remark
Show marketing remark (347 chars)
This home is totally renovated. All new paint, carpet and vinyl floors plus all three bedrooms w/ nice size closets. New interior doors. New replacement windows through-out. New furnace, dishwasher and built-in microwave. All appliances included. Newly remodeled kitchen & bath. All this for under 105K in Red Lion Schools. Must take a look!
-
2009-12-09soldstatus $43,000 96-char remark
Show marketing remark (96 chars)
Home in need of updating-mechanical & cosmetic. Good roof. Great for investor. Sold As-Is!
-
2009-09-17$55,000 96-char remark
Show marketing remark (96 chars)
Home in need of updating-mechanical & cosmetic. Good roof. Great for investor. Sold As-Is!
ⓘ Source: listings_history table (triggers on properties + properties_extension) + one-shot
backfill from property_details.listing_events for pre-trigger history.
Tax reassessment forecast PA · Partial reset (capped growth)
- Current annual tax
- $2,198 · $183/mo
- Projected year-2 tax
- $2,402 · $200/mo
- Expected delta
- +$204/yr (+$17/mo · 9.3%)
ⓘ Screening estimate from a state-policy table — verify with the county assessor before closing.
Climate risk First Street
- Flood 1/10 Low FEMA zone X (unshaded) · 0% chance over 30 yrs
- Wildfire 1/10 Low
- Heat 5/10 Major 7 d/yr ≥100°F today · 15 d/yr by 30 yrs out
- Wind 4/10 Moderate 12% chance of damaging wind over 30 yrs
- Air quality 3/10 Moderate 2 unhealthy d/yr today · 5 by 30 yrs out
Nearby sold comps map
Loading sold comps map…
Walkable amenities ~0.75 mi
Loading nearby amenities…
Taxation est. · year 1
- Rental income
- $17,906
- − Mortgage interest
- −$9,237
- − Property taxes
- −$2,198
- − Insurance
- −$824
- − Repairs & maintenance
- −$1,433
- − Management
- −$1,433
- − Depreciation
- −$4,797
- Taxable loss
- −$2,015
- Est. tax savings @ 24.0%
- +$484
- After-tax cash flow
- $1,230/yr
For passive investors: Depreciation is non-cash, so a rental often shows a tax loss while cash-flowing — sheltering income. Rental losses are passive: they offset passive income freely, and up to $25,000/yr can offset ordinary (W-2) income if you actively participate and your MAGI is under $100k (phasing out to $0 by $150k); unused losses carry forward. On sale, claimed depreciation is recaptured at up to 25%, and gains may owe capital-gains tax (a 1031 exchange can defer both). Figures are a year-1 estimate at your 24.0% rate — not tax advice; consult a CPA.
Schools (NCES district)
- District
- Red Lion Area SD
- NCES district ID
- 4220100
- Math proficiency
- 36% ▼ -10.00%
- Reading proficiency
- 50% ▼ -10.00%
- Median HH income
- $60,225
- Composite
- 37.91/100
- National rank
- #4313
- State rank
- #282 of 539 in PA
Livability — Red Lion
- Score
- 77/100
- State rank
- #349
- US rank
- #3056
Category grades
Schools grade is shown separately in the Schools card above.
Census & demographics
- Census place
- Red Lion, PA
- County
- York County · 278,806 people
- City population
- 22,869
- Metro
- York-Hanover, PA
- Population (ZIP)
- 22,869
- Household income
- $86,561
- Rent vs Own
- Severe rent burden
- 559.0
Population outlook (York County) Hauer SSP2
- Today (2025)
- 454,205 people
- By 2030
- 457,407 · +0.7%
- By 2040
- 457,529 · +0.7%
- By 2050
- 448,261 · -1.3%
- By 2075
- 427,388 · -5.9%
- By 2100
- 384,218 · -15.4%
Race, ethnicity, and origin ACS 2023
- Neighborhood character
- Predominantly White (89%)
- Race & ethnicity
- White 89% Black 4% Two or more races 4% Asian 2% Hispanic / Latino 2%
- Common ancestry
- Romanian 3% Slovak 3% Serbian 2%
- Foreign-born
- 4% · China
- Languages at home
- 95% English-only · Russian/Polish/Slavic 1% Chinese 1% Other Indo-European 1%
Political lean MEDSL · York
- 2024 margin
- Strong R (+25.3) · D 36.9% · R 62.1%
- 2008→2024 swing
- -11.7pp toward R · 2008: -13.6pp · 2024: -25.3pp
- All cycles
- 2024: R+25.3 2020: R+24.6 2016: R+29.3 2012: R+21.2 2008: R+13.6
Not yet ingested
- Civics
- —
Market trends
- HPI YoY
- ▼ -69.16%
- Current HPI
- 259.7294
- Rent YoY
- —
- Metro
- York-Hanover, PA
- State GDP YoY
- ▲ 1.68%
- F500 in state
- 34
Industry mix (Fortune 500 HQ in PA)
| Industry | F500 HQs | Revenue |
|---|---|---|
| Healthcare | 2 | $309B |
|
||
| Insurance | 2 | $27B |
|
||
| Telecommunications / Media | 1 | $124B |
|
||
| Industrial Distribution | 1 | $22B |
|
||
| Financial Services | 1 | $20B |
|
||
| Chemicals / Materials | 1 | $18B |
|
||
Price history
+199.8% since first listed6 events — show timeline
- 2026-05-21 Listed $164,900 BRIGHT MLS
- 2010-05-19 Sold (Public Records) $102,000 Public Records
- 2010-05-13 Sold (MLS) $102,000 BRIGHT MLS
- 2010-02-01 Listed $104,900 BRIGHT MLS
- 2009-12-09 Sold (MLS) $43,000 BRIGHT MLS
- 2009-09-17 Listed $55,000 BRIGHT MLS
Property tax history
+0.9%/yrLatest (2025): $2,198 · +3.0% YoY. Source: county tax records.
Cash-flow waterfall
monthlySold comps — $/sqft
last 12 mo · ≤1 miLoading sold comps…