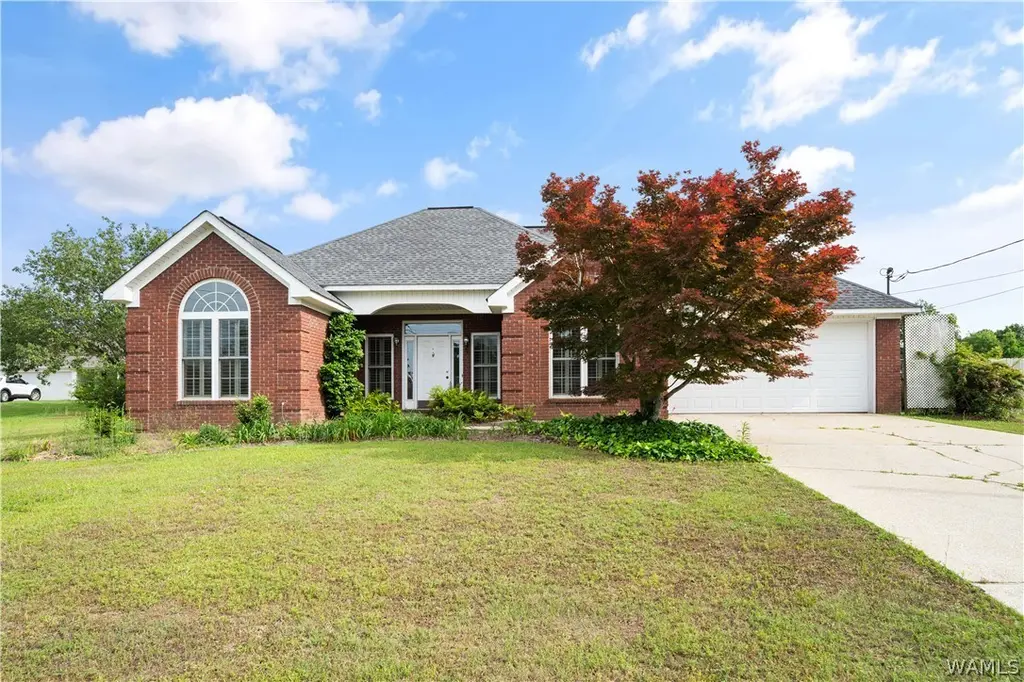
14269 Southland Dr · Tuscaloosa, AL
Flood risk 1/10 · Minimal
- FEMA flood zone
- X (unshaded)
- Chance of flooding over 30 yrs
- 0.0%
- Est. flood insurance / yr
- $507 – $1,088
Fire risk 3/10 · Minor
- Est. fire insurance / yr
- $916 – $1,700
Heat risk 7/10 · Major
- Hot days now (above 108°F)
- 7 days/yr
- Hot days in 30 yrs
- 21 days/yr
Wind risk 6/10 · Moderate
- Chance of severe wind over 30 yrs
- 76.0%
Air-quality risk 1/10 · Minimal
- Unhealthy air days now
- 0 days/yr
- Unhealthy air days in 30 yrs
- 0 days/yr
Risk factors via First Street. Map © Google.
Why this score? — see what drove the D- grade
The composite is a weighted blend of 9 inputs, each scored 0–100. Each bar is that input's sub-score; the figure is the points it added to the 100-point composite (weight × sub-score).
- ARV discount +15.0/15.0
- Cash flow +8.3/30.0
- Rent growth +3.9/5.0
- Livability +3.9/5.0
- Schools +2.9/10.0
- Condition / age +2.5/5.0
- DSCR +2.3/10.0
- 1% rule +1.3/10.0
- Appreciation +0.0/10.0
$259,900
🖨 Deal sheet 📄 Offer letter ✓ Due diligence
Listing remarks
Well-maintained three-bedroom, two-bath home with an open-concept layout designed for comfortable living. The kitchen offers ample storage and flows seamlessly into the main living and dining areas, making it a space for everyday use and entertaining. The living room features a wood-burning fireplace, adding warmth and character to the space. The primary suite includes a spacious bathroom with double sinks, a separate tub, and a walk-in shower. Additional made for outdoor gatherings and relaxation. This home offers a functional layout with plenty of space inside and out.
Key facts
- Double sinks
- Separate tub
- Spacious bathroom
Tags
Property features AI
Finance
- Other: Located in Southland Estates
Exterior
- Parking: Concrete driveway
- Utilities: Septic tank sewer
- Home design: Single-family residence; One story
- Construction: Brick construction; Composition/shingle roof
- Exterior features: Paved road access; No pool
Interior
- Bathrooms: 2 full bathrooms
- Heating & cooling: Has heating; Has cooling
- Interior features: Wood-burning fireplace; Water heater
- Laundry & utility: Dedicated laundry room
Neighborhood map
What this means for you Summary
Snapshot
- This is a 3-bed/2.0-bath single-family listed at $260k.
Deal economics
- At list price, monthly cash flow is $-238 ($-3k/yr) — negative.
- To cash-flow at today's rent, offer at most $218k (16.2% below list).
- To meet the 1% rule (rent ≥ 1% of price), the offer needs to be $163k (37.3% below list).
- Recommended offer: $163k (37.3% below list) — sets the bar for 1% rule.
- Cap rate 5.2% vs local median 3.4% in Tuscaloosa — top-decile yield for the area; either an underpriced asset or a hidden risk that comps aren't pricing in. Stress-test before assuming the spread holds.
Location & tenants
- Location reads 77/100 on livability (#9 in AL, #2,909 nationally) — a middle-class / working-renter tenant base. Strengths: amenities A+, health & safety A+, cost of living A; Watch: crime F, employment D-.
- Tuscaloosa County (suburban): math 21% / reading 45% proficiency, ranked #47 of 129 in AL (top 36%) — families likely to look elsewhere, expect single-tenant / working-renter base with shorter leases.
- Zoned schools: Big Sandy Elementary (math 32% / reading 57%, grade F, #171 of 627 statewide, top 31%, 480 students, 54% FRL); Duncanville Middle School (math 18% / reading 51%, grade F, #90 of 257 statewide, top 38%, 463 students, 65% FRL); Hillcrest High School (math 18% / reading 26%, grade F, #142 of 305 statewide, top 51%, 1,356 students, 65% FRL) — zoned schools average 61% FRL vs 45% district-wide (16 pts higher); higher-poverty schools than district average — tighter screening recommended.
- Market conditions: Rents rising fast (+5.4%/yr); 457 active listings in the ZIP; 3 comparable units currently listed for rent nearby; rentals leasing fast (median 12d on market — plan ~1-2 weeks tenant-placement turnaround); 622 units permitted in Tuscaloosa County in 2024 (69 in 5+ unit buildings).
- This rent runs 31% of the median local income ($62k/yr) — at the standard rent-burdened threshold; future hikes will face affordability resistance.
Forward outlook
- Local home prices are declining (-3.0%/yr); year-one equity from $2k of loan paydown is wiped out by about $8k of value loss. Plan a longer hold.
- Tuscaloosa County population projected at +26% by 2050 — long-run rental-demand tailwind backs the buy-and-hold thesis.
Negotiation context
- It's been on market 22 days — a 2% lower offer ($256k) is reasonable based on typical stale-listing flexibility.
- 2 sale attempts with the ask held roughly flat each time — persistent listings suggest the price (not the market) is what's stuck; bring a comps-based counter.
Risks & watch-outs
- Climate carrying-cost: major wind risk, 76% chance of damaging wind over 30y; extreme-heat days projected 7→21/yr by 2055 (HVAC capex compounding) — expect insurance premiums to compound above CPI over the hold.
Questions for the listing agent
- What do current leases actually rent for vs. the listed asking? Can we see a recent rent roll and the last 12 months of T-12 income?
- Is there a deadline driving the sale (1031 exchange, divorce, estate, relocation)? That informs how much negotiation room exists.
- Crime grade is F in this area — have there been break-ins, vandalism, or insurance claims at this property in the last 3 years? What carrier currently insures it and at what premium?
- The area grade is low — what's the realistic commute time and amenity access for the typical tenant pool here? Any planned neighborhood developments (good or bad) we should know about?
- What's the average days-on-market for RENTAL listings here right now (not sales)? A rising rental-DOM trend means longer vacancies and softer asking-rent achievability than the comps imply.
- What's the recent tenant-quality profile in this submarket — average credit score on applications, eviction rate, late-payment / NSF rate, and stable-employment percentage? A property-management company in the area should have these aggregated.
- How much new for-sale + rental construction is in the pipeline within 1–3 miles? Heavy new supply typically softens prices + rents 12–24 months out; constrained supply supports both.
Investment metrics
- 1% rule
- 0.63% ✗
- Cap rate
- 5.20%
- Cash-on-cash
- -3.92%
- DSCR
- 0.83
- GRM
- 13.3
CMA / ARV
- ARV (median comp)
- $312,840
- List price
- $259,900
- Delta
- -16.92%
- Verdict
- UNDERPRICED
- Comps
- 20 within 1.0 mi
Show comp detail 12 sales within ~0.75 mi
| Address | Dist | Beds/Ba | Sqft | Sold | Price | $/sf | Match |
|---|---|---|---|---|---|---|---|
| 14439 Griffin St | 0.24mi | 4/3.0 (+1) | 1,847 (+1%) | 7mo | $280,000 | $152 | 72 |
| 14149 Delta Dr | 0.28mi | 3/2.0 | 1,932 (+6%) | 9mo | $147,000 | $76 | 70 |
| 14148 River Point Cir Cir | 0.57mi | 3/2.0 | 1,771 (-3%) | 1mo | $289,900 | $164 | 68 |
| 11679 River Point Way | 0.53mi | 3/2.0 | 1,826 (+0%) | 9mo | $335,000 | $183 | 68 |
| 14675 Griffin St | 0.49mi | 4/2.0 (+1) | 1,685 (-8%) | 3mo | $251,500 | $149 | 57 |
| 14390 Gentry Drive Dr | 0.44mi | 3/2.0 | 1,623 (-11%) | 5mo | $248,000 | $153 | 57 |
| 10419 Caleb Ct | 0.69mi | 4/2.0 (+1) | 1,852 (+2%) | 5mo | $282,530 | $153 | 56 |
| 10402 Caleb Ct | 0.69mi | 4/2.0 (+1) | 1,852 (+2%) | 6mo | $279,990 | $151 | 56 |
| 11616 River Point Ln | 0.67mi | 4/2.0 (+1) | 1,879 (+3%) | 5mo | $340,000 | $181 | 55 |
| 11587 Kings Loop Rd | 0.58mi | 4/2.0 (+1) | 2,000 (+10%) | 8mo | $275,000 | $138 | 45 |
| 11610 River Point Way | 0.59mi | 4/2.0 (+1) | 2,060 (+13%) | 4mo | $369,900 | $180 | 43 |
| 14030 Sir Lancelot Dr | 0.75mi | 4/2.0 (+1) | 1,559 (-14%) | 9mo | $269,900 | $173 | 28 |
Match score weights: distance 35% · size 25% · config 20% · recency 20%. Top-matched comps best support the ARV.
Projected returns pro-forma
-3.0% appreciation · 5.42% rent growth · sell at horizon
- IRR
- -20.8%
- Equity multiple
- 0.27×
- Total profit
- $-53,332
- Equity at exit
- $38,752
- IRR
- -10.2%
- Equity multiple
- 0.33×
- Total profit
- $-48,983
- Equity at exit
- $22,471
Cash invested: $72,772 (down + closing). Projections, not guarantees.
Landlord ↔ Tenant lean methodology
- Overall (STATE)
- 90 Strongly Landlord-Friendly
- State Alabama
- 90 Strongly Landlord-Friendly · R+15
- County
- — inherits STATE
- City
- — inherits STATE
ZIP-level market 35405
- Home prices YoY
- -26.9%
- Rents YoY
- 5.4%
- Active inventory
- 457
- Price-to-rent
- 13.3×
Monthly cashflow live
- Estimated rent
- $1,630 medium interval (Pro) →
- Mortgage (P&I)
- −$1,363
- Tax from tax record
- −$54 /mo · $650/yr
- Insurance
- −$108
- HOA
- −$0
- Vacancy / Maint / Mgmt
- −$342
- Net cashflow
- $-238
Break-even live
UW: 25.0% down · 7.5% · 30yr · 1.5% tax · 5.0% vac · 8.0% maint · 8.0% mgmt
Financing live
Cash to close
- Down payment
- $64,975
- Closing costs
- $7,797
- Reserves months
- —
- Total cash needed
- —
Loan-product check · same deal, 3 products live
Conventional
25% down · 7.5% · 30yr
- Down + closing
- —
- Monthly P&I
- —
- Monthly cashflow
- —
- DSCR
- —
- Eligible?
- —
Personal DTI + credit; lowest rate.
DSCR
20% down · 8.5% · 30yr
- Down + closing
- —
- Monthly P&I
- —
- Monthly cashflow
- —
- DSCR
- —
- Eligible?
- —
No personal income docs; deal must DSCR.
Hard money
10% down · 12.0% · 12mo
- Down + closing
- —
- Monthly P&I
- —
- Monthly cashflow
- —
- DSCR
- —
- Eligible?
- —
Short-term bridge; refi at stabilization.
Rent comps 3 comps
| Address | Beds | Baths | Sqft | Rent | $/sqft | DOM | Units | Dist |
|---|---|---|---|---|---|---|---|---|
| 14391 Buttercup Way , AL | 4.0 | 2.0 | 1444 | $1,665 | $1.15 | 11d | 1 | 0.87mi |
| 14320 Firefly LN Tuscaloosa, AL | 4.0 | 2.0 | 1417 | $1,595 | $1.13 | 11d | 1 | 0.96mi |
| 11605 McCord Ln Tuscaloosa, AL | 4.0 | 2.0 | 1497 | $1,575 | $1.05 | 21d | 1 | 1.14mi |
Listing history 3 events
-
2026-05-11status Active 577-char remark
-
2026-05-05status Pending 577-char remark
-
2026-05-01$259,900 Active 577-char remark
ⓘ Source: listings_history table (triggers on properties + properties_extension) + one-shot
backfill from property_details.listing_events for pre-trigger history.
Tax reassessment forecast AL · Resets to sale price
- Current annual tax
- $650 · $54/mo
- Projected year-2 tax
- $1,066 · $89/mo
- Expected delta
- +$415/yr (+$35/mo · 63.9%)
ⓘ Screening estimate from a state-policy table — verify with the county assessor before closing.
Climate risk First Street
- Flood 1/10 Low FEMA zone X (unshaded) · 0% chance over 30 yrs
- Wildfire 3/10 Moderate
- Heat 7/10 Severe 7 d/yr ≥108°F today · 21 d/yr by 30 yrs out
- Wind 6/10 Major 76% chance of damaging wind over 30 yrs
- Air quality 1/10 Low 0 unhealthy d/yr today · 0 by 30 yrs out
Nearby sold comps map
Loading sold comps map…
Walkable amenities ~0.75 mi
Loading nearby amenities…
Taxation est. · year 1
- Rental income
- $19,560
- − Mortgage interest
- −$14,558
- − Property taxes
- −$650
- − Insurance
- −$1,300
- − Repairs & maintenance
- −$1,565
- − Management
- −$1,565
- − Depreciation
- −$7,561
- Taxable loss
- −$7,638
- Est. tax savings @ 24.0%
- +$1,833
- After-tax cash flow
- $-1,019/yr
For passive investors: Depreciation is non-cash, so a rental often shows a tax loss while cash-flowing — sheltering income. Rental losses are passive: they offset passive income freely, and up to $25,000/yr can offset ordinary (W-2) income if you actively participate and your MAGI is under $100k (phasing out to $0 by $150k); unused losses carry forward. On sale, claimed depreciation is recaptured at up to 25%, and gains may owe capital-gains tax (a 1031 exchange can defer both). Figures are a year-1 estimate at your 24.0% rate — not tax advice; consult a CPA.
Schools (NCES district)
- District
- Tuscaloosa County
- NCES district ID
- 0103390
- Math proficiency
- 21% ▼ -24.00%
- Reading proficiency
- 45% ▲ 2.00%
- Median HH income
- $53,000
- Composite
- 28.88/100
- National rank
- #6641
- State rank
- #47 of 129 in AL
Livability — Tuscaloosa
- Score
- 77/100
- State rank
- #9
- US rank
- #2909
Category grades
Schools grade is shown separately in the Schools card above.
Census & demographics
- County
- Tuscaloosa County · 206,491 people
- City population
- 134,228
- Metro
- Tuscaloosa, AL
- Population (ZIP)
- 49,420
- Household income
- $62,301
- Rent vs Own
- Severe rent burden
- 1963.0
Population outlook (Tuscaloosa County) Hauer SSP2
- Today (2025)
- 228,293 people
- By 2030
- 240,551 · +5.4%
- By 2040
- 263,856 · +15.6%
- By 2050
- 286,491 · +25.5%
- By 2075
- 335,783 · +47.1%
- By 2100
- 370,520 · +62.3%
Race, ethnicity, and origin ACS 2023
- Neighborhood character
- Diverse neighborhood (Simpson 0.56)
- Race & ethnicity
- Black 56% White 35% Hispanic / Latino 5% Two or more races 3% Asian 2%
- Hispanic origin (detail)
- Mexican 2%
- Common ancestry
- Italian 1% Lithuanian 1% Slovak 1%
- Foreign-born
- 5% · Canada, China
- Languages at home
- 94% English-only · Spanish 4% Other Indo-European 1% Chinese 1%
Political lean MEDSL · Tuscaloosa
- 2024 margin
- Strong R (+20.4) · D 39.4% · R 59.8%
- 2008→2024 swing
- -4.4pp toward R · 2008: -16.0pp · 2024: -20.4pp
- All cycles
- 2024: R+20.4 2020: R+14.8 2016: R+19.5 2012: R+17.4 2008: R+16.0
Not yet ingested
- Civics
- —
Market trends
- HPI YoY
- ▼ -71.25%
- Current HPI
- 193.1929
- Rent YoY
- ▲ 5.42%
- Metro
- Tuscaloosa, AL
- State GDP YoY
- ▲ 2.94%
- F500 in state
- 4
Industry mix (Fortune 500 HQ in AL)
| Industry | F500 HQs | Revenue |
|---|---|---|
| Financial Services | 1 | $8B |
|
||
| Healthcare | 1 | $5B |
|
||
Price history
4 events — show timeline
- 2026-05-29 Pending — WAMLS
- 2026-05-11 Relisted — WAMLS
- 2026-05-05 Pending — WAMLS
- 2026-05-01 Listed $259,900 WAMLS
Property tax history
+4.3%/yrLatest (2025): $650 · +7.5% YoY. Source: county tax records.
Cash-flow waterfall
monthlySold comps — $/sqft
last 12 mo · ≤1 miLoading sold comps…