 16-Plex
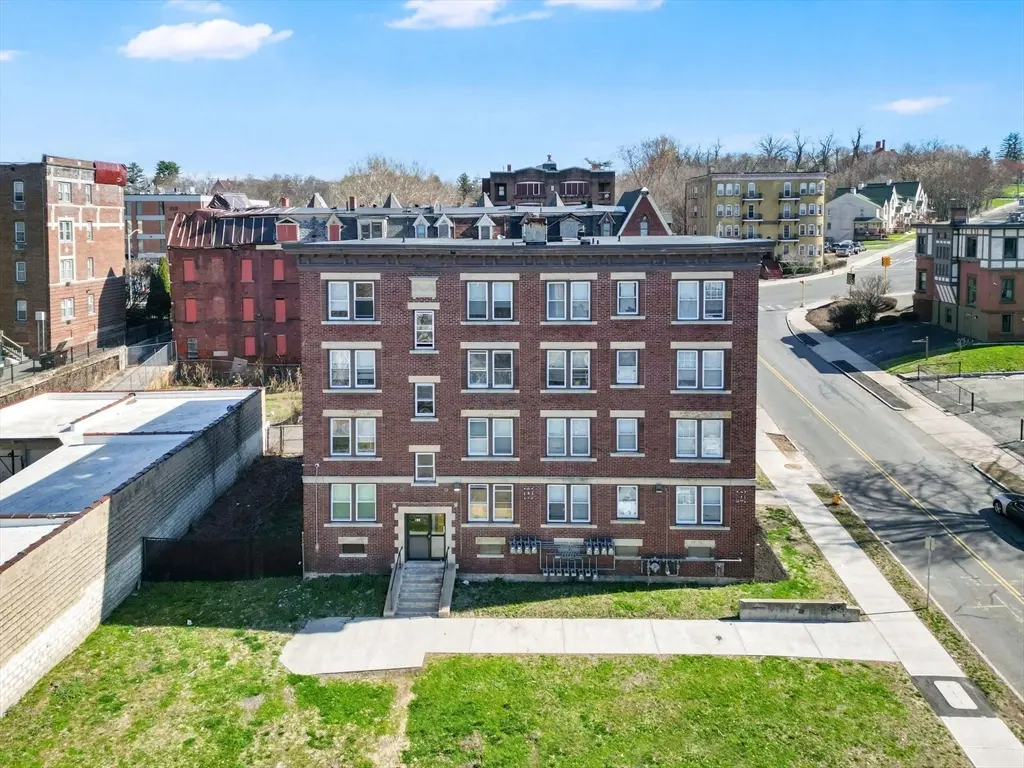
120-122 Central St · Springfield, MA
Flood risk 5/10 · Moderate
- FEMA flood zone
- X (unshaded)
- Chance of flooding over 30 yrs
- 0.24%
- Est. flood insurance / yr
- $473 – $860
Fire risk 2/10 · Minimal
- Est. fire insurance / yr
- $915 – $1,699
Heat risk 5/10 · Moderate
- Hot days now (above 98°F)
- 7 days/yr
- Hot days in 30 yrs
- 16 days/yr
Wind risk 5/10 · Moderate
- Chance of severe wind over 30 yrs
- 26.0%
Air-quality risk 2/10 · Minimal
- Unhealthy air days now
- 1 days/yr
- Unhealthy air days in 30 yrs
- 2 days/yr
Risk factors via First Street. Map © Google.
Why this score? — see what drove the C- grade
The composite is a weighted blend of 9 inputs, each scored 0–100. Each bar is that input's sub-score; the figure is the points it added to the 100-point composite (weight × sub-score).
- Cash flow +18.2/30.0
- ARV discount +7.5/15.0
- DSCR +5.7/10.0
- Appreciation +5.5/10.0
- 1% rule +4.9/10.0
- Condition / age +3.8/5.0
- Livability +3.7/5.0
- Rent growth +2.5/5.0
- Schools +1.6/10.0
$2,000,000
🖨 Deal sheet (PDF) 📄 Offer letter ✓ Due diligence
Multi-family units
County records classify this as Multi-Family (5+ Unit). Listing-text estimate: 16 units. confirmed
5+ unit building — per-unit beds/baths from public records are typically unavailable; the breakdown below (if shown) is an estimate from the listing text.
Listing remarks MLS
120–122 Central Street presents a rare opportunity to acquire a 16-unit asset in a prime Springfield location, just minutes from the Naismith Memorial Basketball Hall of Fame and MGM Springfield. Perfect for a 1031 exchange this property features a strong unit mix of (7) two-bedroom apartments and (9) one-bedroom apartments, catering to a wide tenant base.With gross rents exceeding $22,000 per month, this building offers immediate cash flow and solid investment performance. All 16 units have lead certificates, providing added compliance and peace of mind for ownership.Positioned in a high-demand rental area with close proximity to major attractions, employment centers, and amenities, with a large off street parking lot this is a turnkey opportunity for investors looking to scale their portfolio with a stabilized, income-producing asset.
Key facts
- Strong unit mix
- Turnkey opportunity
- 0.27 acre lot
Tags
Neighborhood map
What this means for you Summary
Snapshot
- This is a 7×2bd/1ba + 9×1bd/1ba units multifamily listed at $2.00M. Condition is rated good.
Deal economics
- At list price, monthly cash flow is $2k ($21k/yr) — positive. Per door: $111/mo.
- The deal already cash-flows at list — no discount required.
- To meet the 1% rule (rent ≥ 1% of price), the offer needs to be $1.97M (1.3% below list).
- Recommended offer: $1.88M (6.0% below list) — sets the bar for market timing.
- Cap rate 7.4% vs local median 5.0% in Springfield — top-decile yield for the area; either an underpriced asset or a hidden risk that comps aren't pricing in. Stress-test before assuming the spread holds.
Location & tenants
- Location reads 73/100 on livability (#97 in MA) — a middle-class / working-renter tenant base. Strengths: commute A+, health & safety A+, amenities A; Watch: crime F, employment D-.
- Springfield (urban): math 13% / reading 25% proficiency, ranked #296 of 302 in MA (top 98%) — low school quality limits family demand, transient renter base, plan for 1-2y turnover; 81% free/reduced lunch — lower-income household profile, screen leases tightly.
- Zoned schools: Milton Bradley School (math 7% / reading 22%, grade F, #873 of 938 statewide, top 94%, 515 students, 0% FRL); Stem Middle Academy (math 14% / reading 23%, grade F, #263 of 305 statewide, top 86%, 297 students, 0% FRL); Springfield Central High (math 27% / reading 41%, grade F, #250 of 343 statewide, top 73%, 2,095 students, 0% FRL) — zoned schools average 0% FRL vs 81% district-wide (81 pts lower); this property's tenant base skews higher-income than the district average.
- Market conditions: 21 active listings in the ZIP; 453 units permitted in Hampden County in 2024 (116 in 5+ unit buildings).
Forward outlook
- In year one you build about $35k of equity ($14k loan paydown + $22k appreciation (1.1% local appreciation)).
- Hampden County population projected at +5% by 2050 — modest demand growth; plan on rents tracking national, not racing it.
- At projected returns (1.1% appreciation + 3.0% rent growth), your $560k cash investment doubles in ~8 years — after that, you're playing with house money.
- By year 4, paydown + projected appreciation supports a ~$128k cash-out refi (75% LTV) — recoverable capital for the next deal without selling this one.
Negotiation context
- It's been on market 67 days — a 6% lower offer ($1.88M) is reasonable based on typical stale-listing flexibility.
Risks & watch-outs
- Watch-outs: built in 1927 — expect roof / HVAC / electrical / plumbing capex.
- Climate carrying-cost: moderate flood risk; moderate wind risk, 26% chance of damaging wind over 30y; extreme-heat days projected 7→16/yr by 2055 (HVAC capex compounding) — expect insurance premiums to compound above CPI over the hold.
Questions for the listing agent
- It's been on market 67 days. Have you received any prior offers? Is the seller open to a 6% concession, seller financing, or rate buy-down credit?
- Can we see the unit-by-unit rent roll, current vacancy, and any below-market leases? What's the average tenancy length?
- What capital expenditures (roof, boiler, parking lot, exteriors) have been made in the last 5 years, and what's planned in the next 2?
- Built in 1927 — when were the roof, HVAC, electrical panel, plumbing, and water heater last replaced?
- Why hasn't it sold? Are there any deal-killer items the seller is aware of (foundation, flood, title, zoning, code violations)?
- Is there a deadline driving the sale (1031 exchange, divorce, estate, relocation)? That informs how much negotiation room exists.
- Schools are D-rated, which usually means shorter tenancies and higher turnover. Who's the typical renter profile here, and what's been the actual vacancy rate?
- Crime grade is F in this area — have there been break-ins, vandalism, or insurance claims at this property in the last 3 years? What carrier currently insures it and at what premium?
- What's the average days-on-market for RENTAL listings here right now (not sales)? A rising rental-DOM trend means longer vacancies and softer asking-rent achievability than the comps imply.
- What's the recent tenant-quality profile in this submarket — average credit score on applications, eviction rate, late-payment / NSF rate, and stable-employment percentage? A property-management company in the area should have these aggregated.
- How much new apartment / multifamily construction is in the pipeline within 1–3 miles? Heavy new supply (>2% of stock underway) typically softens rents 12–24 months out; light construction supports rent growth.
Investment metrics
- 1% rule
- 0.99% ✗
- Cap rate
- 7.36%
- Cash-on-cash
- 3.81%
- DSCR
- 1.17
- GRM
- 8.4
CMA / ARV
- ARV (median comp)
- $1,140,647
- List price
- $2,000,000
- Delta
- 75.34%
- Verdict
- OVERPRICED
- Comps
- 7 within 1.0 mi
Projected returns pro-forma
1.08% appreciation · 3.0% rent growth · sell at horizon
- IRR
- 5.6%
- Equity multiple
- 1.28×
- Total profit
- $158,838
- Equity at exit
- $691,076
- IRR
- 9.8%
- Equity multiple
- 2.20×
- Total profit
- $670,675
- Equity at exit
- $924,837
Cash invested: $560,000 (down + closing). Projections, not guarantees.
Landlord ↔ Tenant lean methodology
- Overall (STATE)
- 20 Strongly Tenant-Friendly
- State Massachusetts
- 20 Strongly Tenant-Friendly · D+15
- County
- — inherits STATE
- City
- — inherits STATE
ZIP-level market 01105
- Home prices YoY
- 0.3%
- Active inventory
- 21
- Price-to-rent
- 122.6×
Monthly cashflow live
- Estimated rent
- $19,748 high interval (Pro) →
- Mortgage (P&I)
- −$10,488
- Tax est. 1.5%
- −$2,500 /mo · $30,000/yr
- Insurance
- −$833
- HOA
- −$0
- Vacancy / Maint / Mgmt
- −$4,147
- Net cashflow
- $1,779
Break-even live
Sensitivity live
| Price | -10% $3,162 | -5% $2,470 | +0% $1,779 | +5% $1,088 | +10% $397 |
|---|---|---|---|---|---|
| Rent | -10% $219 | -5% $999 | +0% $1,779 | +5% $2,559 | +10% $3,339 |
| Rate | -1.0pp $2,787 | -0.5pp $2,288 | base $1,779 | +0.5pp $1,261 | +1.0pp $734 |
16-unit breakdown (identical units grouped — click to expand)
| Units | Beds | Baths | Est. rent |
|---|---|---|---|
| 7× units | 2 | 1 | $9,520 |
| #1 | 2 | 1 | $1,360 |
| #2 | 2 | 1 | $1,360 |
| #3 | 2 | 1 | $1,360 |
| #4 | 2 | 1 | $1,360 |
| #5 | 2 | 1 | $1,360 |
| #6 | 2 | 1 | $1,360 |
| #7 | 2 | 1 | $1,360 |
| 9× units | 1 | 1 | $10,233 |
| #8 | 1 | 1 | $1,137 |
| #9 | 1 | 1 | $1,137 |
| #10 | 1 | 1 | $1,137 |
| #11 | 1 | 1 | $1,137 |
| #12 | 1 | 1 | $1,137 |
| #13 | 1 | 1 | $1,137 |
| #14 | 1 | 1 | $1,137 |
| #15 | 1 | 1 | $1,137 |
| #16 | 1 | 1 | $1,137 |
| Total (16 units) | $19,748 | ||
UW: 25.0% down · 7.5% · 30yr · 1.5% tax · 5.0% vac · 8.0% maint · 8.0% mgmt
Financing live
Cash to close
- Down payment
- $500,000
- Closing costs
- $60,000
- Reserves months
- —
- Total cash needed
- —
Loan-product check · same deal, 3 products live
Conventional
25% down · 7.5% · 30yr
- Down + closing
- —
- Monthly P&I
- —
- Monthly cashflow
- —
- DSCR
- —
- Eligible?
- —
Personal DTI + credit; lowest rate.
DSCR
20% down · 8.5% · 30yr
- Down + closing
- —
- Monthly P&I
- —
- Monthly cashflow
- —
- DSCR
- —
- Eligible?
- —
No personal income docs; deal must DSCR.
Hard money
10% down · 12.0% · 12mo
- Down + closing
- —
- Monthly P&I
- —
- Monthly cashflow
- —
- DSCR
- —
- Eligible?
- —
Short-term bridge; refi at stabilization.
Listing history 18 events
-
2026-06-22days on market $2,000,000 Active 67 DOM
-
2026-06-18days on market $2,000,000 Active 64 DOM
-
2026-06-17statusdays on market $2,000,000 Active 63 DOM
-
2026-06-16days on market $2,000,000 Price Changed 62 DOM
-
2026-06-15days on market $2,000,000 Price Changed 61 DOM
-
2026-06-14pricestatusdays on market $2,000,000 Price Changed 59 DOM
-
2026-06-13days on market $2,050,000 Active 58 DOM
-
2026-06-10days on market $2,050,000 Active 56 DOM
-
2026-06-09days on market $2,050,000 Active 55 DOM
-
2026-06-08days on market $2,050,000 Active 54 DOM
-
2026-06-07days on market $2,050,000 Active 53 DOM
-
2026-06-05days on market $2,050,000 Active 50 DOM
-
2026-06-03days on market $2,050,000 Active 49 DOM
-
2026-06-02days on market $2,050,000 Active 48 DOM
-
2026-06-01days on market $2,050,000 Active 47 DOM
-
2026-05-31days on market $2,050,000 Active 46 DOM
-
2026-05-30days on market $2,050,000 Active 45 DOM
-
2026-04-15$2,050,000 New 854-char remark
Show marketing remark (854 chars)
120–122 Central Street presents a rare opportunity to acquire a 16-unit asset in a prime Springfield location, just minutes from the Naismith Memorial Basketball Hall of Fame and MGM Springfield. Perfect for a 1031 exchange this property features a strong unit mix of (7) two-bedroom apartments and (9) one-bedroom apartments, catering to a wide tenant base.With gross rents exceeding $22,000 per month, this building offers immediate cash flow and solid investment performance. All 16 units have lead certificates, providing added compliance and peace of mind for ownership.Positioned in a high-demand rental area with close proximity to major attractions, employment centers, and amenities, with a large off street parking lot this is a turnkey opportunity for investors looking to scale their portfolio with a stabilized, income-producing asset.
ⓘ Source: listings_history table (triggers on properties + properties_extension) + one-shot
backfill from property_details.listing_events for pre-trigger history.
Climate risk First Street
- Flood 5/10 Major FEMA zone X (unshaded) · 24% chance over 30 yrs
- Wildfire 2/10 Low
- Heat 5/10 Major 7 d/yr ≥98°F today · 16 d/yr by 30 yrs out
- Wind 5/10 Major 26% chance of damaging wind over 30 yrs
- Air quality 2/10 Low 1 unhealthy d/yr today · 2 by 30 yrs out
Nearby sold comps map
Loading sold comps map…
Walkable amenities ~0.75 mi
Loading nearby amenities…
Taxation est. · year 1
- Rental income
- $236,976
- − Mortgage interest
- −$112,031
- − Property taxes
- −$30,000
- − Insurance
- −$10,000
- − Repairs & maintenance
- −$18,958
- − Management
- −$18,958
- − Depreciation
- −$58,182
- Taxable loss
- −$11,153
- Est. tax savings @ 24.0%
- +$2,677
- After-tax cash flow
- $24,029/yr
For passive investors: Depreciation is non-cash, so a rental often shows a tax loss while cash-flowing — sheltering income. Rental losses are passive: they offset passive income freely, and up to $25,000/yr can offset ordinary (W-2) income if you actively participate and your MAGI is under $100k (phasing out to $0 by $150k); unused losses carry forward. On sale, claimed depreciation is recaptured at up to 25%, and gains may owe capital-gains tax (a 1031 exchange can defer both). Figures are a year-1 estimate at your 24.0% rate — not tax advice; consult a CPA.
Condition & rehab AI · 13 photos
This 16-unit multi-family property in Springfield, MA is in good condition with modern amenities and a prime location. A fresh coat of paint on the exterior would significantly boost its curb appeal and resale value.
Value-add opportunities
- Both paint exterior — enhances curb appeal and resale value
- Both HVAC maintenance — improves comfort and energy efficiency
Renovation cost estimate screening
Value-add ROI direction
- Both paint exterior — enhances curb appeal and resale value ↑
- Both HVAC maintenance — improves comfort and energy efficiency ↑
ⓘ Cost ranges are severity-bucket heuristics (US national rule-of-thumb). Get contractor quotes + a written scope before underwriting a rehab budget.
Schools (NCES district)
- District
- Springfield
- NCES district ID
- 2511130
- Math proficiency
- 13% ▼ -12.00%
- Reading proficiency
- 25% ▼ -5.00%
- Median HH income
- $34,938
- Composite
- 15.6/100
- National rank
- #9293
- State rank
- #296 of 302 in MA
Livability — Springfield
- Score
- 73/100
- State rank
- #97
- US rank
- #5195
Category grades
Schools grade is shown separately in the Schools card above.
Census & demographics
- Census place
- Springfield, MA
- City population
- 61,006
- Population (ZIP)
- 11,469
Population outlook (Hampden County) Hauer SSP2
- Today (2025)
- 485,646 people
- By 2030
- 491,517 · +1.2%
- By 2040
- 500,539 · +3.1%
- By 2050
- 508,827 · +4.8%
- By 2075
- 539,167 · +11.0%
- By 2100
- 545,698 · +12.4%
Race, ethnicity, and origin ACS 2023
- Neighborhood character
- Predominantly Hispanic (74%)
- Race & ethnicity
- Hispanic / Latino 74% Two or more races 37% Black 14% White 10%
- Hispanic origin (detail)
- Puerto Rican 63% Dominican 5%
- Common ancestry
- Lithuanian 1% Romanian 1%
- Foreign-born
- 8% · Canada
- Languages at home
- 44% English-only · Spanish 53% Other Indo-European 2% French/Haitian/Cajun 1%
Political lean MEDSL · Hampden
- 2024 margin
- Lean D (+8.9) · D 53.4% · R 44.5% · Other 2.1%
- 2008→2024 swing
- -16.4pp toward R · 2008: 25.3pp · 2024: 8.9pp
- All cycles
- 2024: D+8.9 2020: D+17.7 2016: D+16.0 2012: D+25.4 2008: D+25.3
Not yet ingested
- Civics
- —
Market trends
- HPI YoY
- ▲ 1.08%
- Current HPI
- 322.6127
- Rent YoY
- —
- Metro
- —
- State GDP YoY
- ▲ 2.28%
- F500 in state
- 38
Industry mix (Fortune 500 HQ in MA)
| Industry | F500 HQs | Revenue |
|---|---|---|
| Technology | 3 | $17B |
|
||
| Insurance | 2 | $84B |
|
||
| Retail | 2 | $76B |
|
||
| Life Sciences | 1 | $43B |
|
||
| Energy Technology | 1 | $31B |
|
||
| Aerospace / Defense | 1 | $18B |
|
||
Price history
1 event — show timeline
- 2026-04-15 Listed $2,050,000 MLS PIN
Cash-flow waterfall
monthlySold comps — $/sqft
last 12 mo · ≤1 miLoading sold comps…