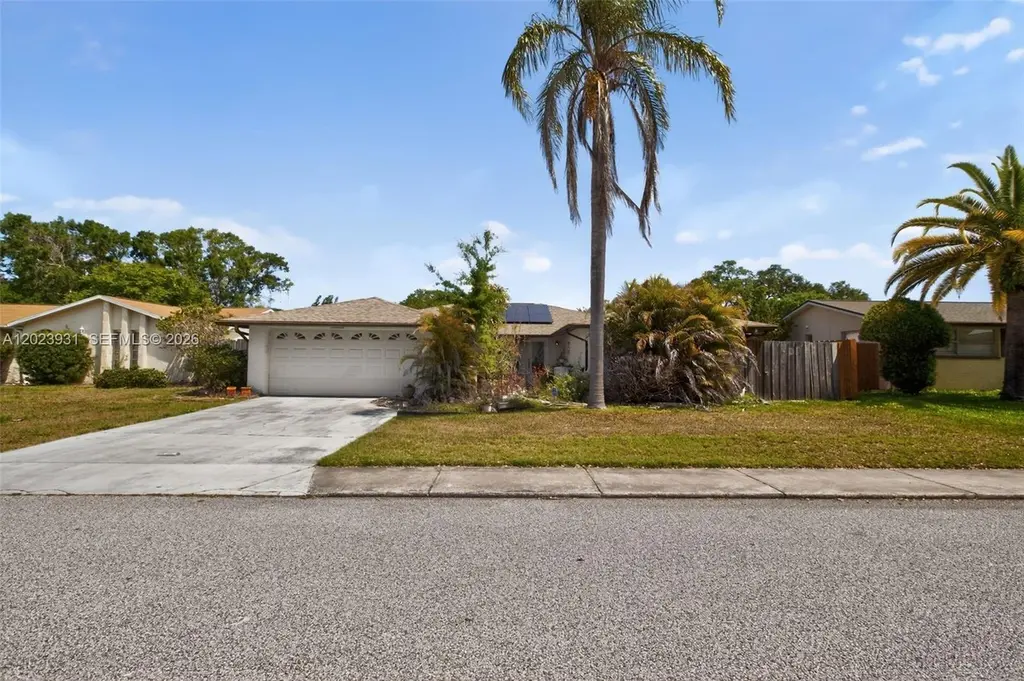
7215 Maplehurst Dr · Jasmine Estates, FL
Flood risk 6/10 · Moderate
- FEMA flood zone
- X (unshaded)
- Chance of flooding over 30 yrs
- 0.68%
- Est. flood insurance / yr
- $507 – $1,088
Fire risk 4/10 · Minor
- Est. fire insurance / yr
- $947 – $1,759
Heat risk 10/10 · Severe
- Hot days now (above 109°F)
- 7 days/yr
- Hot days in 30 yrs
- 27 days/yr
Wind risk 10/10 · Severe
- Chance of severe wind over 30 yrs
- 99.0%
Air-quality risk 2/10 · Minimal
- Unhealthy air days now
- 1 days/yr
- Unhealthy air days in 30 yrs
- 3 days/yr
Risk factors via First Street. Map © Google.
Why this score? — see what drove the D+ grade
The composite is a weighted blend of 9 inputs, each scored 0–100. Each bar is that input's sub-score; the figure is the points it added to the 100-point composite (weight × sub-score).
- ARV discount +15.0/15.0
- Cash flow +13.4/30.0
- Schools +4.3/10.0
- DSCR +4.0/10.0
- Livability +3.4/5.0
- Rent growth +2.8/5.0
- 1% rule +2.5/10.0
- Condition / age +2.5/5.0
- Appreciation +0.0/10.0
$259,900
🖨 Deal sheet 📄 Offer letter ✓ Due diligence
Listing remarks MLS
HUD Property sold "as-is", Information from sources deemed reliable but not guaranteed. Buyer to verify all information. Case no. 093-597921
Key facts
- Boating
- Close to schools
- Close to dining
Tags
Property features AI
Finance
- Financial info: Annual taxes listed
Exterior
- Parking: Attached garage; Driveway; 2 covered garage spaces (2-car garage)
- Utilities: Public water; Public sewer
- Home design: Single-story; Faces east; Resale property
- Construction: Block construction; Shingle roof
- Exterior features: Lakefront property; Waterfront; Less than a quarter acre lot
Interior
- Kitchen: Dishwasher; Electric range; Microwave; Refrigerator
- Bedrooms: Bedroom on main level
- Flooring: Vinyl
- Bathrooms: 2 full bathrooms
- Heating & cooling: Central heating; Central air conditioning
- Interior features: First-floor entry; Bedroom on main level; Vinyl flooring; Has a view
Neighborhood map
What this means for you Summary
Snapshot
- This is a 3-bed/2.0-bath single-family listed at $260k.
Deal economics
- At list price, monthly cash flow is $6 ($76/yr) — positive.
- The deal already cash-flows at list — no discount required.
- To meet the 1% rule (rent ≥ 1% of price), the offer needs to be $195k (25.1% below list).
- Recommended offer: $195k (25.1% below list) — sets the bar for 1% rule.
- Cap rate 6.3% vs local median 4.7% in Jasmine Estates — top-decile yield for the area; either an underpriced asset or a hidden risk that comps aren't pricing in. Stress-test before assuming the spread holds.
Location & tenants
- Location reads 67/100 on livability (#555 in FL) — a middle-class / working-renter tenant base. Strengths: cost of living A+, housing A+, health & safety A+; Watch: crime D+, schools F, amenities F.
- Pasco (suburban): math 50% / reading 52% proficiency, ranked #32 of 73 in FL (top 44%) — acceptable for families but not a draw, mixed tenant base, ~2y average lease.
- Market conditions: Rents rising (+1.3%/yr); 577 active listings in the ZIP; 37 comparable units currently listed for rent nearby; rentals at typical pace (median 20d on market — plan ~3-4 weeks tenant-placement turnaround); 6,765 units permitted in Pasco County in 2024 (1,250 in 5+ unit buildings).
- At $1,946/mo this rent would consume 49% of the median local household income ($47k/yr) (locally 2699% of renters already pay >50% of income on rent) — very limited rent-growth headroom before tenants either downsize or default.
Forward outlook
- Local home prices are declining (-3.0%/yr); year-one equity from $2k of loan paydown is wiped out by about $8k of value loss. Plan a longer hold.
- Pasco County population projected at +29% by 2050 — long-run rental-demand tailwind backs the buy-and-hold thesis.
Negotiation context
- It's been on market 27 days — a 2% lower offer ($256k) is reasonable based on typical stale-listing flexibility.
- 4 sale attempts since 21y ago; this cycle's ask has dropped $15k (5%) from the opening price — seller is motivated, your offer sets the floor, not the list.
- Current owner paid $115k; list at $260k implies a 126% gain — meaningful room to come down on a strong offer.
Risks & watch-outs
- Climate carrying-cost: major flood risk; severe wind risk, 99% chance of damaging wind over 30y; extreme-heat days projected 7→27/yr by 2055 (HVAC capex compounding) — expect insurance premiums to compound above CPI over the hold.
Questions for the listing agent
- Built in 1979 — when were the roof, HVAC, electrical panel, plumbing, and water heater last replaced?
- Is there a deadline driving the sale (1031 exchange, divorce, estate, relocation)? That informs how much negotiation room exists.
- Schools are F-rated, which usually means shorter tenancies and higher turnover. Who's the typical renter profile here, and what's been the actual vacancy rate?
- Crime grade is D in this area — have there been break-ins, vandalism, or insurance claims at this property in the last 3 years? What carrier currently insures it and at what premium?
- The area grade is low — what's the realistic commute time and amenity access for the typical tenant pool here? Any planned neighborhood developments (good or bad) we should know about?
- What's the average days-on-market for RENTAL listings here right now (not sales)? A rising rental-DOM trend means longer vacancies and softer asking-rent achievability than the comps imply.
- What's the recent tenant-quality profile in this submarket — average credit score on applications, eviction rate, late-payment / NSF rate, and stable-employment percentage? A property-management company in the area should have these aggregated.
- How much new for-sale + rental construction is in the pipeline within 1–3 miles? Heavy new supply typically softens prices + rents 12–24 months out; constrained supply supports both.
Investment metrics
- 1% rule
- 0.75% ✗
- Cap rate
- 6.32%
- Cash-on-cash
- 0.10%
- DSCR
- 1.00
- GRM
- 11.1
CMA / ARV
- ARV (on-the-fly)
- $314,500
- Comps found
- 12
Show comp detail 12 sales within ~0.75 mi
| Address | Dist | Beds/Ba | Sqft | Sold | Price | $/sf | Match |
|---|---|---|---|---|---|---|---|
| 7450 Lake Forest Cir | 0.29mi | 3/2.0 | 1,909 (+3%) | 2mo | $325,000 | $170 | 80 |
| 7415 Lake Forest Cir | 0.39mi | 3/2.0 | 1,914 (+4%) | 0mo | $330,000 | $172 | 76 |
| 7608 Laurel Oak Ct | 0.47mi | 3/2.0 | 1,862 (+1%) | 2mo | $388,000 | $208 | 76 |
| 9004 Lido Ln | 0.37mi | 3/2.0 | 1,737 (-6%) | 3mo | $259,000 | $149 | 70 |
| 7206 San Moritz Dr | 0.14mi | 3/2.5 | 1,578 (-15%) | 2mo | $250,000 | $158 | 66 |
| 9135 Farmington Ln | 0.29mi | 2/2.0 (-1) | 1,659 (-10%) | 1mo | $280,000 | $169 | 63 |
| 7715 Embassy Blvd | 0.59mi | 3/3.0 | 1,931 (+4%) | 1mo | $315,000 | $163 | 60 |
| 7233 Vienna Ln | 0.25mi | 4/3.0 (+1) | 2,054 (+11%) | 2mo | $320,000 | $156 | 59 |
| 7026 Whitethorn Ct | 0.61mi | 3/2.0 | 1,999 (+8%) | 1mo | $395,000 | $198 | 57 |
| 7025 Sonata Dr | 0.32mi | 2/2.0 (-1) | 1,600 (-14%) | 1mo | $270,000 | $169 | 57 |
| 8828 Carmen Ln | 0.49mi | 3/2.5 | 1,640 (-11%) | 2mo | $350,000 | $213 | 54 |
| 7906 Bahama Ave | 0.72mi | 4/2.0 (+1) | 2,123 (+15%) | 2mo | $440,000 | $207 | 35 |
Match score weights: distance 35% · size 25% · config 20% · recency 20%. Top-matched comps best support the ARV.
Projected returns pro-forma
-3.0% appreciation · 1.28% rent growth · sell at horizon
- IRR
- -17.9%
- Equity multiple
- 0.38×
- Total profit
- $-45,156
- Equity at exit
- $38,752
- IRR
- -13.2%
- Equity multiple
- 0.28×
- Total profit
- $-52,470
- Equity at exit
- $22,471
Cash invested: $72,772 (down + closing). Projections, not guarantees.
Landlord ↔ Tenant lean methodology
- Overall (STATE)
- 87 Strongly Landlord-Friendly
- State Florida
- 87 Strongly Landlord-Friendly · R+3
- County
- — inherits STATE
- City
- — inherits STATE
ZIP-level market 34668
- Home prices YoY
- -17.4%
- Rents YoY
- 1.3%
- Active inventory
- 577
- Price-to-rent
- 11.1×
Monthly cashflow live
- Estimated rent
- $1,946 high interval (Pro) →
- Mortgage (P&I)
- −$1,363
- Tax from tax record
- −$60 /mo · $721/yr
- Insurance
- −$108
- HOA
- −$0
- Vacancy / Maint / Mgmt
- −$409
- Net cashflow
- $6
Break-even live
UW: 25.0% down · 7.5% · 30yr · 1.5% tax · 5.0% vac · 8.0% maint · 8.0% mgmt
Financing live
Cash to close
- Down payment
- $64,975
- Closing costs
- $7,797
- Reserves months
- —
- Total cash needed
- —
Loan-product check · same deal, 3 products live
Conventional
25% down · 7.5% · 30yr
- Down + closing
- —
- Monthly P&I
- —
- Monthly cashflow
- —
- DSCR
- —
- Eligible?
- —
Personal DTI + credit; lowest rate.
DSCR
20% down · 8.5% · 30yr
- Down + closing
- —
- Monthly P&I
- —
- Monthly cashflow
- —
- DSCR
- —
- Eligible?
- —
No personal income docs; deal must DSCR.
Hard money
10% down · 12.0% · 12mo
- Down + closing
- —
- Monthly P&I
- —
- Monthly cashflow
- —
- DSCR
- —
- Eligible?
- —
Short-term bridge; refi at stabilization.
Rent comps 37 comps
| Address | Beds | Baths | Sqft | Rent | $/sqft | DOM | Units | Dist |
|---|---|---|---|---|---|---|---|---|
| 7125 Sandalwood Dr Port Richey, FL | 2.0 | 2.0 | 1324 | $1,681 | $1.27 | 4d | 1 | 0.25mi |
| 7318 Vienna Ln Port Richey, FL | 2.0 | 2.0 | 1530 | $1,841 | $1.20 | 20d | 1 | 0.26mi |
| 9136 Lometa Ln Port Richey, FL | 3.0 | 2.0 | 1574 | $1,795 | $1.14 | 17d | 1 | 0.27mi |
| 7501 San Moritz Dr Port Richey, FL | 3.0 | 2.0 | 1412 | $1,600 | $1.13 | 24d | 1 | 0.29mi |
| 7034 Coral Reef Dr Port Richey, FL | 3.0 | 2.0 | 1325 | $1,795 | $1.35 | 24d | 1 | 0.39mi |
| 9141 Suffolk Ln Port Richey, FL | 3.0 | 2.0 | 1512 | $1,785 | $1.18 | 24d | 1 | 0.39mi |
| 7605 Embassy Blvd Unit 1 Port Richey, FL | 3.0 | 2.0 | 1469 | $2,350 | $1.60 | 24d | 1 | 0.46mi |
| 7605 Embassy Blvd Port Richey, FL | 3.0 | 2.0 | 1278 | $2,350 | $1.84 | 12d | 1 | 0.46mi |
| 8910 Elm Leaf Ct Port Richey, FL | 2.0 | 2.0 | 1248 | $1,650 | $1.32 | 4d | 1 | 0.49mi |
| 9105 Hermitage Ln Port Richey, FL | 3.0 | 2.0 | 1442 | $1,900 | $1.32 | 24d | 1 | 0.50mi |
| 9304 Saint Regis Ln Port Richey, FL | 2.0 | 2.0 | 1356 | $1,550 | $1.14 | 21d | 1 | 0.50mi |
| 9100 Hunt Club Ln Port Richey, FL | 2.0 | 2.0 | 1365 | $1,850 | $1.36 | 21d | 1 | 0.56mi |
| 7205 Moravian Dr Port Richey, FL | 3.0 | 2.0 | 1518 | $1,845 | $1.22 | 20d | 1 | 0.57mi |
| 7301 Moravian Dr Port Richey, FL | 3.0 | 2.0 | 1325 | $1,806 | $1.36 | 4d | 1 | 0.57mi |
| 8839 Greenleaf Ct Port Richey, FL | 3.0 | 2.0 | 1878 | $2,000 | $1.06 | 10d | 1 | 0.61mi |
| 9425 Saint Regis Ln Port Richey, FL | 2.0 | 2.0 | 1380 | $1,700 | $1.23 | 24d | 1 | 0.64mi |
| 8729 Sabal Way Port Richey, FL | 3.0 | 2.0 | 1807 | $2,015 | $1.12 | 4d | 1 | 0.65mi |
| 7210 Parrot Dr Port Richey, FL | 4.0 | 2.0 | 1772 | $2,800 | $1.58 | 4d | 1 | 0.83mi |
| 8102 Chickasaw Ln Port Richey, FL | 3.0 | 2.0 | 1688 | $1,969 | $1.17 | 4d | 1 | 0.90mi |
| 6920 Tierra Verde St Port Richey, FL | 3.0 | 2.0 | 1478 | $1,850 | $1.25 | 24d | 1 | 0.90mi |
| 6947 Bottle Brush Dr Port Richey, FL | 3.0 | 2.0 | 2121 | $2,000 | $0.94 | 24d | 1 | 0.93mi |
| 9845 Lake Chrise Ln Port Richey, FL | 3.0 | 2.0 | 1622 | $1,961 | $1.21 | 24d | 1 | 0.97mi |
| 7815 Treasure Pointe Dr Port Richey, FL | 3.0 | 2.0 | 1682 | $2,024 | $1.20 | 20d | 1 | 0.98mi |
| 8030 Gabriel Dr Port Richey, FL | 3.0 | 2.0 | 1501 | $2,025 | $1.35 | 4d | 1 | 0.99mi |
| 6831 Tierra Linda St Port Richey, FL | 3.0 | 2.0 | 1478 | $1,595 | $1.08 | 24d | 1 | 1.07mi |
| 10015 Cherry Creek Ln Port Richey, FL | 3.0 | 2.0 | 1592 | $1,600 | $1.01 | 24d | 1 | 1.11mi |
| 9820 Rainbow Ln Port Richey, FL | 2.0 | 1.0 | 1300 | $1,325 | $1.02 | 14d | 1 | 1.14mi |
| 9741 Scenic Dr Port Richey, FL | 3.0 | 2.0 | 1246 | $1,800 | $1.44 | 4d | 1 | 1.15mi |
| 7829 Glencoe Dr New Port Richey, FL | 3.0 | 2.0 | 1658 | $2,295 | $1.38 | 20d | 1 | 1.19mi |
| 10110 Cherry Creek Ln Port Richey, FL | 3.0 | 1.0 | 1260 | $1,600 | $1.27 | 4d | 1 | 1.20mi |
| 9981 Eagles Point Cir #4 Port Richey, FL | 2.0 | 2.0 | 1320 | $1,850 | $1.40 | 24d | 1 | 1.31mi |
| 7514 Spirea Dr Port Richey, FL | 2.0 | 3.0 | 1696 | $1,750 | $1.03 | 14d | 1 | 1.32mi |
| 7514 Spirea Dr Port Richey, FL | 2.0 | 3.0 | 1696 | $1,750 | $1.03 | 24d | 1 | 1.32mi |
| 7212 Carlton Arms Dr New Port Richey, FL | 2.0 | 1.0–2.0 | 877 | $1,609 | $1.83 | 24d | 1 | 1.34mi |
| 7911 Foxwood Dr New Port Richey, FL | 3.0 | 2.0 | 1529 | $1,749 | $1.14 | 12d | 1 | 1.38mi |
| 7810 Cayuga Dr New Port Richey, FL | 2.0 | 2.0 | 1838 | $1,973 | $1.07 | 4d | 1 | 1.39mi |
| 9910 Island Harbor Dr Unit A Port Richey, FL | 2.0 | 2.0 | 1498 | $2,500 | $1.67 | 24d | 1 | 1.48mi |
Listing history 22 events
-
2026-06-18days on market $259,900 Active 27 DOM
-
2026-06-17days on market $259,900 Active 26 DOM
-
2026-06-16days on market $259,900 Active 25 DOM
-
2026-06-15days on market $259,900 Active 24 DOM
-
2026-06-13days on market $259,900 Active 22 DOM
-
2026-06-09days on market $259,900 Active 18 DOM
-
2026-06-08days on market $259,900 Active 17 DOM
-
2026-06-07days on market $259,900 Active 16 DOM
-
2026-06-04pricedays on market $259,900 Active 13 DOM
-
2026-06-03days on market $275,000 Active 12 DOM
-
2026-06-02days on market $275,000 Active 11 DOM
-
2026-06-01days on market $275,000 Active 10 DOM
-
2026-05-31days on market $275,000 Active 9 DOM
-
2026-05-22$275,000 Active
-
2008-10-11soldstatus $115,000 150-char remark
Show marketing remark (150 chars)
HUD Property sold "as-is", Information from sources deemed reliable but not guaranteed. Buyer to verify all information. Case no. 093-597921
-
2008-09-12$123,500 150-char remark
Show marketing remark (150 chars)
HUD Property sold "as-is", Information from sources deemed reliable but not guaranteed. Buyer to verify all information. Case no. 093-597921
-
2008-05-24historical
-
2007-11-21$119,900
-
2005-12-30soldstatus $185,000
-
2005-12-21soldstatus $185,000
-
2005-10-29$189,900
-
2002-06-07soldstatus $83,300
ⓘ Source: listings_history table (triggers on properties + properties_extension) + one-shot
backfill from property_details.listing_events for pre-trigger history.
Tax reassessment forecast FL · Resets to sale price
- Current annual tax
- $721 · $60/mo
- Projected year-2 tax
- $2,157 · $180/mo
- Expected delta
- +$1,436/yr (+$120/mo · 199.1%)
ⓘ Screening estimate from a state-policy table — verify with the county assessor before closing.
Climate risk First Street
- Flood 6/10 Major FEMA zone X (unshaded) · 68% chance over 30 yrs
- Wildfire 4/10 Moderate
- Heat 10/10 Extreme 7 d/yr ≥109°F today · 27 d/yr by 30 yrs out
- Wind 10/10 Extreme 99% chance of damaging wind over 30 yrs
- Air quality 2/10 Low 1 unhealthy d/yr today · 3 by 30 yrs out
Nearby sold comps map
Loading sold comps map…
Walkable amenities ~0.75 mi
Loading nearby amenities…
Taxation est. · year 1
- Rental income
- $23,357
- − Mortgage interest
- −$14,558
- − Property taxes
- −$721
- − Insurance
- −$1,300
- − Repairs & maintenance
- −$1,869
- − Management
- −$1,869
- − Depreciation
- −$7,561
- Taxable loss
- −$4,520
- Est. tax savings @ 24.0%
- +$1,085
- After-tax cash flow
- $1,161/yr
For passive investors: Depreciation is non-cash, so a rental often shows a tax loss while cash-flowing — sheltering income. Rental losses are passive: they offset passive income freely, and up to $25,000/yr can offset ordinary (W-2) income if you actively participate and your MAGI is under $100k (phasing out to $0 by $150k); unused losses carry forward. On sale, claimed depreciation is recaptured at up to 25%, and gains may owe capital-gains tax (a 1031 exchange can defer both). Figures are a year-1 estimate at your 24.0% rate — not tax advice; consult a CPA.
Schools (NCES district)
- District
- Pasco
- NCES district ID
- 1201530
- Math proficiency
- 50% ▼ -10.00%
- Reading proficiency
- 52% ▼ -5.00%
- Median HH income
- $45,039
- Composite
- 43.14/100
- National rank
- #3074
- State rank
- #32 of 73 in FL
Livability — Jasmine Estates
- Score
- 67/100
- State rank
- #555
- US rank
- #10561
Category grades
Schools grade is shown separately in the Schools card above.
Census & demographics
- Census place
- Jasmine Estates, FL
- County
- Pasco County · 524,098 people
- Metro
- Tampa-St. Petersburg-Clearwater, FL
- Population (ZIP)
- 49,442
- Household income
- $47,401
- Rent vs Own
- Severe rent burden
- 2699.0
Population outlook (Pasco County) Hauer SSP2
- Today (2025)
- 570,045 people
- By 2030
- 605,844 · +6.3%
- By 2040
- 674,806 · +18.4%
- By 2050
- 736,022 · +29.1%
- By 2075
- 862,900 · +51.4%
- By 2100
- 906,364 · +59.0%
Race, ethnicity, and origin ACS 2023
- Neighborhood character
- Predominantly White (70%)
- Race & ethnicity
- White 70% Hispanic / Latino 23% Two or more races 14% Black 4%
- Hispanic origin (detail)
- Mexican 3% Puerto Rican 10% Cuban 5% Dominican 1%
- Common ancestry
- Romanian 3% Lithuanian 3% Slovak 2%
- Foreign-born
- 11% · Canada, Jamaica
- Languages at home
- 82% English-only · Spanish 14% Other Indo-European 1% French/Haitian/Cajun 1%
Political lean MEDSL · Pasco
- 2024 margin
- Strong R (+25.2) · D 36.9% · R 62.1% · Other 1.0%
- 2008→2024 swing
- -21.6pp toward R · 2008: -3.6pp · 2024: -25.2pp
- All cycles
- 2024: R+25.2 2020: R+20.1 2016: R+21.6 2012: R+6.7 2008: R+3.6
Not yet ingested
- Civics
- —
Market trends
- HPI YoY
- ▼ -75.64%
- Current HPI
- 359.7163
- Rent YoY
- ▲ 1.28%
- Metro
- Tampa-St. Petersburg-Clearwater, FL
- State GDP YoY
- ▲ 3.28%
- F500 in state
- 36
Industry mix (Fortune 500 HQ in FL)
| Industry | F500 HQs | Revenue |
|---|---|---|
| Industrial Technology | 2 | $29B |
|
||
| Insurance | 2 | $17B |
|
||
| Retail | 1 | $60B |
|
||
| Technology Distribution | 1 | $58B |
|
||
| Homebuilding | 1 | $35B |
|
||
| Technology Manufacturing | 1 | $35B |
|
||
Price history
+230.1% since first listed9 events — show timeline
- 2026-05-22 Listed $275,000 MARMLS
- 2008-10-11 Sold (MLS) $115,000 Stellar MLS as Distributed by MLS Grid
- 2008-09-12 Listed $123,500 Stellar MLS as Distributed by MLS Grid
- 2008-05-24 Listing Removed — Stellar MLS as Distributed by MLS Grid
- 2007-11-21 Listed $119,900 Stellar MLS as Distributed by MLS Grid
- 2005-12-30 Sold (Public Records) $185,000 Public Records
- 2005-12-21 Sold (MLS) $185,000 Stellar MLS as Distributed by MLS Grid
- 2005-10-29 Listed $189,900 Stellar MLS as Distributed by MLS Grid
- 2002-06-07 Sold (Public Records) $83,300 Public Records
Property tax history
+0.3%/yrLatest (2025): $721 · +2.3% YoY. Source: county tax records.
Cash-flow waterfall
monthlySold comps — $/sqft
last 12 mo · ≤1 miLoading sold comps…