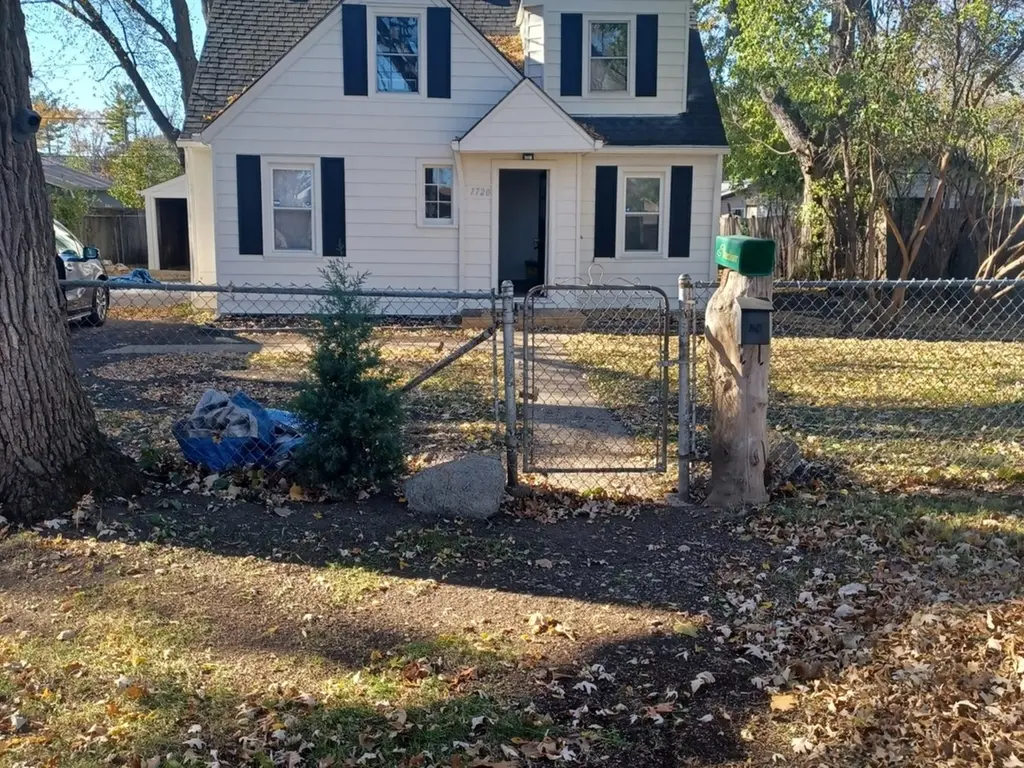
1720 Hiawatha Trl · Round Lake Heights, IL
Flood risk 1/10 · Minimal
- FEMA flood zone
- X (unshaded)
- Chance of flooding over 30 yrs
- 0.0%
- Est. flood insurance / yr
- $507 – $1,088
Fire risk 2/10 · Minimal
- Est. fire insurance / yr
- $804 – $1,492
Heat risk 2/10 · Minimal
- Hot days now (above 101°F)
- 7 days/yr
- Hot days in 30 yrs
- 14 days/yr
Wind risk 2/10 · Minimal
- Chance of severe wind over 30 yrs
- —
Air-quality risk 3/10 · Minor
- Unhealthy air days now
- 2 days/yr
- Unhealthy air days in 30 yrs
- 3 days/yr
Risk factors via First Street. Map © Google.
Why this score? — see what drove the D- grade
The composite is a weighted blend of 9 inputs, each scored 0–100. Each bar is that input's sub-score; the figure is the points it added to the 100-point composite (weight × sub-score).
- Cash flow +15.7/30.0
- DSCR +4.8/10.0
- 1% rule +4.6/10.0
- Livability +3.4/5.0
- Rent growth +3.2/5.0
- Condition / age +2.5/5.0
- ARV discount +1.8/15.0
- Schools +1.0/10.0
- Appreciation +0.0/10.0
$239,000
🖨 Deal sheet (PDF) 📄 Offer letter ✓ Due diligence
Listing remarks
SOME REMOLDLING DONE ON THIS 4 BED ROOM 2 BATH 2 STORY HOME. DETACHED ONE CAR GARAGE WITH NEW overhead DOOR, NEW KITCHEN AND BATH ROOM. NEW FLOORIING THRU-OUT HOUSE. CENTRAL AIR ON A FENCE YARD
Key facts
- 8,235 sq ft lot
- Garage
- Built 1943
Property features AI
Finance
- Other: Possession at closing; Property not currently leased; Some rehab work performed in 2025
- HOA & community: No master association fee required
Exterior
- Parking: Detached garage (owned) with asphalt driveway — total of 1 garage space and 1 parking space
- Utilities: Water from Lake Michigan / public; Public sewer; Electric service available
- Home design: Detached single-family home; Two stories; Fee simple ownership; Rehab completed in 2025; Built before 1978
- Construction: Vinyl siding; Asphalt roof; Other foundation details; Estimated age: 81–90 years
- Exterior features: Lot dimensions approximately 61 x 135; Lot under 0.25 acre
Interior
- Kitchen: Kitchen with wood laminate flooring; Refrigerator included
- Bedrooms: Four bedrooms (master and three additional bedrooms on the second floor)
- Flooring: Wood laminate flooring in kitchen, living room and master bedroom; Carpet in remaining bedrooms
- Bathrooms: Two full bathrooms
- Heating & cooling: Natural gas forced-air heating; Central air conditioning
- Interior features: Six total rooms
- Laundry & utility: Dedicated laundry room
Neighborhood map
What this means for you Summary
Snapshot
- This is a 3-bed/1.0-bath single-family listed at $239k.
Deal economics
- At list price, monthly cash flow is $103 ($1k/yr) — positive.
- The deal already cash-flows at list — no discount required.
- To meet the 1% rule (rent ≥ 1% of price), the offer needs to be $230k (3.6% below list).
- Recommended offer: $225k (6.0% below list) — sets the bar for market timing.
Location & tenants
- Location reads 67/100 on livability (#505 in IL) — a middle-class / working-renter tenant base. Strengths: crime A+, cost of living A+, housing A+; Watch: amenities F, commute F, health & safety F.
- Round Lake CUSD 116 (suburban): math 7% / reading 14% proficiency, ranked #560 of 620 in IL (top 90%) — low school quality limits family demand, transient renter base, plan for 1-2y turnover; 67% free/reduced lunch — lower-income household profile, screen leases tightly.
- Zoned schools: Indian Hill Elem School (math 8% / reading 22%, grade F, #1,259 of 2,056 statewide, top 62%, 445 students, 0% FRL); Round Lake Middle School (math 5% / reading 11%, grade F, #608 of 665 statewide, top 92%, 804 students, 0% FRL); Round Lake Senior High School (math 9% / reading 13%, grade F, #522 of 693 statewide, top 76%, 2,258 students, 0% FRL) — zoned schools average 0% FRL vs 67% district-wide (67 pts lower); this property's tenant base skews higher-income than the district average.
- Market conditions: Rents rising (+2.9%/yr); 97 active listings in the ZIP; 9 comparable units currently listed for rent nearby; rentals leasing fast (median 1d on market — plan ~1-2 weeks tenant-placement turnaround); solid renter incomes; 948 units permitted in Lake County in 2024 (424 in 5+ unit buildings).
Forward outlook
- Local home prices are declining (-3.0%/yr); year-one equity from $2k of loan paydown is wiped out by about $7k of value loss. Plan a longer hold.
- Lake County population projected to shrink 8% by 2050 — rents likely to lag national; underwrite the cash flow, not the appreciation.
Negotiation context
- It's been on market 77 days — a 6% lower offer ($225k) is reasonable based on typical stale-listing flexibility.
Risks & watch-outs
- Watch-outs: built in 1943 — expect roof / HVAC / electrical / plumbing capex.
Questions for the listing agent
- It's been on market 77 days. Have you received any prior offers? Is the seller open to a 6% concession, seller financing, or rate buy-down credit?
- Built in 1943 — when were the roof, HVAC, electrical panel, plumbing, and water heater last replaced?
- Why hasn't it sold? Are there any deal-killer items the seller is aware of (foundation, flood, title, zoning, code violations)?
- Is there a deadline driving the sale (1031 exchange, divorce, estate, relocation)? That informs how much negotiation room exists.
- Schools are F-rated, which usually means shorter tenancies and higher turnover. Who's the typical renter profile here, and what's been the actual vacancy rate?
- The area grade is low — what's the realistic commute time and amenity access for the typical tenant pool here? Any planned neighborhood developments (good or bad) we should know about?
- What's the average days-on-market for RENTAL listings here right now (not sales)? A rising rental-DOM trend means longer vacancies and softer asking-rent achievability than the comps imply.
- What's the recent tenant-quality profile in this submarket — average credit score on applications, eviction rate, late-payment / NSF rate, and stable-employment percentage? A property-management company in the area should have these aggregated.
- How much new for-sale + rental construction is in the pipeline within 1–3 miles? Heavy new supply typically softens prices + rents 12–24 months out; constrained supply supports both.
Investment metrics
- 1% rule
- 0.96% ✗
- Cap rate
- 6.81%
- Cash-on-cash
- 1.85%
- DSCR
- 1.08
- GRM
- 8.6
CMA / ARV
- ARV (on-the-fly)
- $212,055
- Comps found
- 12
Show comp detail 12 sales within ~0.75 mi
| Address | Dist | Beds/Ba | Sqft | Sold | Price | $/sf | Match |
|---|---|---|---|---|---|---|---|
| 1620 Lotus Dr | 0.19mi | 3/1.0 | 975 (-3%) | 6mo | $180,000 | $185 | 82 |
| 35330 N Nielsen Dr | 0.54mi | 3/1.0 | 1,000 (-0%) | 1mo | $212,000 | $212 | 73 |
| 608 Mohawk Dr | 0.47mi | 2/1.0 (-1) | 995 (-1%) | 5mo | $170,000 | $171 | 67 |
| 24471 W Poplar St | 0.47mi | 3/1.0 | 960 (-4%) | 6mo | $192,500 | $201 | 66 |
| 1317 Walnut Dr | 0.59mi | 3/1.0 | 975 (-3%) | 2mo | $253,000 | $259 | 65 |
| 712 N Cedarwood Cir | 0.35mi | 4/1.0 (+1) | 1,072 (+7%) | 4mo | $145,000 | $135 | 64 |
| 35339 N Hickory Ln | 0.56mi | 2/1.0 (-1) | 960 (-4%) | 1mo | $187,000 | $195 | 61 |
| 821 Oakwood Dr | 0.60mi | 3/1.0 | 1,056 (+5%) | 5mo | $245,000 | $232 | 59 |
| 1607 N Channel Dr | 0.63mi | 3/1.5 | 1,098 (+9%) | 3mo | $255,000 | $232 | 51 |
| 24676 W Clinton Ave | 0.60mi | 3/2.0 | 1,092 (+9%) | 6mo | $230,000 | $211 | 49 |
| 918 Ronald Ter | 0.69mi | 4/1.5 (+1) | 1,068 (+6%) | 6mo | $225,000 | $211 | 46 |
| 1408 Barberry Ln | 0.56mi | 4/1.5 (+1) | 1,120 (+11%) | 4mo | $190,000 | $170 | 45 |
Match score weights: distance 35% · size 25% · config 20% · recency 20%. Top-matched comps best support the ARV.
Projected returns pro-forma
-3.0% appreciation · 2.87% rent growth · sell at horizon
- IRR
- -13.5%
- Equity multiple
- 0.52×
- Total profit
- $-32,380
- Equity at exit
- $35,636
- IRR
- -4.7%
- Equity multiple
- 0.69×
- Total profit
- $-20,658
- Equity at exit
- $20,664
Cash invested: $66,920 (down + closing). Projections, not guarantees.
Landlord ↔ Tenant lean methodology
- Overall (STATE)
- 43 Moderately Tenant-Leaning
- State Illinois
- 43 Moderately Tenant-Leaning · D+7
- County
- — inherits STATE
- City
- — inherits STATE
ZIP-level market 60073
- Rents YoY
- 2.9%
- Active inventory
- 97
- Price-to-rent
- 8.6×
Monthly cashflow live
- Estimated rent
- $2,305 high interval (Pro) →
- Mortgage (P&I)
- −$1,253
- Tax from tax record
- −$365 /mo · $4,376/yr
- Insurance
- −$100
- HOA
- −$0
- Vacancy / Maint / Mgmt
- −$484
- Net cashflow
- $103
Break-even live
Sensitivity live
| Price | -10% $239 | -5% $171 | +0% $103 | +5% $36 | +10% $-32 |
|---|---|---|---|---|---|
| Rent | -10% $-79 | -5% $12 | +0% $103 | +5% $194 | +10% $285 |
| Rate | -1.0pp $224 | -0.5pp $164 | base $103 | +0.5pp $41 | +1.0pp $-22 |
UW: 25.0% down · 7.5% · 30yr · 1.5% tax · 5.0% vac · 8.0% maint · 8.0% mgmt
Financing live
Cash to close
- Down payment
- $59,750
- Closing costs
- $7,170
- Reserves months
- —
- Total cash needed
- —
Loan-product check · same deal, 3 products live
Conventional
25% down · 7.5% · 30yr
- Down + closing
- —
- Monthly P&I
- —
- Monthly cashflow
- —
- DSCR
- —
- Eligible?
- —
Personal DTI + credit; lowest rate.
DSCR
20% down · 8.5% · 30yr
- Down + closing
- —
- Monthly P&I
- —
- Monthly cashflow
- —
- DSCR
- —
- Eligible?
- —
No personal income docs; deal must DSCR.
Hard money
10% down · 12.0% · 12mo
- Down + closing
- —
- Monthly P&I
- —
- Monthly cashflow
- —
- DSCR
- —
- Eligible?
- —
Short-term bridge; refi at stabilization.
Rent comps 9 comps
| Address | Beds | Baths | Sqft | Rent | $/sqft | DOM | Units | Dist |
|---|---|---|---|---|---|---|---|---|
| 708 S Cedarwood Cir Round Lake Heights, IL | 3.0 | 1.0 | 931 | $2,000 | $2.15 | 0d | 1 | 0.24mi |
| 544 Meadow Green Ln Round Lake Beach, IL | 3.0 | 1.5 | 1160 | $2,100 | $1.81 | 0d | 1 | 0.38mi |
| 460 Meadow Hill Ln Round Lake Beach, IL | 3.0 | 1.5 | 1276 | $2,300 | $1.80 | 0d | 1 | 0.48mi |
| 422 Meadow Green Ln Round Lake Beach, IL | 2.0 | 1.5 | 960 | $1,800 | $1.88 | 45d | 1 | 0.49mi |
| 389 Meadow Green Ln Unit 1 Round Lake Beach, IL | 2.0 | 1.5 | 960 | $1,800 | $1.88 | 0d | 1 | 0.52mi |
| 1288 N Red Oak Cir #3 Round Lake Beach, IL | 2.0 | 2.0 | 1008 | $1,850 | $1.84 | 45d | 1 | 0.84mi |
| 1431 W Split Oak Cir Round Lake Beach, IL | 2.0 | 1.5 | 1080 | $2,150 | $1.99 | 46d | 1 | 0.94mi |
| 1217 N Village Dr Round Lake Beach, IL | 2.0 | 1.5 | 1330 | $2,300 | $1.73 | 0d | 1 | 0.95mi |
| 1545 W Crystal Rock Ct Unit 1D Round Lake, IL | 2.0 | 1.0 | 944 | $1,800 | $1.91 | 0d | 1 | 1.29mi |
Listing history 10 events
-
2026-06-21days on market $239,000 Active 77 DOM
-
2026-06-18remarks 193-char remark
-
2026-06-18status $239,000 Active 74 DOM
-
2026-06-18days on market $239,000 Temporarily No Showings 74 DOM
-
2026-06-17statusdays on market $239,000 Temporarily No Showings 73 DOM
-
2026-06-16days on market $239,000 Active 72 DOM
-
2026-06-15days on market $239,000 Active 71 DOM
-
2026-06-13days on market $239,000 Active 69 DOM
-
2026-06-13remarks 107-char remark
-
2026-06-13$239,000 Active 68 DOM
ⓘ Source: listings_history table (triggers on properties + properties_extension) + one-shot
backfill from property_details.listing_events for pre-trigger history.
Tax reassessment forecast IL · Partial reset (capped growth)
- Current annual tax
- $4,376 · $365/mo
- Projected year-2 tax
- $4,901 · $408/mo
- Expected delta
- +$525/yr (+$44/mo · 12.0%)
ⓘ Screening estimate from a state-policy table — verify with the county assessor before closing.
Climate risk First Street
- Flood 1/10 Low FEMA zone X (unshaded) · 0% chance over 30 yrs
- Wildfire 2/10 Low
- Heat 2/10 Low 7 d/yr ≥101°F today · 14 d/yr by 30 yrs out
- Wind 2/10 Low
- Air quality 3/10 Moderate 2 unhealthy d/yr today · 3 by 30 yrs out
Nearby sold comps map
Loading sold comps map…
Walkable amenities ~0.75 mi
Loading nearby amenities…
Taxation est. · year 1
- Rental income
- $27,658
- − Mortgage interest
- −$13,388
- − Property taxes
- −$4,376
- − Insurance
- −$1,195
- − Repairs & maintenance
- −$2,213
- − Management
- −$2,213
- − Depreciation
- −$6,953
- Taxable loss
- −$2,679
- Est. tax savings @ 24.0%
- +$643
- After-tax cash flow
- $1,882/yr
For passive investors: Depreciation is non-cash, so a rental often shows a tax loss while cash-flowing — sheltering income. Rental losses are passive: they offset passive income freely, and up to $25,000/yr can offset ordinary (W-2) income if you actively participate and your MAGI is under $100k (phasing out to $0 by $150k); unused losses carry forward. On sale, claimed depreciation is recaptured at up to 25%, and gains may owe capital-gains tax (a 1031 exchange can defer both). Figures are a year-1 estimate at your 24.0% rate — not tax advice; consult a CPA.
Schools (NCES district)
- District
- Round Lake CUSD 116
- NCES district ID
- 1734990
- Math proficiency
- 7% ▼ -6.00%
- Reading proficiency
- 14% ▼ -2.00%
- Median HH income
- $53,477
- Composite
- 10.35/100
- National rank
- #9789
- State rank
- #560 of 620 in IL
Livability — Round Lake Heights
- Score
- 67/100
- State rank
- #505
- US rank
- #10452
Category grades
Schools grade is shown separately in the Schools card above.
Census & demographics
- Census place
- Round Lake Heights, IL
- County
- Lake County · 591,991 people
- Metro
- Chicago-Naperville-Elgin, IL-IN-WI
- Population (ZIP)
- 62,868
- Household income
- $98,514
- Rent vs Own
- Severe rent burden
- 1225.0
Population outlook (Lake County) Hauer SSP2
- Today (2025)
- 700,217 people
- By 2030
- 693,290 · -1.0%
- By 2040
- 673,588 · -3.8%
- By 2050
- 643,556 · -8.1%
- By 2075
- 562,792 · -19.6%
- By 2100
- 457,715 · -34.6%
Race, ethnicity, and origin ACS 2023
- Neighborhood character
- Diverse neighborhood (Simpson 0.63)
- Race & ethnicity
- Hispanic / Latino 45% White 40% Two or more races 20% Asian 7% Black 4% Native American 2%
- Hispanic origin (detail)
- Mexican 37% Puerto Rican 3%
- Common ancestry
- Romanian 8% Portuguese 1% Lithuanian 1%
- Foreign-born
- 25% · Canada, South Korea, Vietnam
- Languages at home
- 56% English-only · Spanish 35% Russian/Polish/Slavic 2% Other Indo-European 2%
Political lean MEDSL · Lake
- 2024 margin
- Strong D (+20.8) · D 59.7% · R 38.9% · Other 1.4%
- 2008→2024 swing
- +1.1pp toward D · 2008: 19.6pp · 2024: 20.8pp
- All cycles
- 2024: D+20.8 2020: D+24.1 2016: D+20.3 2012: D+8.1 2008: D+19.6
Not yet ingested
- Civics
- —
Market trends
- HPI YoY
- ▼ -140.95%
- Current HPI
- 229.1762
- Rent YoY
- ▲ 2.87%
- Metro
- Chicago-Naperville-Elgin, IL-IN-WI
- State GDP YoY
- ▲ 1.59%
- F500 in state
- 60
Industry mix (Fortune 500 HQ in IL)
| Industry | F500 HQs | Revenue |
|---|---|---|
| Insurance | 4 | $201B |
|
||
| Consumer Goods | 4 | $87B |
|
||
| Industrial Machinery | 3 | $64B |
|
||
| Healthcare | 2 | $55B |
|
||
| Retail / Pharmacy | 1 | $148B |
|
||
| Agriculture / Food | 1 | $86B |
|
||
Property tax history
+7.5%/yrLatest (2024): $4,376 · +13.5% YoY. Source: county tax records.
Cash-flow waterfall
monthlySold comps — $/sqft
last 12 mo · ≤1 miLoading sold comps…