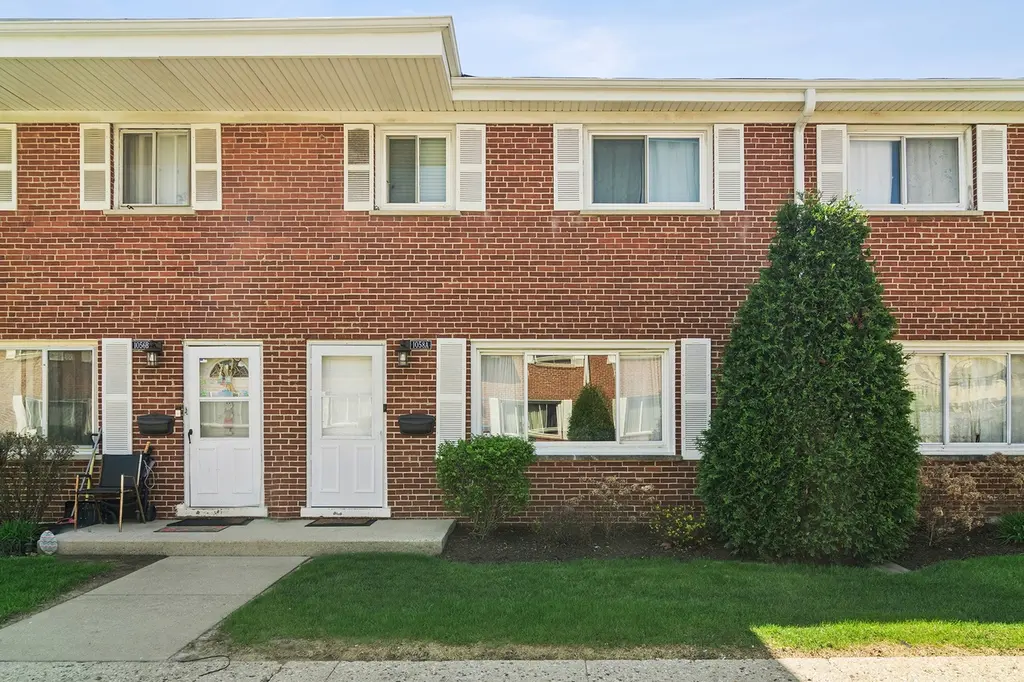
1058 N Boxwood Dr Unit A · Mount Prospect, IL
Flood risk 1/10 · Minimal
- FEMA flood zone
- X (unshaded)
- Chance of flooding over 30 yrs
- 0.0%
- Est. flood insurance / yr
- $473 – $860
Fire risk 1/10 · Minimal
- Est. fire insurance / yr
- $804 – $1,492
Heat risk 3/10 · Minor
- Hot days now (above 100°F)
- 7 days/yr
- Hot days in 30 yrs
- 14 days/yr
Wind risk 2/10 · Minimal
- Chance of severe wind over 30 yrs
- 0.0%
Air-quality risk 4/10 · Minor
- Unhealthy air days now
- 4 days/yr
- Unhealthy air days in 30 yrs
- 4 days/yr
Risk factors via First Street. Map © Google.
Why this score? — see what drove the D+ grade
The composite is a weighted blend of 9 inputs, each scored 0–100. Each bar is that input's sub-score; the figure is the points it added to the 100-point composite (weight × sub-score).
- ARV discount +15.0/15.0
- Cash flow +11.5/30.0
- 1% rule +4.9/10.0
- Livability +4.2/5.0
- Schools +3.9/10.0
- DSCR +3.4/10.0
- Rent growth +2.8/5.0
- Condition / age +2.5/5.0
- Appreciation +0.0/10.0
$265,000
🖨 Deal sheet 📄 Offer letter ✓ Due diligence
Listing remarks MLS
CHARMING MOVE-IN READY TWO STORY BRICK TOWNHOUSE. 3 BEDROOM, 1.5 BATH WITH BASEMENT, LARGE EAT-IN KITCHEN AND LOTS OF STORAGE. ALL COORDINATED APPLIANCES STAY INCLUDING DOUBLE OVEN AND BUILT-IN MICROWAVE. LAMINATE WOOD FLOORING 1ST FLOOR, HARDWOOD FLOORS 2ND FLOOR, VINYL IN PARTIALLY FINISHED BASEMENT. WALKING DISTANCE TO PARK, ELEMENTARY SCHOOL, PARK, SHOPPING, ENTERTAINMENT AND PUBLIC TRANSPORTATION. 2 PARKING SPACES COME WITH UNIT.
Key facts
- $240 HOA
- 2 parking spots
- Built 1963
Property features AI
Finance
- Other: 4-unit building; Total finished/unfinshed area noted; Partially finished basement with storage and full basement areas
- HOA & community: Monthly association fee of $240; Association covers parking, exterior maintenance, lawn care, scavenger, and snow removal; Community amenities include a park; Manager off-site; Pets allowed (cats and dogs; high max pet weight noted)
Exterior
- Parking: 2 total parking spaces; Assigned parking plus guest and additional parking available
- Utilities: Water source: Lake Michigan; Sewer: Overhead sewers; Power: typical municipal service
- Home design: Attached single — townhouse, 2-story model; Entry level on level 1; Built approximately 61–70 years ago
- Construction: Brick construction; Asphalt roof; Concrete perimeter foundation; Built before 1978
- Exterior features: Patio; Lot dimensions approximately 20 x 55
Interior
- Kitchen: Eating area / table space; Pantry closet; Granite counters; Range; Microwave; Dishwasher; Refrigerator; Stainless steel appliances
- Bedrooms: 3 bedrooms (Master and two additional bedrooms on second level); Bonus room in the basement (approx. 12 x 16)
- Flooring: Hardwood flooring in bedrooms and master; Wood laminate in living room and kitchen; Luxury vinyl in bonus room
- Bathrooms: 1 full bath; 1 half bath
- Heating & cooling: Natural gas heating; Central air conditioning; Ceiling fan(s)
- Interior features: Storage; Screens on windows; Some photos virtually staged
- Laundry & utility: Laundry room in basement with washer hookup (in unit); Washer and dryer included
Neighborhood map
What this means for you Summary
Snapshot
- This is a 3-bed/1.5-bath townhouse listed at $265k.
Deal economics
- At list price, monthly cash flow is $-86 ($-1k/yr) — negative.
- To cash-flow at today's rent, offer at most $250k (5.7% below list).
- To meet the 1% rule (rent ≥ 1% of price), the offer needs to be $263k (0.7% below list).
- Recommended offer: $250k (5.7% below list) — sets the bar for cash-flow.
- Cap rate 5.9% vs local median 3.2% in Mount Prospect — top-decile yield for the area; either an underpriced asset or a hidden risk that comps aren't pricing in. Stress-test before assuming the spread holds.
Location & tenants
- Location reads 84/100 on livability (#32 in IL, #638 nationally) — a professional / high-income tenant draw. Strengths: crime A+, commute A+, employment A+; Watch: cost of living D+, health & safety D+.
- Township Hsd 214 (suburban): math 42% / reading 45% proficiency, ranked #103 of 620 in IL (top 17%) — families likely to look elsewhere, expect single-tenant / working-renter base with shorter leases.
- Zoned schools: John Hersey High School (math 56% / reading 63%, grade C+, #20 of 693 statewide, top 3%, 2,026 students, 0% FRL).
- Zoned-school proficiency averages 60% at this address vs 44% district-wide (+16 pts) — the actual schools serving this property are materially stronger than the Township Hsd 214 average implies; a family-tenant draw the district grade alone would hide.
- Market conditions: Rents rising (+1.3%/yr); 93 active listings in the ZIP; 7 comparable units currently listed for rent nearby; rentals at typical pace (median 15d on market — plan ~3-4 weeks tenant-placement turnaround); solid renter incomes; 6,272 units permitted in Cook County in 2024 (4,658 in 5+ unit buildings).
- This rent runs 31% of the median local income ($102k/yr) — at the standard rent-burdened threshold; future hikes will face affordability resistance.
Forward outlook
- Local home prices are declining (-3.0%/yr); year-one equity from $2k of loan paydown is wiped out by about $8k of value loss. Plan a longer hold.
Negotiation context
- It's been on market 40 days — a 3% lower offer ($257k) is reasonable based on typical stale-listing flexibility.
- 10 sale attempts since 19y ago with the ask held roughly flat each time — persistent listings suggest the price (not the market) is what's stuck; bring a comps-based counter.
- Current owner paid $215k; 23% above their basis — modest negotiation headroom, anchor on the comps not their cost.
Questions for the listing agent
- What do current leases actually rent for vs. the listed asking? Can we see a recent rent roll and the last 12 months of T-12 income?
- It's been on market 40 days. Have you received any prior offers? Is the seller open to a 6% concession, seller financing, or rate buy-down credit?
- Built in 1963 — when were the roof, HVAC, electrical panel, plumbing, and water heater last replaced?
- What does the HOA fee cover, when was the last increase, and are there any pending special assessments or reserve-fund shortfalls?
- Is there a deadline driving the sale (1031 exchange, divorce, estate, relocation)? That informs how much negotiation room exists.
- The area grade is low — what's the realistic commute time and amenity access for the typical tenant pool here? Any planned neighborhood developments (good or bad) we should know about?
- What's the average days-on-market for RENTAL listings here right now (not sales)? A rising rental-DOM trend means longer vacancies and softer asking-rent achievability than the comps imply.
- What's the recent tenant-quality profile in this submarket — average credit score on applications, eviction rate, late-payment / NSF rate, and stable-employment percentage? A property-management company in the area should have these aggregated.
- How much new for-sale + rental construction is in the pipeline within 1–3 miles? Heavy new supply typically softens prices + rents 12–24 months out; constrained supply supports both.
Investment metrics
- 1% rule
- 0.99% ✗
- Cap rate
- 5.90%
- Cash-on-cash
- -1.39%
- DSCR
- 0.94
- GRM
- 8.4
CMA / ARV
- ARV (on-the-fly)
- $319,509
- Comps found
- 12
Show comp detail 12 sales within ~0.75 mi
| Address | Dist | Beds/Ba | Sqft | Sold | Price | $/sf | Match |
|---|---|---|---|---|---|---|---|
| 1058 N Boxwood Dr Unit A | 0.00mi | 3/1.5 | 1,179 (0%) | 0mo | $275,000 | $233 | 100 |
| 934 N Wheeling Rd | 0.20mi | 3/1.5 | 1,169 (-1%) | 0mo | $328,000 | $281 | 89 |
| 1212 N Wheeling Rd | 0.21mi | 3/1.5 | 1,169 (-1%) | 1mo | $329,896 | $282 | 88 |
| 1120 N Boxwood Dr Unit B | 0.06mi | 3/2.5 | 1,179 (0%) | 6mo | $297,000 | $252 | 88 |
| 932 N Wheeling Rd | 0.20mi | 3/1.5 | 1,169 (-1%) | 4mo | $320,000 | $274 | 86 |
| 1210 N Wheeling Rd | 0.21mi | 3/1.5 | 1,169 (-1%) | 4mo | $325,000 | $278 | 86 |
| 1240 N Boxwood Dr | 0.22mi | 3/1.5 | 1,300 (+10%) | 1mo | $324,000 | $249 | 72 |
| 612 Maple Ct | 0.48mi | 3/2.5 | 1,148 (-3%) | 2mo | $275,000 | $240 | 68 |
| 1400 N Elmhurst Rd #302 | 0.64mi | 2/2.0 (-1) | 1,200 (+2%) | 5mo | $247,500 | $206 | 56 |
| 676 Regent Ln | 0.74mi | 2/2.0 (-1) | 1,200 (+2%) | 2mo | $325,000 | $271 | 54 |
| 509 Aberdeen Ln Unit C | 0.63mi | 2/2.0 (-1) | 1,307 (+11%) | 3mo | $289,000 | $221 | 43 |
| 250 Country Club Dr #250 | 0.67mi | 2/2.0 (-1) | 1,346 (+14%) | 4mo | $430,100 | $320 | 34 |
Match score weights: distance 35% · size 25% · config 20% · recency 20%. Top-matched comps best support the ARV.
Projected returns pro-forma
-3.0% appreciation · 1.28% rent growth · sell at horizon
- IRR
- -20.8%
- Equity multiple
- 0.29×
- Total profit
- $-52,658
- Equity at exit
- $39,512
- IRR
- -19.3%
- Equity multiple
- 0.06×
- Total profit
- $-69,671
- Equity at exit
- $22,912
Cash invested: $74,200 (down + closing). Projections, not guarantees.
Landlord ↔ Tenant lean methodology
- Overall (STATE)
- 43 Moderately Tenant-Leaning
- State Illinois
- 43 Moderately Tenant-Leaning · D+7
- County
- — inherits STATE
- City
- — inherits STATE
ZIP-level market 60056
- Rents YoY
- 1.3%
- Active inventory
- 93
- Price-to-rent
- 8.4×
Monthly cashflow live
- Estimated rent
- $2,632 high interval (Pro) →
- Mortgage (P&I)
- −$1,390
- Tax from tax record
- −$425 /mo · $5,103/yr
- Insurance
- −$110
- HOA
- −$240
- Vacancy / Maint / Mgmt
- −$553
- Net cashflow
- $-86
Break-even live
UW: 25.0% down · 7.5% · 30yr · 1.5% tax · 5.0% vac · 8.0% maint · 8.0% mgmt
Financing live
Cash to close
- Down payment
- $66,250
- Closing costs
- $7,950
- Reserves months
- —
- Total cash needed
- —
Loan-product check · same deal, 3 products live
Conventional
25% down · 7.5% · 30yr
- Down + closing
- —
- Monthly P&I
- —
- Monthly cashflow
- —
- DSCR
- —
- Eligible?
- —
Personal DTI + credit; lowest rate.
DSCR
20% down · 8.5% · 30yr
- Down + closing
- —
- Monthly P&I
- —
- Monthly cashflow
- —
- DSCR
- —
- Eligible?
- —
No personal income docs; deal must DSCR.
Hard money
10% down · 12.0% · 12mo
- Down + closing
- —
- Monthly P&I
- —
- Monthly cashflow
- —
- DSCR
- —
- Eligible?
- —
Short-term bridge; refi at stabilization.
Rent comps 7 comps
| Address | Beds | Baths | Sqft | Rent | $/sqft | DOM | Units | Dist |
|---|---|---|---|---|---|---|---|---|
| 926 N Boxwood Dr Unit B Mt Prospect, IL | 3.0 | 1.5 | 1179 | $2,795 | $2.37 | 14d | 1 | 0.15mi |
| 1002 E Callero Cir Unit 2 Mt Prospect, IL | 3.0 | 1.5 | 1350 | $2,600 | $1.93 | 24d | 1 | 0.98mi |
| 1001 E Callero Cir Unit 1 Mt Prospect, IL | 3.0 | 2.0 | 1500 | $2,600 | $1.73 | 5d | 1 | 1.02mi |
| 413 N Forest Ave Mount Prospect, IL | 3.0 | 1.0 | 1040 | $3,150 | $3.03 | 16d | 1 | 1.06mi |
| 413 N Forest Ave Mount Prospect, IL | 3.0 | 1.0 | 1040 | $3,150 | $3.03 | 18d | 1 | 1.06mi |
| 10 N Main St Mt Prospect, IL | 2.0 | 1.0–2.0 | 891 | $3,155 | $3.54 | 1d | 4 | 1.26mi |
| 1006 Butternut Ln Unit C Mount Prospect, IL | 2.0 | 2.0 | 1400 | $2,400 | $1.71 | 10d | 1 | 1.27mi |
HOA detail
- Monthly dues
- $240 · $2,880/yr
Listing history 36 events
-
2026-06-04status $265,000 Pending 40 DOM
-
2026-06-03days on market $265,000 Contingent - Continue to Show 40 DOM
-
2026-06-02days on market $265,000 Contingent - Continue to Show 39 DOM
-
2026-06-01days on market $265,000 Contingent - Continue to Show 38 DOM
-
2026-05-31days on market $265,000 Contingent - Continue to Show 37 DOM
-
2026-05-05historical Contingent - Continue to Show
-
2026-04-24$265,000 Active
-
2022-07-01soldstatus $215,000
-
2022-06-22soldstatus $215,000 Closed 438-char remark
Show marketing remark (438 chars)
CHARMING MOVE-IN READY TWO STORY BRICK TOWNHOUSE. 3 BEDROOM, 1.5 BATH WITH BASEMENT, LARGE EAT-IN KITCHEN AND LOTS OF STORAGE. ALL COORDINATED APPLIANCES STAY INCLUDING DOUBLE OVEN AND BUILT-IN MICROWAVE. LAMINATE WOOD FLOORING 1ST FLOOR, HARDWOOD FLOORS 2ND FLOOR, VINYL IN PARTIALLY FINISHED BASEMENT. WALKING DISTANCE TO PARK, ELEMENTARY SCHOOL, PARK, SHOPPING, ENTERTAINMENT AND PUBLIC TRANSPORTATION. 2 PARKING SPACES COME WITH UNIT.
-
2022-05-27historical Contingent - Continue to Show 438-char remark
Show marketing remark (438 chars)
CHARMING MOVE-IN READY TWO STORY BRICK TOWNHOUSE. 3 BEDROOM, 1.5 BATH WITH BASEMENT, LARGE EAT-IN KITCHEN AND LOTS OF STORAGE. ALL COORDINATED APPLIANCES STAY INCLUDING DOUBLE OVEN AND BUILT-IN MICROWAVE. LAMINATE WOOD FLOORING 1ST FLOOR, HARDWOOD FLOORS 2ND FLOOR, VINYL IN PARTIALLY FINISHED BASEMENT. WALKING DISTANCE TO PARK, ELEMENTARY SCHOOL, PARK, SHOPPING, ENTERTAINMENT AND PUBLIC TRANSPORTATION. 2 PARKING SPACES COME WITH UNIT.
-
2022-05-23$220,000 Active 438-char remark
Show marketing remark (438 chars)
CHARMING MOVE-IN READY TWO STORY BRICK TOWNHOUSE. 3 BEDROOM, 1.5 BATH WITH BASEMENT, LARGE EAT-IN KITCHEN AND LOTS OF STORAGE. ALL COORDINATED APPLIANCES STAY INCLUDING DOUBLE OVEN AND BUILT-IN MICROWAVE. LAMINATE WOOD FLOORING 1ST FLOOR, HARDWOOD FLOORS 2ND FLOOR, VINYL IN PARTIALLY FINISHED BASEMENT. WALKING DISTANCE TO PARK, ELEMENTARY SCHOOL, PARK, SHOPPING, ENTERTAINMENT AND PUBLIC TRANSPORTATION. 2 PARKING SPACES COME WITH UNIT.
-
2022-04-14historical Contingent - No Showings
-
2022-04-14historical
-
2022-04-04Active
-
2015-01-30soldstatus $105,000 Closed Sale
-
2014-12-10status Contingent (Do Not Show)
-
2014-11-26price $104,900
-
2014-10-24$124,900 New
-
2013-01-03historical
-
2012-07-05historical Contingent
-
2012-03-24status Reactivated
-
2012-03-16historical Contingent
-
2012-02-21price Reactivated
-
2012-02-21status Reactivated
-
2011-11-15historical Contingent
-
2011-11-10New
-
2009-04-24historical
-
2009-03-15price
-
2008-11-22price
-
2008-11-03price
-
2008-10-21
-
2008-03-30historical
-
2007-07-10
-
2007-06-27historical
-
2007-03-22
-
2003-10-15soldstatus $140,000
ⓘ Source: listings_history table (triggers on properties + properties_extension) + one-shot
backfill from property_details.listing_events for pre-trigger history.
Tax reassessment forecast IL · Partial reset (capped growth)
- Current annual tax
- $5,103 · $425/mo
- Projected year-2 tax
- $5,559 · $463/mo
- Expected delta
- +$456/yr (+$38/mo · 8.9%)
ⓘ Screening estimate from a state-policy table — verify with the county assessor before closing.
Climate risk First Street
- Flood 1/10 Low FEMA zone X (unshaded) · 0% chance over 30 yrs
- Wildfire 1/10 Low
- Heat 3/10 Moderate 7 d/yr ≥100°F today · 14 d/yr by 30 yrs out
- Wind 2/10 Low 0% chance of damaging wind over 30 yrs
- Air quality 4/10 Moderate 4 unhealthy d/yr today · 4 by 30 yrs out
Nearby sold comps map
Loading sold comps map…
Walkable amenities ~0.75 mi
Loading nearby amenities…
Taxation est. · year 1
- Rental income
- $31,584
- − Mortgage interest
- −$14,844
- − Property taxes
- −$5,103
- − Insurance
- −$1,325
- − Repairs & maintenance
- −$2,527
- − Management
- −$2,527
- − HOA
- −$2,880
- − Depreciation
- −$7,709
- Taxable loss
- −$5,331
- Est. tax savings @ 24.0%
- +$1,279
- After-tax cash flow
- $246/yr
For passive investors: Depreciation is non-cash, so a rental often shows a tax loss while cash-flowing — sheltering income. Rental losses are passive: they offset passive income freely, and up to $25,000/yr can offset ordinary (W-2) income if you actively participate and your MAGI is under $100k (phasing out to $0 by $150k); unused losses carry forward. On sale, claimed depreciation is recaptured at up to 25%, and gains may owe capital-gains tax (a 1031 exchange can defer both). Figures are a year-1 estimate at your 24.0% rate — not tax advice; consult a CPA.
Schools (NCES district)
- District
- Township Hsd 214
- NCES district ID
- 1704170
- Math proficiency
- 42% ▼ -10.00%
- Reading proficiency
- 45% ▼ -4.00%
- Median HH income
- $68,267
- Composite
- 39.13/100
- National rank
- #4035
- State rank
- #103 of 620 in IL
Livability — Mount Prospect
- Score
- 84/100
- State rank
- #32
- US rank
- #638
Category grades
Schools grade is shown separately in the Schools card above.
Census & demographics
- Census place
- Mount Prospect, IL
- County
- Cook County · 4,486,803 people
- City population
- 55,818
- Metro
- Chicago-Naperville-Elgin, IL-IN-WI
- Population (ZIP)
- 55,818
- Household income
- $101,922
- Rent vs Own
- Severe rent burden
- 1485.0
Population outlook (Cook County) Hauer SSP2
- Today (2025)
- 5,347,519 people
- By 2030
- 5,357,703 · +0.2%
- By 2040
- 5,324,924 · -0.4%
- By 2050
- 5,230,762 · -2.2%
- By 2075
- 4,785,735 · -10.5%
- By 2100
- 4,188,836 · -21.7%
Race, ethnicity, and origin ACS 2023
- Neighborhood character
- Diverse neighborhood (Simpson 0.55)
- Race & ethnicity
- White 63% Hispanic / Latino 16% Asian 15% Two or more races 9% Black 3%
- Hispanic origin (detail)
- Mexican 13% Puerto Rican 1%
- Common ancestry
- Romanian 14% French 2% Italian 1%
- Foreign-born
- 30% · Canada, South Korea, China
- Languages at home
- 57% English-only · Spanish 12% Russian/Polish/Slavic 12% Other Indo-European 7%
Political lean MEDSL · Cook
- 2024 margin
- Solid D (+42.0) · D 70.4% · R 28.4% · Other 1.2%
- 2008→2024 swing
- -11.4pp toward R · 2008: 53.4pp · 2024: 42.0pp
- All cycles
- 2024: D+42.0 2020: D+50.3 2016: D+53.0 2012: D+49.4 2008: D+53.4
Not yet ingested
- Civics
- —
Market trends
- HPI YoY
- ▼ -325.14%
- Current HPI
- 202.4367
- Rent YoY
- ▲ 1.28%
- Metro
- Chicago-Naperville-Elgin, IL-IN-WI
- State GDP YoY
- ▲ 1.59%
- F500 in state
- 60
Industry mix (Fortune 500 HQ in IL)
| Industry | F500 HQs | Revenue |
|---|---|---|
| Insurance | 4 | $201B |
|
||
| Consumer Goods | 4 | $87B |
|
||
| Industrial Machinery | 3 | $64B |
|
||
| Healthcare | 2 | $55B |
|
||
| Retail / Pharmacy | 1 | $148B |
|
||
| Agriculture / Food | 1 | $86B |
|
||
Price history
+89.3% since first listed31 events — show timeline
- 2026-05-05 Contingent — MRED as Distributed by MLS Grid
- 2026-04-24 Listed $265,000 MRED as Distributed by MLS Grid
- 2022-07-01 Sold (Public Records) $215,000 Public Records
- 2022-06-22 Sold (MLS) $215,000 MRED as Distributed by MLS Grid
- 2022-05-27 Contingent — MRED as Distributed by MLS Grid
- 2022-05-23 Listed $220,000 MRED as Distributed by MLS Grid
- 2022-04-14 Contingent — MRED as Distributed by MLS Grid
- 2022-04-14 Listing Removed — MRED as Distributed by MLS Grid
- 2022-04-04 Listed — MRED as Distributed by MLS Grid
- 2015-01-30 Sold (MLS) $105,000 MRED as Distributed by MLS Grid
- 2014-12-10 Pending — MRED as Distributed by MLS Grid
- 2014-11-26 Price Changed $104,900 MRED as Distributed by MLS Grid
- 2014-10-24 Listed $124,900 MRED as Distributed by MLS Grid
- 2013-01-03 Listing Removed — MRED as Distributed by MLS Grid
- 2012-07-05 Contingent — MRED as Distributed by MLS Grid
- 2012-03-24 Relisted — MRED as Distributed by MLS Grid
- 2012-03-16 Contingent — MRED as Distributed by MLS Grid
- 2012-02-21 Relisted — MRED as Distributed by MLS Grid
- 2012-02-21 Price Changed — MRED as Distributed by MLS Grid
- 2011-11-15 Contingent — MRED as Distributed by MLS Grid
- 2011-11-10 Listed — MRED as Distributed by MLS Grid
- 2009-04-24 Listing Removed — MRED as Distributed by MLS Grid
- 2009-03-15 Price Changed — MRED as Distributed by MLS Grid
- 2008-11-22 Price Changed — MRED as Distributed by MLS Grid
- 2008-11-03 Price Changed — MRED as Distributed by MLS Grid
- 2008-10-21 Listed — MRED as Distributed by MLS Grid
- 2008-03-30 Listing Removed — MRED as Distributed by MLS Grid
- 2007-07-10 Listed — MRED as Distributed by MLS Grid
- 2007-06-27 Listing Removed — MRED as Distributed by MLS Grid
- 2007-03-22 Listed — MRED as Distributed by MLS Grid
- 2003-10-15 Sold (Public Records) $140,000 Public Records
Property tax history
+5.4%/yrLatest (2023): $5,103 · +30.5% YoY. Source: county tax records.
Cash-flow waterfall
monthlySold comps — $/sqft
last 12 mo · ≤1 miLoading sold comps…