166 Crystal Brk · Griffin, GA
Flood risk 4/10 · Minor
- FEMA flood zone
- X (unshaded)
- Chance of flooding over 30 yrs
- 0.24%
- Est. flood insurance / yr
- $507 – $1,088
Fire risk 3/10 · Minor
- Est. fire insurance / yr
- $963 – $1,789
Heat risk 6/10 · Moderate
- Hot days now (above 104°F)
- 7 days/yr
- Hot days in 30 yrs
- 18 days/yr
Wind risk 6/10 · Moderate
- Chance of severe wind over 30 yrs
- 42.0%
Air-quality risk 4/10 · Minor
- Unhealthy air days now
- 4 days/yr
- Unhealthy air days in 30 yrs
- 5 days/yr
Risk factors via First Street. Map © Google.
Why this score? — see what drove the D grade
The composite is a weighted blend of 9 inputs, each scored 0–100. Each bar is that input's sub-score; the figure is the points it added to the 100-point composite (weight × sub-score).
- Cash flow +15.7/30.0
- ARV discount +8.5/15.0
- DSCR +4.8/10.0
- 1% rule +3.4/10.0
- Rent growth +3.3/5.0
- Livability +2.7/5.0
- Condition / age +2.5/5.0
- Schools +1.4/10.0
- Appreciation +0.0/10.0
$171,500
🖨 Deal sheet (PDF) 📄 Offer letter ✓ Due diligence
Listing remarks
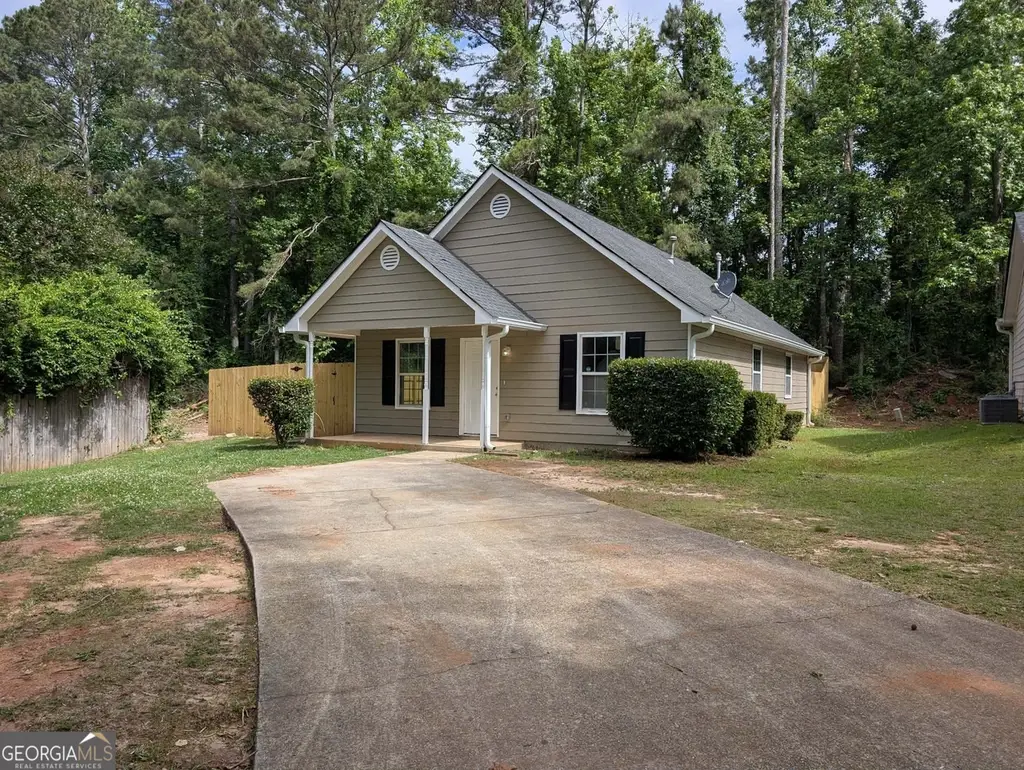
Welcome home to this beautifully updated 3-bedroom, 1-bath ranch-style home tucked away on a quiet cul-de-sac in northwest Griffin/Spalding County. Conveniently located near shopping and dining, and just 45 minutes from Hartsfield-Jackson Airport, this home offers both comfort and accessibility. Step inside to find a completely refreshed interior featuring all new paint, brand-new flooring throughout, stylish new light fixtures, and a fully updated kitchen with all new stainless steel appliances. The exterior has been thoughtfully upgraded as well, with fresh paint and a brand-new roof providing peace of mind for years to come. Outside, enjoy a freshly sodded side and backyard, perfect for
Key facts
- Brand-new roof
- Updated interior
- 4,356 sq ft lot
Tags
Property features AI
Finance
- HOA & community: No homeowners association
Exterior
- Parking: Parking pad (open parking)
- Utilities: Public water; Public sewer; High-speed internet available
- Home design: Single-family house; Updated/remodeled; Built in 1993
- Construction: Vinyl siding; Composition roof; Built in 1993
- Exterior features: Back yard with privacy wood fencing; Fenced yard; Located on a cul-de-sac
Interior
- Kitchen: Stainless steel appliances; Dishwasher; Refrigerator
- Bedrooms: 3 bedrooms (all on the main level)
- Flooring: Vinyl flooring
- Bathrooms: 1 full bathroom (main level)
- Heating & cooling: Central heating; Central air conditioning
- Interior features: High ceilings; One-level living; Family room
- Laundry & utility: Laundry in hall
Neighborhood map
What this means for you Summary
Snapshot
- This is a 3-bed/2.0-bath single-family listed at $172k.
Deal economics
- At list price, monthly cash flow is $74 ($889/yr) — positive.
- The deal already cash-flows at list — no discount required.
- To meet the 1% rule (rent ≥ 1% of price), the offer needs to be $145k (15.6% below list).
- Recommended offer: $145k (15.6% below list) — sets the bar for 1% rule.
- Cap rate 6.8% vs local median 4.3% in Griffin — top-decile yield for the area; either an underpriced asset or a hidden risk that comps aren't pricing in. Stress-test before assuming the spread holds.
Location & tenants
- Location reads 54/100 on livability (#529 in GA) — a working-class tenant base; expect higher turnover. Strengths: cost of living A+, housing A+; Watch: crime F, amenities F, commute F.
- Griffin-Spalding County (suburban): math 13% / reading 19% proficiency, ranked #151 of 174 in GA (top 87%) — low school quality limits family demand, transient renter base, plan for 1-2y turnover; 68% free/reduced lunch — lower-income household profile, screen leases tightly.
- Zoned schools: Cowan Road Elementary School (math 12% / reading 12%, grade F, #1,041 of 1,228 statewide, top 87%, 566 students, 98% FRL); Cowan Road Middle School (math 8% / reading 14%, grade F, #426 of 470 statewide, top 91%, 543 students, 98% FRL); Griffin High School (math 7% / reading 19%, grade F, #331 of 424 statewide, top 78%, 1,498 students, 98% FRL) — zoned schools average 98% FRL vs 68% district-wide (30 pts higher); higher-poverty schools than district average — tighter screening recommended.
- Market conditions: Rents rising (+3.3%/yr); 440 active listings in the ZIP; 22 comparable units currently listed for rent nearby; rentals at typical pace (median 24d on market — plan ~3-4 weeks tenant-placement turnaround); 342 units permitted in Spalding County in 2024 (0 in 5+ unit buildings).
Forward outlook
- Local home prices are declining (-3.0%/yr); year-one equity from $1k of loan paydown is wiped out by about $5k of value loss. Plan a longer hold.
- Spalding County population projected at -15% by 2050 — secular population decline; favor cash flow + early exit over multi-decade hold.
Negotiation context
- It's been on market 39 days — a 3% lower offer ($166k) is reasonable based on typical stale-listing flexibility.
Risks & watch-outs
- Climate carrying-cost: major wind risk, 42% chance of damaging wind over 30y; extreme-heat days projected 7→18/yr by 2055 (HVAC capex compounding) — expect insurance premiums to compound above CPI over the hold.
Questions for the listing agent
- It's been on market 39 days. Have you received any prior offers? Is the seller open to a 16% concession, seller financing, or rate buy-down credit?
- Is there a deadline driving the sale (1031 exchange, divorce, estate, relocation)? That informs how much negotiation room exists.
- Schools are F-rated, which usually means shorter tenancies and higher turnover. Who's the typical renter profile here, and what's been the actual vacancy rate?
- Crime grade is F in this area — have there been break-ins, vandalism, or insurance claims at this property in the last 3 years? What carrier currently insures it and at what premium?
- The area grade is low — what's the realistic commute time and amenity access for the typical tenant pool here? Any planned neighborhood developments (good or bad) we should know about?
- What's the average days-on-market for RENTAL listings here right now (not sales)? A rising rental-DOM trend means longer vacancies and softer asking-rent achievability than the comps imply.
- What's the recent tenant-quality profile in this submarket — average credit score on applications, eviction rate, late-payment / NSF rate, and stable-employment percentage? A property-management company in the area should have these aggregated.
- How much new for-sale + rental construction is in the pipeline within 1–3 miles? Heavy new supply typically softens prices + rents 12–24 months out; constrained supply supports both.
Investment metrics
- 1% rule
- 0.84% ✗
- Cap rate
- 6.81%
- Cash-on-cash
- 1.85%
- DSCR
- 1.08
- GRM
- 9.9
CMA / ARV
- ARV (median comp)
- $175,471
- List price
- $171,500
- Delta
- -2.26%
- Verdict
- FAIR
- Comps
- 20 within 1.0 mi
Show comp detail 12 sales within ~0.75 mi
| Address | Dist | Beds/Ba | Sqft | Sold | Price | $/sf | Match |
|---|---|---|---|---|---|---|---|
| 164 Crystal Brk | 0.01mi | 3/2.0 | 1,108 (+6%) | 2mo | $180,000 | $162 | 87 |
| 154 Crystal Brk | 0.08mi | 3/2.0 | 1,112 (+7%) | 1mo | $184,700 | $166 | 84 |
| 128 Tuscany Ln | 0.06mi | 3/2.0 | 1,112 (+7%) | 5mo | $180,000 | $162 | 82 |
| 128 Crystal Brk | 0.20mi | 3/2.0 | 992 (-5%) | 5mo | $171,000 | $172 | 79 |
| 82 Crystal Brk | 0.42mi | 3/2.0 | 1,040 (0%) | 4mo | $165,000 | $159 | 77 |
| 120 Tuscany Ln | 0.09mi | 3/2.0 | 1,123 (+8%) | 9mo | $175,000 | $156 | 75 |
| 151 Crystal Brk | 0.08mi | 3/2.0 | 1,144 (+10%) | 9mo | $168,000 | $147 | 72 |
| 129 Tuscany Ln | 0.09mi | 3/2.0 | 1,142 (+10%) | 10mo | $174,000 | $152 | 71 |
| 100 Crystal Brk | 0.33mi | 3/2.0 | 1,144 (+10%) | 1mo | $182,000 | $159 | 67 |
| 1615 Hallmark Hills Dr | 0.53mi | 3/2.0 | 1,095 (+5%) | 2mo | $168,000 | $153 | 65 |
| 110 Wedgewood Walk | 0.23mi | 3/2.0 | 1,196 (+15%) | 7mo | $179,000 | $150 | 58 |
| 1639 Hallmark Hills Dr | 0.62mi | 2/1.0 (-1) | 942 (-9%) | 10mo | $138,500 | $147 | 38 |
Match score weights: distance 35% · size 25% · config 20% · recency 20%. Top-matched comps best support the ARV.
Projected returns pro-forma
-3.0% appreciation · 3.34% rent growth · sell at horizon
- IRR
- -13.0%
- Equity multiple
- 0.53×
- Total profit
- $-22,622
- Equity at exit
- $25,571
- IRR
- -3.6%
- Equity multiple
- 0.75×
- Total profit
- $-11,766
- Equity at exit
- $14,828
Cash invested: $48,020 (down + closing). Projections, not guarantees.
Landlord ↔ Tenant lean methodology
- Overall (STATE)
- 90 Strongly Landlord-Friendly
- State Georgia
- 90 Strongly Landlord-Friendly · R+3
- County
- — inherits STATE
- City
- — inherits STATE
ZIP-level market 30223
- Rents YoY
- 3.3%
- Active inventory
- 440
- Price-to-rent
- 9.9×
Monthly cashflow live
- Estimated rent
- $1,448 high interval (Pro) →
- Mortgage (P&I)
- −$899
- Tax from tax record
- −$99 /mo · $1,188/yr
- Insurance
- −$71
- HOA
- −$0
- Vacancy / Maint / Mgmt
- −$304
- Net cashflow
- $74
Break-even live
Sensitivity live
| Price | -10% $171 | -5% $123 | +0% $74 | +5% $26 | +10% $-23 |
|---|---|---|---|---|---|
| Rent | -10% $-40 | -5% $17 | +0% $74 | +5% $131 | +10% $189 |
| Rate | -1.0pp $160 | -0.5pp $118 | base $74 | +0.5pp $30 | +1.0pp $-16 |
UW: 25.0% down · 7.5% · 30yr · 1.5% tax · 5.0% vac · 8.0% maint · 8.0% mgmt
Financing live
Cash to close
- Down payment
- $42,875
- Closing costs
- $5,145
- Reserves months
- —
- Total cash needed
- —
Loan-product check · same deal, 3 products live
Conventional
25% down · 7.5% · 30yr
- Down + closing
- —
- Monthly P&I
- —
- Monthly cashflow
- —
- DSCR
- —
- Eligible?
- —
Personal DTI + credit; lowest rate.
DSCR
20% down · 8.5% · 30yr
- Down + closing
- —
- Monthly P&I
- —
- Monthly cashflow
- —
- DSCR
- —
- Eligible?
- —
No personal income docs; deal must DSCR.
Hard money
10% down · 12.0% · 12mo
- Down + closing
- —
- Monthly P&I
- —
- Monthly cashflow
- —
- DSCR
- —
- Eligible?
- —
Short-term bridge; refi at stabilization.
Rent comps 22 comps
| Address | Beds | Baths | Sqft | Rent | $/sqft | DOM | Units | Dist |
|---|---|---|---|---|---|---|---|---|
| 132 Tuscany Ln Griffin, GA | 3.0 | 2.0 | 1131 | $1,350 | $1.19 | 14d | 1 | 0.05mi |
| 136 Tuscany Ln Griffin, GA | 3.0 | 2.0 | 1144 | $1,600 | $1.40 | 26d | 1 | 0.07mi |
| 127 Tuscany Ln Griffin, GA | 3.0 | 2.0 | 1112 | $1,495 | $1.34 | 7d | 1 | 0.09mi |
| 113 Shandon Ln Griffin, GA | 3.0 | 2.0 | 1075 | $1,495 | $1.39 | 45d | 1 | 0.38mi |
| 1597 W McIntosh Rd Griffin, GA | 1.0–2.0 | 1.0–2.0 | 884 | $1,376 | $1.56 | 0d | 19 | 0.49mi |
| 1608 Hallmark Hills Dr Griffin, GA | 2.0 | 2.0 | 1280 | $1,545 | $1.21 | 14d | 1 | 0.50mi |
| 1601 Hallmark Hills Dr Griffin, GA | 3.0 | 2.5 | 1272 | $1,620 | $1.27 | 26d | 1 | 0.53mi |
| 642 N Pine Hill Rd Griffin, GA | 2.0 | 2.0 | 1140 | $1,195 | $1.05 | 45d | 1 | 1.15mi |
| 415 N 18th St Unit 417 D Griffin, GA | 2.0 | 1.0 | 865 | $1,050 | $1.21 | 45d | 1 | 1.18mi |
| 419 N 18th St Griffin, GA | 2.0 | 1.0 | 865 | $1,050 | $1.21 | 20d | 1 | 1.20mi |
| 419 N 18th St Unit F Griffin, GA | 2.0 | 1.0 | 865 | $1,050 | $1.21 | 26d | 1 | 1.20mi |
| 356 N 19th St Griffin, GA | 2.0 | 1.5 | 896 | $995 | $1.11 | 0d | 1 | 1.22mi |
| 358 N 19th St Apt E Griffin, GA | 2.0 | 1.0 | 936 | $1,025 | $1.10 | 0d | 1 | 1.25mi |
| 358 N 19th St Unit 358E Griffin, GA | 2.0 | 1.5 | 896 | $1,025 | $1.14 | 0d | 1 | 1.25mi |
| 215 Hillside Cir Griffin, GA | 2.0 | 1.0 | 1002 | $975 | $0.97 | 26d | 1 | 1.29mi |
| 207 Hillside Cir Griffin, GA | 3.0 | 1.0 | 1054 | $1,100 | $1.04 | 23d | 1 | 1.31mi |
| 363 N 16th St Griffin, GA | 3.0 | 2.0 | 1300 | $1,550 | $1.19 | 46d | 1 | 1.39mi |
| 928 Ray St Griffin, GA | 4.0 | 1.0 | 1133 | $1,300 | $1.15 | 45d | 1 | 1.40mi |
| 1308 Greenbriar Dr Griffin, GA | 3.0 | 2.0 | 1178 | $1,535 | $1.30 | 0d | 1 | 1.44mi |
| 813 W Quilly St Griffin, GA | 2.0 | 1.0 | 838 | $1,200 | $1.43 | 6d | 1 | 1.44mi |
| 43 Ninety Two Pl Griffin, GA | 2.0 | 2.0 | 1084 | $1,200 | $1.11 | 45d | 1 | 1.46mi |
| 732 Williams St Griffin, GA | 2.0 | 1.0 | 1287 | $1,200 | $0.93 | 7d | 1 | 1.49mi |
Listing history 18 events
-
2026-06-21days on market $171,500 Active 39 DOM
-
2026-06-18days on market $171,500 Active 36 DOM
-
2026-06-17days on market $171,500 Active 35 DOM
-
2026-06-16days on market $171,500 Active 34 DOM
-
2026-06-15days on market $171,500 Active 33 DOM
-
2026-06-13days on market $171,500 Active 31 DOM
-
2026-06-09days on market $171,500 Active 27 DOM
-
2026-06-08days on market $171,500 Active 26 DOM
-
2026-06-07days on market $171,500 Active 25 DOM
-
2026-06-04days on market $171,500 Active 22 DOM
-
2026-06-03days on market $171,500 Active 21 DOM
-
2026-06-02days on market $171,500 Active 20 DOM
-
2026-06-01days on market $171,500 Active 19 DOM
-
2026-05-31days on market $171,500 Active 18 DOM
-
2026-05-13$171,500 New 925-char remark
-
2019-12-04soldstatus $2,654,800
-
2000-03-08soldstatus $61,000
-
2000-03-08soldstatus $61,300
ⓘ Source: listings_history table (triggers on properties + properties_extension) + one-shot
backfill from property_details.listing_events for pre-trigger history.
Tax reassessment forecast GA · Resets to sale price
- Current annual tax
- $1,188 · $99/mo
- Projected year-2 tax
- $1,578 · $131/mo
- Expected delta
- +$390/yr (+$33/mo · 32.8%)
ⓘ Screening estimate from a state-policy table — verify with the county assessor before closing.
Climate risk First Street
- Flood 4/10 Moderate FEMA zone X (unshaded) · 24% chance over 30 yrs
- Wildfire 3/10 Moderate
- Heat 6/10 Major 7 d/yr ≥104°F today · 18 d/yr by 30 yrs out
- Wind 6/10 Major 42% chance of damaging wind over 30 yrs
- Air quality 4/10 Moderate 4 unhealthy d/yr today · 5 by 30 yrs out
Nearby sold comps map
Loading sold comps map…
Walkable amenities ~0.75 mi
Loading nearby amenities…
Taxation est. · year 1
- Rental income
- $17,376
- − Mortgage interest
- −$9,607
- − Property taxes
- −$1,188
- − Insurance
- −$858
- − Repairs & maintenance
- −$1,390
- − Management
- −$1,390
- − Depreciation
- −$4,989
- Taxable loss
- −$2,045
- Est. tax savings @ 24.0%
- +$491
- After-tax cash flow
- $1,380/yr
For passive investors: Depreciation is non-cash, so a rental often shows a tax loss while cash-flowing — sheltering income. Rental losses are passive: they offset passive income freely, and up to $25,000/yr can offset ordinary (W-2) income if you actively participate and your MAGI is under $100k (phasing out to $0 by $150k); unused losses carry forward. On sale, claimed depreciation is recaptured at up to 25%, and gains may owe capital-gains tax (a 1031 exchange can defer both). Figures are a year-1 estimate at your 24.0% rate — not tax advice; consult a CPA.
Schools (NCES district)
- District
- Griffin-Spalding County
- NCES district ID
- 1302520
- Math proficiency
- 13% ▼ -13.00%
- Reading proficiency
- 19% ▼ -12.00%
- Median HH income
- $40,895
- Composite
- 13.71/100
- National rank
- #9496
- State rank
- #151 of 174 in GA
Livability — Griffin
- Score
- 54/100
- State rank
- #529
- US rank
- #23746
Category grades
Schools grade is shown separately in the Schools card above.
Census & demographics
- Census place
- Griffin, GA
- County
- Spalding County · 66,676 people
- City population
- 28,414
- Metro
- Atlanta-Sandy Springs-Alpharetta, GA
- Population (ZIP)
- 38,262
- Household income
- $59,054
- Rent vs Own
- Severe rent burden
- 1297.0
Population outlook (Spalding County) Hauer SSP2
- Today (2025)
- 63,015 people
- By 2030
- 61,689 · -2.1%
- By 2040
- 57,932 · -8.1%
- By 2050
- 53,474 · -15.1%
- By 2075
- 43,228 · -31.4%
- By 2100
- 32,290 · -48.8%
Race, ethnicity, and origin ACS 2023
- Neighborhood character
- Diverse neighborhood (Simpson 0.59)
- Race & ethnicity
- White 50% Black 38% Hispanic / Latino 7% Two or more races 5% Asian 1%
- Hispanic origin (detail)
- Mexican 5%
- Common ancestry
- Slovak 1% Serbian 1%
- Foreign-born
- 4% · Canada, South Korea
- Languages at home
- 92% English-only · Spanish 6% Korean 1%
Political lean MEDSL · Spalding
- 2024 margin
- R (+16.7) · D 41.4% · R 58.1%
- 2008→2024 swing
- +2.1pp toward D · 2008: -18.8pp · 2024: -16.7pp
- All cycles
- 2024: R+16.7 2020: R+20.8 2016: R+24.2 2012: R+20.0 2008: R+18.8
Not yet ingested
- Civics
- —
Market trends
- HPI YoY
- ▼ -142.92%
- Current HPI
- 225.7933
- Rent YoY
- ▲ 3.34%
- Metro
- Atlanta-Sandy Springs-Alpharetta, GA
- State GDP YoY
- ▲ 2.66%
- F500 in state
- 28
Industry mix (Fortune 500 HQ in GA)
| Industry | F500 HQs | Revenue |
|---|---|---|
| Paper / Packaging | 2 | $29B |
|
||
| Retail | 1 | $160B |
|
||
| Transportation / Logistics | 1 | $91B |
|
||
| Airlines | 1 | $62B |
|
||
| Consumer Goods | 1 | $47B |
|
||
| Utilities | 1 | $25B |
|
||
Price history
+181.1% since first listed4 events — show timeline
- 2026-05-13 Listed $171,500 GAMLS
- 2019-12-04 Sold (Public Records) $2,654,800 Public Records
- 2000-03-08 Sold (Public Records) $61,300 Public Records
- 2000-03-08 Sold (Public Records) $61,000 Public Records
Property tax history
+0.4%/yrLatest (2025): $1,188 · -2.2% YoY. Source: county tax records.
Cash-flow waterfall
monthlySold comps — $/sqft
last 12 mo · ≤1 miLoading sold comps…