222 Woodland Cir · Crockett, TX
Flood risk 1/10 · Minimal
- FEMA flood zone
- X (unshaded)
- Chance of flooding over 30 yrs
- 0.0%
- Est. flood insurance / yr
- $507 – $1,088
Fire risk 4/10 · Minor
- Est. fire insurance / yr
- $1,222 – $2,270
Heat risk 8/10 · Major
- Hot days now (above 110°F)
- 7 days/yr
- Hot days in 30 yrs
- 24 days/yr
Wind risk 8/10 · Major
- Chance of severe wind over 30 yrs
- 80.0%
Air-quality risk 1/10 · Minimal
- Unhealthy air days now
- 0 days/yr
- Unhealthy air days in 30 yrs
- 0 days/yr
Risk factors via First Street. Map © Google.
Why this score? — see what drove the D grade
The composite is a weighted blend of 9 inputs, each scored 0–100. Each bar is that input's sub-score; the figure is the points it added to the 100-point composite (weight × sub-score).
- ARV discount +15.0/15.0
- Cash flow +11.4/30.0
- 1% rule +4.0/10.0
- DSCR +3.4/10.0
- Livability +3.1/5.0
- Rent growth +2.5/5.0
- Condition / age +2.5/5.0
- Schools +2.0/10.0
- Appreciation +0.0/10.0
$145,000
🖨 Deal sheet 📄 Offer letter ✓ Due diligence
Listing remarks MLS
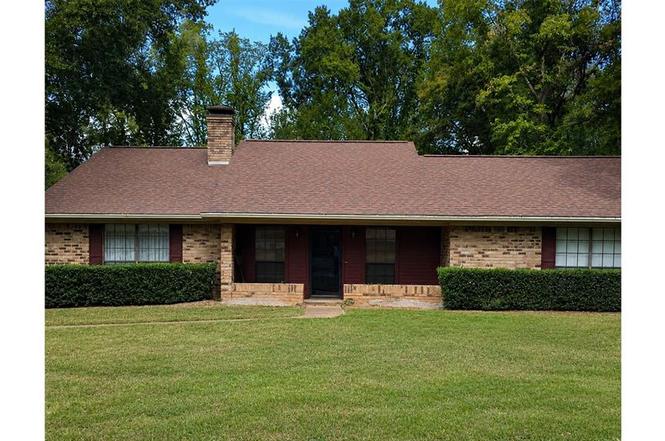
Move in Ready! Come see this 2/2.5 home located on 1-1/2 lots (. 52 acre) The front door opens into a large family room with a beautiful petrified wood fireplace and a large built-in bookcase / glass gun cabinet. The spacious kitchen has an island and is open into the dining area. One of the bathrooms is in the laundry room which is handily located just inside the back door. Out back there is a pretty yard, large, secluded back porch and a detached garage with covered walkway.
Key facts
- 0.53 acre lot
- 2 garage spots
- Built 1983
Property features AI
Finance
- Other: Property listed for sale; Possession 30–60 days or at closing/funding
- Financial info: Accepts Cash, Conventional, FHA, and VA financing; No second mortgage
- HOA & community: No homeowners association
Exterior
- Parking: Attached garage with 2 covered spaces; 2-car carport
- Utilities: City water; City sewer; Other utilities; Not in a municipal utility district
- Home design: Single-family residence; Residential property; Built in 1983
- Construction: Composition roof
- Exterior features: Subdivision lot
Interior
- Kitchen: Other appliances
- Bedrooms: 2 bedrooms (primary bedroom on main level)
- Bathrooms: 2 full bathrooms
- Heating & cooling: Central heating (electric); Central air conditioning; Ceiling fan(s)
- Interior features: One-level home; Living area of 1668; One living area; One dining area; 3 total rooms; Other interior features
- Laundry & utility: No specific laundry details provided
Neighborhood map
What this means for you Summary
Snapshot
- This is a 2-bed/2.0-bath single-family listed at $145k.
Deal economics
- At list price, monthly cash flow is $-49 ($-589/yr) — negative.
- To cash-flow at today's rent, offer at most $136k (6.0% below list).
- To meet the 1% rule (rent ≥ 1% of price), the offer needs to be $130k (10.3% below list).
- Recommended offer: $130k (10.3% below list) — sets the bar for 1% rule.
- Cap rate 5.9% vs local median 3.2% in Crockett — top-decile yield for the area; either an underpriced asset or a hidden risk that comps aren't pricing in. Stress-test before assuming the spread holds.
Location & tenants
- Location reads 61/100 on livability (#1,005 in TX) — a middle-class / working-renter tenant base. Strengths: cost of living A+, housing A, crime B+; Watch: amenities F, commute F, employment F.
- Crockett ISD (town): math 22% / reading 28% proficiency, ranked #736 of 826 in TX (top 89%) — low school quality limits family demand, transient renter base, plan for 1-2y turnover; 78% free/reduced lunch — lower-income household profile, screen leases tightly.
- Zoned schools: Crockett El (math 18% / reading 21%, grade F, #3,583 of 4,322 statewide, top 86%, 399 students, 92% FRL).
- Market conditions: 277 active listings in the ZIP; 1 comparable units currently listed for rent nearby; 3 units permitted in Houston County in 2024 (0 in 5+ unit buildings).
Forward outlook
- Local home prices are declining (-3.0%/yr); year-one equity from $1k of loan paydown is wiped out by about $4k of value loss. Plan a longer hold.
- Houston County population projected at -16% by 2050 — secular population decline; favor cash flow + early exit over multi-decade hold.
Negotiation context
- Only 1 days on market — expect competitive offers; lowballing is unlikely to land.
- 2 sale attempts since 10y ago with the ask held roughly flat each time — persistent listings suggest the price (not the market) is what's stuck; bring a comps-based counter.
Risks & watch-outs
- Climate carrying-cost: severe wind risk, 80% chance of damaging wind over 30y; extreme-heat days projected 7→24/yr by 2055 (HVAC capex compounding) — expect insurance premiums to compound above CPI over the hold.
Questions for the listing agent
- What do current leases actually rent for vs. the listed asking? Can we see a recent rent roll and the last 12 months of T-12 income?
- Is there a deadline driving the sale (1031 exchange, divorce, estate, relocation)? That informs how much negotiation room exists.
- Schools are F-rated, which usually means shorter tenancies and higher turnover. Who's the typical renter profile here, and what's been the actual vacancy rate?
- The area grade is low — what's the realistic commute time and amenity access for the typical tenant pool here? Any planned neighborhood developments (good or bad) we should know about?
- What's the average days-on-market for RENTAL listings here right now (not sales)? A rising rental-DOM trend means longer vacancies and softer asking-rent achievability than the comps imply.
- What's the recent tenant-quality profile in this submarket — average credit score on applications, eviction rate, late-payment / NSF rate, and stable-employment percentage? A property-management company in the area should have these aggregated.
- How much new for-sale + rental construction is in the pipeline within 1–3 miles? Heavy new supply typically softens prices + rents 12–24 months out; constrained supply supports both.
Investment metrics
- 1% rule
- 0.90% ✗
- Cap rate
- 5.89%
- Cash-on-cash
- -1.45%
- DSCR
- 0.94
- GRM
- 9.3
CMA / ARV
- ARV (on-the-fly)
- $181,812
- Comps found
- 9
Show comp detail 9 sales within ~0.75 mi
| Address | Dist | Beds/Ba | Sqft | Sold | Price | $/sf | Match |
|---|---|---|---|---|---|---|---|
| 105 Mclean Dr | 0.34mi | 3/2.0 (+1) | 1,610 (-4%) | 1mo | $319,000 | $198 | 73 |
| 106 Rosewood Dr | 0.14mi | 3/2.0 (+1) | 1,422 (-15%) | 3mo | $229,000 | $161 | 61 |
| 210 Cordell Dr | 0.30mi | 3/2.0 (+1) | 1,566 (-6%) | 15mo | $139,000 | $89 | 58 |
| 233 Woodland Cir | 0.10mi | 3/2.0 (+1) | 1,460 (-12%) | 17mo | $225,000 | $154 | 55 |
| 1406 E Houston Ave | 0.27mi | 3/1.5 (+1) | 1,797 (+8%) | 16mo | $195,500 | $109 | 54 |
| 301 Harold St | 0.61mi | 3/2.0 (+1) | 1,803 (+8%) | 3mo | $159,000 | $88 | 50 |
| 408 Harold St | 0.54mi | 2/1.0 | 1,509 (-10%) | 5mo | $119,000 | $79 | 50 |
| 219 Cordell Dr | 0.27mi | 3/2.0 (+1) | 1,483 (-11%) | 17mo | $189,500 | $128 | 50 |
| 105 El Camino Dr | 0.22mi | 3/2.0 (+1) | 1,462 (-12%) | 23mo | $159,000 | $109 | 45 |
Match score weights: distance 35% · size 25% · config 20% · recency 20%. Top-matched comps best support the ARV.
Projected returns pro-forma
-3.0% appreciation · 3.0% rent growth · sell at horizon
- IRR
- -18.6%
- Equity multiple
- 0.35×
- Total profit
- $-26,557
- Equity at exit
- $21,620
- IRR
- -11.0%
- Equity multiple
- 0.34×
- Total profit
- $-26,886
- Equity at exit
- $12,537
Cash invested: $40,600 (down + closing). Projections, not guarantees.
Landlord ↔ Tenant lean methodology
- Overall (STATE)
- 87 Strongly Landlord-Friendly
- State Texas
- 87 Strongly Landlord-Friendly · R+5
- County
- — inherits STATE
- City
- — inherits STATE
ZIP-level market 75835
- Home prices YoY
- -15.8%
- Active inventory
- 277
- Price-to-rent
- 9.3×
Monthly cashflow live
- Estimated rent
- $1,300 medium interval (Pro) →
- Mortgage (P&I)
- −$760
- Tax from tax record
- −$255 /mo · $3,063/yr
- Insurance
- −$60
- HOA
- −$0
- Vacancy / Maint / Mgmt
- −$273
- Net cashflow
- $-49
Break-even live
UW: 25.0% down · 7.5% · 30yr · 1.5% tax · 5.0% vac · 8.0% maint · 8.0% mgmt
Financing live
Cash to close
- Down payment
- $36,250
- Closing costs
- $4,350
- Reserves months
- —
- Total cash needed
- —
Loan-product check · same deal, 3 products live
Conventional
25% down · 7.5% · 30yr
- Down + closing
- —
- Monthly P&I
- —
- Monthly cashflow
- —
- DSCR
- —
- Eligible?
- —
Personal DTI + credit; lowest rate.
DSCR
20% down · 8.5% · 30yr
- Down + closing
- —
- Monthly P&I
- —
- Monthly cashflow
- —
- DSCR
- —
- Eligible?
- —
No personal income docs; deal must DSCR.
Hard money
10% down · 12.0% · 12mo
- Down + closing
- —
- Monthly P&I
- —
- Monthly cashflow
- —
- DSCR
- —
- Eligible?
- —
Short-term bridge; refi at stabilization.
Rent comps 1 comps
| Address | Beds | Baths | Sqft | Rent | $/sqft | DOM | Units | Dist |
|---|---|---|---|---|---|---|---|---|
| 2109 E Goliad Ave Crockett, TX | 2.0 | 1.0 | 1348 | $1,300 | $0.96 | 43d | 1 | 1.23mi |
Listing history 2 events
-
2026-06-18remarks 587-char remark
-
2026-06-18$145,000 Active 1 DOM
ⓘ Source: listings_history table (triggers on properties + properties_extension) + one-shot
backfill from property_details.listing_events for pre-trigger history.
Tax reassessment forecast TX · Resets to sale price
- Current annual tax
- $3,063 · $255/mo
- Projected year-2 tax
- $3,063 · $255/mo
- Expected delta
- $0/yr ($0/mo · 0.0%)
ⓘ Screening estimate from a state-policy table — verify with the county assessor before closing.
Climate risk First Street
- Flood 1/10 Low FEMA zone X (unshaded) · 0% chance over 30 yrs
- Wildfire 4/10 Moderate
- Heat 8/10 Severe 7 d/yr ≥110°F today · 24 d/yr by 30 yrs out
- Wind 8/10 Severe 80% chance of damaging wind over 30 yrs
- Air quality 1/10 Low 0 unhealthy d/yr today · 0 by 30 yrs out
Nearby sold comps map
Loading sold comps map…
Walkable amenities ~0.75 mi
Loading nearby amenities…
Taxation est. · year 1
- Rental income
- $15,600
- − Mortgage interest
- −$8,122
- − Property taxes
- −$3,063
- − Insurance
- −$725
- − Repairs & maintenance
- −$1,248
- − Management
- −$1,248
- − Depreciation
- −$4,218
- Taxable loss
- −$3,025
- Est. tax savings @ 24.0%
- +$726
- After-tax cash flow
- $137/yr
For passive investors: Depreciation is non-cash, so a rental often shows a tax loss while cash-flowing — sheltering income. Rental losses are passive: they offset passive income freely, and up to $25,000/yr can offset ordinary (W-2) income if you actively participate and your MAGI is under $100k (phasing out to $0 by $150k); unused losses carry forward. On sale, claimed depreciation is recaptured at up to 25%, and gains may owe capital-gains tax (a 1031 exchange can defer both). Figures are a year-1 estimate at your 24.0% rate — not tax advice; consult a CPA.
Schools (NCES district)
- District
- Crockett ISD
- NCES district ID
- 4815720
- Math proficiency
- 22% ▬ 0.00%
- Reading proficiency
- 28% ▲ 1.00%
- Median HH income
- $26,917
- Composite
- 19.83/100
- National rank
- #8699
- State rank
- #736 of 826 in TX
Livability — Crockett
- Score
- 61/100
- State rank
- #1005
- US rank
- #17855
Category grades
Schools grade is shown separately in the Schools card above.
Census & demographics
- Census place
- Crockett, TX
- Population (ZIP)
- 11,805
Population outlook (Houston County) Hauer SSP2
- Today (2025)
- 21,269 people
- By 2030
- 20,568 · -3.3%
- By 2040
- 19,255 · -9.5%
- By 2050
- 17,980 · -15.5%
- By 2075
- 15,214 · -28.5%
- By 2100
- 11,720 · -44.9%
Race, ethnicity, and origin ACS 2023
- Neighborhood character
- Diverse neighborhood (Simpson 0.61)
- Race & ethnicity
- White 55% Black 25% Hispanic / Latino 17% Two or more races 9%
- Hispanic origin (detail)
- Mexican 15%
- Common ancestry
- Lithuanian 3% Romanian 1% Slovak 1%
- Foreign-born
- 4% · Canada
- Languages at home
- 89% English-only · Spanish 10%
Political lean MEDSL · Houston
- 2024 margin
- Solid R (+55.4) · D 22.1% · R 77.4%
- 2008→2024 swing
- -18.1pp toward R · 2008: -37.3pp · 2024: -55.4pp
- All cycles
- 2024: R+55.4 2020: R+50.3 2016: R+50.9 2012: R+44.3 2008: R+37.3
Not yet ingested
- Civics
- —
Market trends
- HPI YoY
- ▼ -28.03%
- Current HPI
- 149.4937
- Rent YoY
- —
- Metro
- —
- State GDP YoY
- ▲ 3.95%
- F500 in state
- 110
Industry mix (Fortune 500 HQ in TX)
| Industry | F500 HQs | Revenue |
|---|---|---|
| Energy | 16 | $1,198B |
|
||
| Technology | 5 | $198B |
|
||
| Engineering / Construction | 4 | $72B |
|
||
| Energy Services | 3 | $60B |
|
||
| Utilities | 3 | $41B |
|
||
| Healthcare | 2 | $330B |
|
||
Price history
+16.1% since first listed5 events — show timeline
- 2026-06-18 Listed $145,000 NTREIS
- 2018-01-26 Sold (Public Records) — Public Records
- 2018-01-26 Sold (MLS) — HARMLS
- 2018-01-17 Listing Removed — HARMLS
- 2016-10-17 Listed $124,900 HARMLS
Property tax history
+1.9%/yrLatest (2025): $3,063 · +10.1% YoY. Source: county tax records.
Cash-flow waterfall
monthlySold comps — $/sqft
last 12 mo · ≤1 miLoading sold comps…