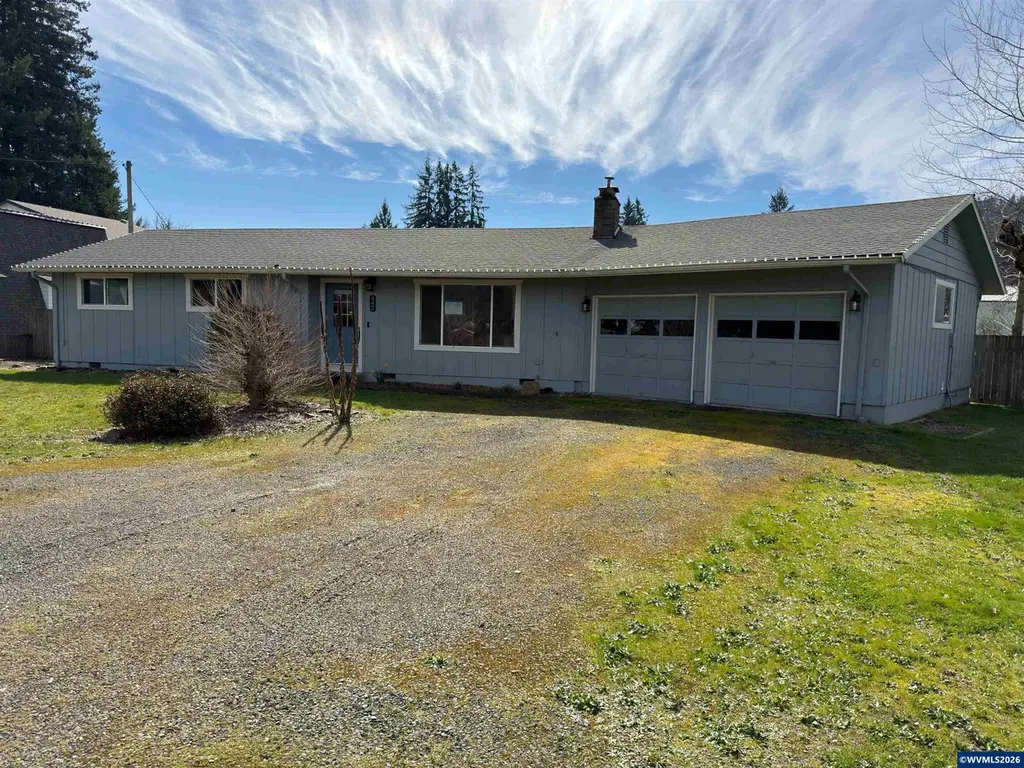
442 Cedar St · Lyons, OR
Flood risk 1/10 · Minimal
- FEMA flood zone
- X (unshaded)
- Chance of flooding over 30 yrs
- 0.0%
- Est. flood insurance / yr
- $507 – $1,088
Fire risk 5/10 · Moderate
- Est. fire insurance / yr
- $498 – $926
Heat risk 3/10 · Minor
- Hot days now (above 89°F)
- 8 days/yr
- Hot days in 30 yrs
- 18 days/yr
Wind risk 1/10 · Minimal
- Chance of severe wind over 30 yrs
- —
Air-quality risk 10/10 · Severe
- Unhealthy air days now
- 12 days/yr
- Unhealthy air days in 30 yrs
- 13 days/yr
Risk factors via First Street. Map © Google.
Why this score? — see what drove the D- grade
The composite is a weighted blend of 9 inputs, each scored 0–100. Each bar is that input's sub-score; the figure is the points it added to the 100-point composite (weight × sub-score).
- ARV discount +15.0/15.0
- Schools +6.4/10.0
- Cash flow +6.3/30.0
- Livability +3.4/5.0
- Rent growth +2.5/5.0
- Condition / age +2.5/5.0
- 1% rule +0.7/10.0
- DSCR +0.6/10.0
- Appreciation +0.0/10.0
$376,200
🖨 Deal sheet (PDF) 📄 Offer letter ✓ Due diligence
Listing remarks MLS
One of a kind home located in the heart of Lyons. Spacious lot, partially fenced w/ room for RV parking & oversized garage. Good condition w/updates throughout. Open family room features fireplace and flows nicely to dining area & kitchen. Ample storage & counterspace. Primary bedroom boasts private bath & doors to exterior. Spacious deck for outdoor activities & summer entertaining with firepit & hot tub. Plenty of space for gardening & chicken run comlplete the country feel. Gas, forced air.
Key facts
- Features fireplace
- Open family room
- Room for rv parking
Tags
Neighborhood map
What this means for you Summary
Snapshot
- This is a 3-bed/2.0-bath single-family listed at $376k.
Deal economics
- At list price, monthly cash flow is $-673 ($-8k/yr) — negative.
- To cash-flow at today's rent, offer at most $257k (31.6% below list).
- To meet the 1% rule (rent ≥ 1% of price), the offer needs to be $214k (43.1% below list).
- Recommended offer: $214k (43.1% below list) — sets the bar for 1% rule.
Location & tenants
- Location reads 67/100 on livability (#176 in OR) — a middle-class / working-renter tenant base. Strengths: crime A+, housing A+, cost of living B; Watch: health & safety D+, amenities F, commute F.
- North Santiam SD 29J (town): math 75% / reading 75% proficiency, ranked #1 of 58 in OR (top 2%) — strong family-tenant draw, lease renewals of 3-5y typical.
- Zoned schools: Mari-Linn Elementary School (184 students, 70% FRL); Stayton Middle School (450 students, 71% FRL); Stayton High School (697 students, 53% FRL) — zoned schools average 65% FRL vs 46% district-wide (18 pts higher); higher-poverty schools than district average — tighter screening recommended.
- Market conditions: 35 active listings in the ZIP; 311 units permitted in Linn County in 2024 (60 in 5+ unit buildings).
Forward outlook
- Local home prices are declining (-3.0%/yr); year-one equity from $3k of loan paydown is wiped out by about $11k of value loss. Plan a longer hold.
- Linn County population projected at +5% by 2050 — modest demand growth; plan on rents tracking national, not racing it.
Negotiation context
- It's been on market 75 days — a 6% lower offer ($354k) is reasonable based on typical stale-listing flexibility.
- 6 sale attempts since 18y ago; this cycle's ask has dropped $42k (10%) from the opening price — seller is motivated, your offer sets the floor, not the list.
Risks & watch-outs
- Climate carrying-cost: moderate wildfire risk — expect insurance premiums to compound above CPI over the hold.
Questions for the listing agent
- What do current leases actually rent for vs. the listed asking? Can we see a recent rent roll and the last 12 months of T-12 income?
- It's been on market 75 days. Have you received any prior offers? Is the seller open to a 43% concession, seller financing, or rate buy-down credit?
- Built in 1961 — when were the roof, HVAC, electrical panel, plumbing, and water heater last replaced?
- Why hasn't it sold? Are there any deal-killer items the seller is aware of (foundation, flood, title, zoning, code violations)?
- Is there a deadline driving the sale (1031 exchange, divorce, estate, relocation)? That informs how much negotiation room exists.
- Schools are D-rated, which usually means shorter tenancies and higher turnover. Who's the typical renter profile here, and what's been the actual vacancy rate?
- The area grade is low — what's the realistic commute time and amenity access for the typical tenant pool here? Any planned neighborhood developments (good or bad) we should know about?
- What's the average days-on-market for RENTAL listings here right now (not sales)? A rising rental-DOM trend means longer vacancies and softer asking-rent achievability than the comps imply.
- What's the recent tenant-quality profile in this submarket — average credit score on applications, eviction rate, late-payment / NSF rate, and stable-employment percentage? A property-management company in the area should have these aggregated.
- How much new for-sale + rental construction is in the pipeline within 1–3 miles? Heavy new supply typically softens prices + rents 12–24 months out; constrained supply supports both.
Investment metrics
- 1% rule
- 0.57% ✗
- Cap rate
- 4.15%
- Cash-on-cash
- -7.66%
- DSCR
- 0.66
- GRM
- 14.7
CMA / ARV
- ARV (median comp)
- $451,514
- List price
- $376,200
- Delta
- -16.68%
- Verdict
- UNDERPRICED
- Comps
- 20 within 1.0 mi
Show comp detail 12 sales within ~0.75 mi
| Address | Dist | Beds/Ba | Sqft | Sold | Price | $/sf | Match |
|---|---|---|---|---|---|---|---|
| 423 Ash Ln | 0.11mi | 3/2.0 | 1,616 (+3%) | 19mo | $525,000 | $325 | 74 |
| 640 Holley Ct | 0.37mi | 3/2.0 | 1,568 (0%) | 20mo | $540,000 | $344 | 66 |
| 433 N 14th St | 0.50mi | 3/2.0 | 1,448 (-8%) | 1mo | $365,000 | $252 | 63 |
| 396 Hickory Ct | 0.37mi | 3/2.0 | 1,442 (-8%) | 8mo | $450,000 | $312 | 63 |
| 201 Ironwood Ct | 0.52mi | 2/2.0 (-1) | 1,557 (-1%) | 10mo | $600,000 | $385 | 61 |
| 243 Cedar St | 0.17mi | 3/2.0 | 1,340 (-14%) | 9mo | $456,000 | $340 | 60 |
| 435 14th St | 0.50mi | 2/2.0 (-1) | 1,450 (-8%) | 3mo | $435,000 | $300 | 57 |
| 860 6th St | 0.34mi | 3/2.0 | 1,724 (+10%) | 15mo | $586,000 | $340 | 55 |
| 526 N Th St | 0.23mi | 3/1.5 | 1,338 (-15%) | 10mo | $455,000 | $340 | 54 |
| 628 13th St | 0.50mi | 2/2.0 (-1) | 1,408 (-10%) | 1mo | $500,000 | $355 | 54 |
| 870 6th St | 0.36mi | 3/2.0 | 1,731 (+10%) | 22mo | $575,340 | $332 | 48 |
| 203 Ironwood Ct | 0.53mi | 3/2.0 | 1,360 (-13%) | 21mo | $459,900 | $338 | 36 |
Match score weights: distance 35% · size 25% · config 20% · recency 20%. Top-matched comps best support the ARV.
Projected returns pro-forma
-3.0% appreciation · 3.0% rent growth · sell at horizon
- IRR
- -29.8%
- Equity multiple
- 0.01×
- Total profit
- $-103,912
- Equity at exit
- $56,093
- IRR
- -31.0%
- Equity multiple
- -0.39×
- Total profit
- $-146,105
- Equity at exit
- $32,527
Cash invested: $105,336 (down + closing). Projections, not guarantees.
Landlord ↔ Tenant lean methodology
- Overall (STATE)
- 28 Tenant-Leaning
- State Oregon
- 28 Tenant-Leaning · D+6
- County
- — inherits STATE
- City
- — inherits STATE
ZIP-level market 97358
- Active inventory
- 35
- Price-to-rent
- 14.7×
Monthly cashflow live
- Estimated rent
- $2,140 medium interval (Pro) →
- Mortgage (P&I)
- −$1,973
- Tax from tax record
- −$233 /mo · $2,801/yr
- Insurance
- −$157
- HOA
- −$0
- Lot rent
- −$0
- Vacancy / Maint / Mgmt
- −$449
- Net cashflow
- $-673
Break-even live
Sensitivity live
| Price | -10% $-460 | -5% $-566 | +0% $-673 | +5% $-779 | +10% $-886 |
|---|---|---|---|---|---|
| Rent | -10% $-842 | -5% $-757 | +0% $-673 | +5% $-588 | +10% $-504 |
| Rate | -1.0pp $-483 | -0.5pp $-577 | base $-673 | +0.5pp $-770 | +1.0pp $-869 |
UW: 25.0% down · 7.5% · 30yr · 1.5% tax · 5.0% vac · 8.0% maint · 8.0% mgmt
Financing live
Cash to close
- Down payment
- $94,050
- Closing costs
- $11,286
- Reserves months
- —
- Total cash needed
- —
Loan-product check · same deal, 3 products live
Conventional
25% down · 7.5% · 30yr
- Down + closing
- —
- Monthly P&I
- —
- Monthly cashflow
- —
- DSCR
- —
- Eligible?
- —
Personal DTI + credit; lowest rate.
DSCR
20% down · 8.5% · 30yr
- Down + closing
- —
- Monthly P&I
- —
- Monthly cashflow
- —
- DSCR
- —
- Eligible?
- —
No personal income docs; deal must DSCR.
Hard money
10% down · 12.0% · 12mo
- Down + closing
- —
- Monthly P&I
- —
- Monthly cashflow
- —
- DSCR
- —
- Eligible?
- —
Short-term bridge; refi at stabilization.
Listing history 37 events
-
2026-06-23days on market $376,200 Active 75 DOM
-
2026-06-21days on market $376,200 Active 74 DOM
-
2026-06-18days on market $376,200 Active 71 DOM
-
2026-06-17days on market $376,200 Active 70 DOM
-
2026-06-16days on market $376,200 Active 69 DOM
-
2026-06-15days on market $376,200 Active 68 DOM
-
2026-06-14days on market $376,200 Active 66 DOM
-
2026-06-10days on market $376,200 Active 63 DOM
-
2026-06-09days on market $376,200 Active 62 DOM
-
2026-06-08days on market $376,200 Active 61 DOM
-
2026-06-07days on market $376,200 Active 60 DOM
-
2026-06-03days on market $376,200 Active 56 DOM
-
2026-06-02days on market $376,200 Active 55 DOM
-
2026-06-01days on market $376,200 Active 54 DOM
-
2026-05-31days on market $376,200 Active 53 DOM
-
2026-05-30days on market $376,200 Active 52 DOM
-
2026-04-06$418,000 Active 527-char remark
Show marketing remark (527 chars)
One of a kind home located in the heart of Lyons. Spacious lot, partially fenced w/ room for RV parking & oversized garage. Good condition w/updates throughout. Open family room features fireplace and flows nicely to dining area & kitchen. Ample storage & counterspace. Primary bedroom boasts private bath & doors to exterior. Spacious deck for outdoor activities & summer entertaining with firepit & hot tub. Plenty of space for gardening & chicken run comlplete the country feel. Gas, forced air.
-
2025-09-18historical
-
2025-08-01historical Active under Contract
-
2025-07-18price $415,000
-
2025-05-16price $425,000
-
2025-04-26$449,900 Active
-
2022-10-26soldstatus $424,000 Sold
-
2022-10-26soldstatus $424,000
-
2022-09-07historical Active under Contract
-
2022-08-27price $414,000
-
2022-08-09$429,000 Active
-
2020-06-05soldstatus $291,000 Sold
-
2020-06-05soldstatus $291,000
-
2020-05-01historical Active under Contract
-
2020-01-27$315,000 Active
-
2013-11-25historical
-
2013-10-23$220,000 Active
-
2010-04-05soldstatus $209,200
-
2009-04-27historical
-
2008-04-29$229,000
-
1991-05-10soldstatus $45,700
ⓘ Source: listings_history table (triggers on properties + properties_extension) + one-shot
backfill from property_details.listing_events for pre-trigger history.
Tax reassessment forecast OR · Resets to sale price
- Current annual tax
- $2,801 · $233/mo
- Projected year-2 tax
- $3,649 · $304/mo
- Expected delta
- +$849/yr (+$71/mo · 30.3%)
ⓘ Screening estimate from a state-policy table — verify with the county assessor before closing.
Climate risk First Street
- Flood 1/10 Low FEMA zone X (unshaded) · 0% chance over 30 yrs
- Wildfire 5/10 Major
- Heat 3/10 Moderate 8 d/yr ≥89°F today · 18 d/yr by 30 yrs out
- Wind 1/10 Low
- Air quality 10/10 Extreme 12 unhealthy d/yr today · 13 by 30 yrs out
Nearby sold comps map
Loading sold comps map…
Walkable amenities ~0.75 mi
Loading nearby amenities…
Taxation est. · year 1
- Rental income
- $25,677
- − Mortgage interest
- −$21,073
- − Property taxes
- −$2,801
- − Insurance
- −$1,881
- − Repairs & maintenance
- −$2,054
- − Management
- −$2,054
- − Depreciation
- −$10,944
- Taxable loss
- −$15,130
- Est. tax savings @ 24.0%
- +$3,631
- After-tax cash flow
- $-4,440/yr
For passive investors: Depreciation is non-cash, so a rental often shows a tax loss while cash-flowing — sheltering income. Rental losses are passive: they offset passive income freely, and up to $25,000/yr can offset ordinary (W-2) income if you actively participate and your MAGI is under $100k (phasing out to $0 by $150k); unused losses carry forward. On sale, claimed depreciation is recaptured at up to 25%, and gains may owe capital-gains tax (a 1031 exchange can defer both). Figures are a year-1 estimate at your 24.0% rate — not tax advice; consult a CPA.
Schools (NCES district)
- District
- North Santiam SD 29J
- NCES district ID
- 4100020
- Math proficiency
- 75% ▲ 37.00%
- Reading proficiency
- 75% ▲ 18.00%
- Median HH income
- $54,619
- Composite
- 63.96/100
- National rank
- #584
- State rank
- #1 of 58 in OR
Livability — Lyons
- Score
- 67/100
- State rank
- #176
- US rank
- #10624
Category grades
Schools grade is shown separately in the Schools card above.
Census & demographics
- Census place
- Lyons, OR
- Population (ZIP)
- 2,502
Population outlook (Linn County) Hauer SSP2
- Today (2025)
- 127,026 people
- By 2030
- 129,540 · +2.0%
- By 2040
- 132,780 · +4.5%
- By 2050
- 133,614 · +5.2%
- By 2075
- 129,061 · +1.6%
- By 2100
- 112,224 · -11.7%
Race, ethnicity, and origin ACS 2023
- Neighborhood character
- Predominantly White (88%)
- Race & ethnicity
- White 88% Two or more races 8% Hispanic / Latino 4%
- Common ancestry
- Slovak 5% Lithuanian 3% Iranian 3%
- Foreign-born
- 2% · China, Canada
- Languages at home
- 97% English-only · Spanish 1% Chinese 1%
Political lean MEDSL · Linn
- 2024 margin
- Strong R (+24.4) · D 36.2% · R 60.6% · Other 3.1%
- 2008→2024 swing
- -13.0pp toward R · 2008: -11.4pp · 2024: -24.4pp
- All cycles
- 2024: R+24.4 2020: R+23.4 2016: R+27.8 2012: R+17.2 2008: R+11.4
Not yet ingested
- Civics
- —
Market trends
- HPI YoY
- ▼ -196.89%
- Current HPI
- 219.0268
- Rent YoY
- —
- Metro
- —
- State GDP YoY
- ▲ 2.05%
- F500 in state
- 2
Industry mix (Fortune 500 HQ in OR)
| Industry | F500 HQs | Revenue |
|---|---|---|
| Consumer Goods | 1 | $51B |
|
||
Price history
+814.7% since first listed21 events — show timeline
- 2026-04-06 Listed $418,000 WVMLS
- 2025-09-18 Listing Removed — WVMLS
- 2025-08-01 Contingent — WVMLS
- 2025-07-18 Price Changed $415,000 WVMLS
- 2025-05-16 Price Changed $425,000 WVMLS
- 2025-04-26 Listed $449,900 WVMLS
- 2022-10-26 Sold (Public Records) $424,000 Public Records
- 2022-10-26 Sold (MLS) $424,000 WVMLS
- 2022-09-07 Contingent — WVMLS
- 2022-08-27 Price Changed $414,000 WVMLS
- 2022-08-09 Listed $429,000 WVMLS
- 2020-06-05 Sold (Public Records) $291,000 Public Records
- 2020-06-05 Sold (MLS) $291,000 WVMLS
- 2020-05-01 Contingent — WVMLS
- 2020-01-27 Listed $315,000 WVMLS
- 2013-11-25 Listing Removed — WVMLS
- 2013-10-23 Listed $220,000 WVMLS
- 2010-04-05 Sold (Public Records) $209,200 Public Records
- 2009-04-27 Listing Removed — WVMLS
- 2008-04-29 Listed $229,000 WVMLS
- 1991-05-10 Sold (Public Records) $45,700 Public Records
Property tax history
+2.5%/yrLatest (2025): $2,801 · +3.3% YoY. Source: county tax records.
Cash-flow waterfall
monthlySold comps — $/sqft
last 12 mo · ≤1 miLoading sold comps…