 Duplex
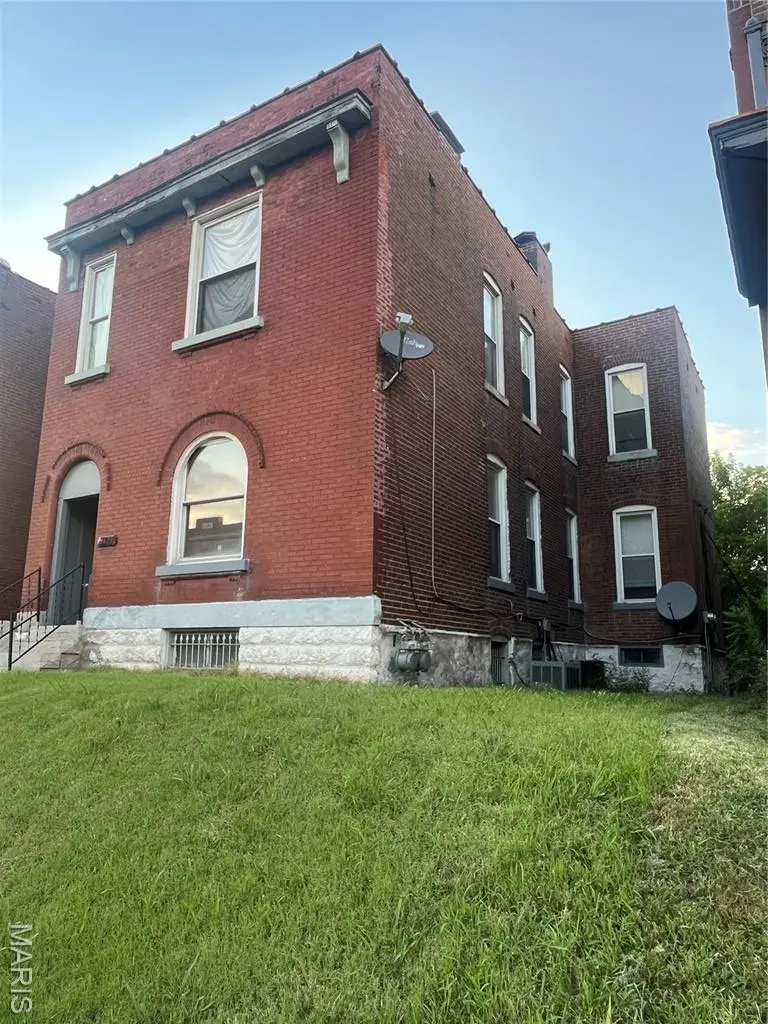
3423 Keokuk · St. Louis, MO
Flood risk 1/10 · Minimal
- FEMA flood zone
- X (unshaded)
- Chance of flooding over 30 yrs
- 0.0%
- Est. flood insurance / yr
- $473 – $860
Fire risk 1/10 · Minimal
- Est. fire insurance / yr
- $1,054 – $1,958
Heat risk 5/10 · Moderate
- Hot days now (above 108°F)
- 7 days/yr
- Hot days in 30 yrs
- 21 days/yr
Wind risk 2/10 · Minimal
- Chance of severe wind over 30 yrs
- 1.0%
Air-quality risk 3/10 · Minor
- Unhealthy air days now
- 3 days/yr
- Unhealthy air days in 30 yrs
- 4 days/yr
Risk factors via First Street. Map © Google.
Why this score? — see what drove the C- grade
The composite is a weighted blend of 9 inputs, each scored 0–100. Each bar is that input's sub-score; the figure is the points it added to the 100-point composite (weight × sub-score).
- Cash flow +27.8/30.0
- DSCR +9.8/10.0
- 1% rule +6.5/10.0
- Rent growth +3.7/5.0
- Livability +2.5/5.0
- Condition / age +2.5/5.0
- Schools +1.2/10.0
- ARV discount +0.0/15.0
- Appreciation +0.0/10.0
$199,000
🖨 Deal sheet 📄 Offer letter ✓ Due diligence
Multi-family units
County records classify this as Multi-Family (2-4 Unit). Listing-text estimate: 2 units. confirmed
Listing remarks MLS
Great 2-Family available in South City with major potential for a serious investor. Property to be sold in as in condition. Seller to make no repairs or provide any inspections. Earnest Money and proof of funds to be submitted with all offers. Buyer must close with sellers Title Co.
Key facts
- 4,791 sq ft lot
- 2 garage spots
- Built 1895
Neighborhood map
What this means for you Summary
Snapshot
- This is a 2 × 2-bed/1.5-bath units multifamily listed at $199k.
Deal economics
- At list price, monthly cash flow is $604 ($7k/yr) — positive. Per door: $302/mo.
- The deal already cash-flows at list — no discount required.
- Meets the 1% rule at list price ($2k rent vs $199k).
- Recommended offer: $175k (12.0% below list) — sets the bar for market timing.
- Cap rate 9.9% vs local median 5.0% in St. Louis — top-decile yield for the area; either an underpriced asset or a hidden risk that comps aren't pricing in. Stress-test before assuming the spread holds.
Location & tenants
- Location reads: area grade C — affects rentability + tenant quality, not the cash-flow math above.
- St. Louis City (urban): math 10% / reading 18% proficiency, ranked #312 of 324 in MO (top 96%) — low school quality limits family demand, transient renter base, plan for 1-2y turnover; 80% free/reduced lunch — lower-income household profile, screen leases tightly.
- Market conditions: Rents rising fast (+4.9%/yr); 240 active listings in the ZIP; 10 comparable units currently listed for rent nearby; rentals at typical pace (median 16d on market — plan ~3-4 weeks tenant-placement turnaround); 40% of comp listings sitting > 30 days — soft ceiling on asking rent; 294 units permitted in St. Louis city in 2024 (227 in 5+ unit buildings).
- At $2,292/mo this rent would consume 48% of the median local household income ($58k/yr) (locally 1495% of renters already pay >50% of income on rent) — very limited rent-growth headroom before tenants either downsize or default.
Forward outlook
- Local home prices are declining (-3.0%/yr); year-one equity from $1k of loan paydown is wiped out by about $6k of value loss. Plan a longer hold.
- St. Louis County population projected to shrink 6% by 2050 — rents likely to lag national; underwrite the cash flow, not the appreciation.
- At projected returns (-3.0% appreciation + 4.9% rent growth), your $56k cash investment doubles in ~8 years — after that, you're playing with house money.
Negotiation context
- It's been on market 307 days — a 12% lower offer ($175k) is reasonable based on typical stale-listing flexibility.
- 2 sale attempts since 16y ago with the ask held roughly flat each time — persistent listings suggest the price (not the market) is what's stuck; bring a comps-based counter.
- Current owner paid $65k; list at $199k implies a 206% gain — meaningful room to come down on a strong offer.
Risks & watch-outs
- Watch-outs: built in 1895 — expect roof / HVAC / electrical / plumbing capex.
- Climate carrying-cost: extreme-heat days projected 7→21/yr by 2055 (HVAC capex compounding) — expect insurance premiums to compound above CPI over the hold.
Questions for the listing agent
- It's been on market 307 days. Have you received any prior offers? Is the seller open to a 12% concession, seller financing, or rate buy-down credit?
- Can we see the unit-by-unit rent roll, current vacancy, and any below-market leases? What's the average tenancy length?
- What capital expenditures (roof, boiler, parking lot, exteriors) have been made in the last 5 years, and what's planned in the next 2?
- Built in 1895 — when were the roof, HVAC, electrical panel, plumbing, and water heater last replaced?
- Why hasn't it sold? Are there any deal-killer items the seller is aware of (foundation, flood, title, zoning, code violations)?
- Is there a deadline driving the sale (1031 exchange, divorce, estate, relocation)? That informs how much negotiation room exists.
- What's the average days-on-market for RENTAL listings here right now (not sales)? A rising rental-DOM trend means longer vacancies and softer asking-rent achievability than the comps imply.
- What's the recent tenant-quality profile in this submarket — average credit score on applications, eviction rate, late-payment / NSF rate, and stable-employment percentage? A property-management company in the area should have these aggregated.
- How much new apartment / multifamily construction is in the pipeline within 1–3 miles? Heavy new supply (>2% of stock underway) typically softens rents 12–24 months out; light construction supports rent growth.
Investment metrics
- 1% rule
- 1.15% ✓
- Cap rate
- 9.94%
- Cash-on-cash
- 13.01%
- DSCR
- 1.58
- GRM
- 7.2
CMA / ARV
- ARV (median comp)
- $168,156
- List price
- $199,000
- Delta
- 18.34%
- Verdict
- OVERPRICED
- Comps
- 20 within 1.0 mi
Show comp detail 12 sales within ~0.75 mi
| Address | Dist | Beds/Ba | Sqft | Sold | Price | $/sf | Match |
|---|---|---|---|---|---|---|---|
| 3417 Keokuk St | 0.01mi | 4/2.0 | 2,678 (-7%) | 9mo | $75,000 | $28 | 81 |
| 3829 Minnesota Ave | 0.29mi | 4/2.0 | 2,798 (-2%) | 2mo | $65,000 | $23 | 81 |
| 3614 Alberta St | 0.23mi | 4/2.0 | 2,560 (-11%) | 9mo | $145,000 | $57 | 64 |
| 3106 Chippewa St | 0.30mi | 4/2.0 | 2,490 (-13%) | 2mo | $109,900 | $44 | 62 |
| 3416 Utah St | 0.72mi | 4/2.0 | 2,700 (-6%) | 1mo | $150,000 | $56 | 56 |
| 3550 Giles Ave | 0.49mi | 5/2.0 (+1) | 2,652 (-8%) | 8mo | $249,900 | $94 | 53 |
| 3618 Pennsylvania Ave | 0.49mi | 4/2.0 | 2,522 (-12%) | 6mo | $160,000 | $63 | 52 |
| 3919-3921 Dunnica Ave | 0.61mi | 4/2.0 | 2,554 (-11%) | 3mo | $175,000 | $69 | 51 |
| 3776 Keokuk St | 0.44mi | 4/2.0 | 2,450 (-15%) | 6mo | $180,000 | $73 | 50 |
| 3733 Oregon Ave | 0.50mi | 4/4.0 | 2,480 (-14%) | 4mo | $220,000 | $89 | 43 |
| 3721 Iowa Ave | 0.63mi | 4/2.0 | 2,500 (-13%) | 8mo | $130,000 | $52 | 42 |
| 3461 South Spring Ave | 0.66mi | 4/4.0 | 3,136 (+9%) | 9mo | $314,900 | $100 | 38 |
Match score weights: distance 35% · size 25% · config 20% · recency 20%. Top-matched comps best support the ARV.
Projected returns pro-forma
-3.0% appreciation · 4.89% rent growth · sell at horizon
- IRR
- 4.8%
- Equity multiple
- 1.19×
- Total profit
- $10,612
- Equity at exit
- $29,672
- IRR
- 15.8%
- Equity multiple
- 2.39×
- Total profit
- $77,458
- Equity at exit
- $17,206
Cash invested: $55,720 (down + closing). Projections, not guarantees.
Landlord ↔ Tenant lean methodology
- Overall (STATE)
- 81 Strongly Landlord-Friendly
- State Missouri
- 81 Strongly Landlord-Friendly · R+10
- County
- — inherits STATE
- City
- — inherits STATE
ZIP-level market 63118
- Rents YoY
- 4.9%
- Active inventory
- 240
- Price-to-rent
- 14.5×
Monthly cashflow live
- Estimated rent
- $2,292 high interval (Pro) →
- Mortgage (P&I)
- −$1,044
- Tax from tax record
- −$80 /mo · $959/yr
- Insurance
- −$83
- HOA
- −$0
- Vacancy / Maint / Mgmt
- −$481
- Net cashflow
- $604
Break-even live
2-unit breakdown (identical units grouped — click to expand)
| Units | Beds | Baths | Est. rent |
|---|---|---|---|
| 2× units | 2 | 1.5 | $2,292 |
| #1 | 2 | 1.5 | $1,146 |
| #2 | 2 | 1.5 | $1,146 |
| Total (2 units) | $2,292 | ||
UW: 25.0% down · 7.5% · 30yr · 1.5% tax · 5.0% vac · 8.0% maint · 8.0% mgmt
Financing live
Cash to close
- Down payment
- $49,750
- Closing costs
- $5,970
- Reserves months
- —
- Total cash needed
- —
Loan-product check · same deal, 3 products live
Conventional
25% down · 7.5% · 30yr
- Down + closing
- —
- Monthly P&I
- —
- Monthly cashflow
- —
- DSCR
- —
- Eligible?
- —
Personal DTI + credit; lowest rate.
DSCR
20% down · 8.5% · 30yr
- Down + closing
- —
- Monthly P&I
- —
- Monthly cashflow
- —
- DSCR
- —
- Eligible?
- —
No personal income docs; deal must DSCR.
Hard money
10% down · 12.0% · 12mo
- Down + closing
- —
- Monthly P&I
- —
- Monthly cashflow
- —
- DSCR
- —
- Eligible?
- —
Short-term bridge; refi at stabilization.
Rent comps 10 comps
| Address | Beds | Baths | Sqft | Rent | $/sqft | DOM | Units | Dist |
|---|---|---|---|---|---|---|---|---|
| 4135 S Compton Ave Saint Louis, MO | 3.0 | 2.0 | 2104 | $1,600 | $0.76 | 43d | 1 | 0.35mi |
| 3526 S Spring Ave Saint Louis, MO | 4.0 | 2.0 | 2244 | $2,877 | $1.28 | 43d | 1 | 0.59mi |
| 3458 Giles Ave Saint Louis, MO | 3.0 | 2.5 | 2204 | $2,400 | $1.09 | 7d | 1 | 0.63mi |
| 3807 Potomac St Saint Louis, MO | 3.0 | 1.0 | 2588 | $1,100 | $0.43 | 43d | 1 | 0.71mi |
| 3807 Potomac St Saint Louis, MO | 3.0 | 1.0 | 2588 | $1,300 | $0.50 | 7d | 1 | 0.71mi |
| 4312 Oregon Ave Saint Louis, MO | 4.0 | 2.0 | 2032 | $2,000 | $0.98 | 1d | 1 | 0.72mi |
| 3429 Ohio Ave Saint Louis, MO | 3.0 | 3.0 | 1938 | $2,250 | $1.16 | 16d | 1 | 0.88mi |
| 3908 McDonald Ave Saint Louis, MO | 3.0 | 2.0 | 1927 | $2,500 | $1.30 | 4d | 1 | 0.89mi |
| 2643 Wyoming St Saint Louis, MO | 3.0 | 2.5 | 2592 | $2,600 | $1.00 | 43d | 1 | 1.14mi |
| 4145-4147 Hartford St St. Louis, MO | 4.0 | 3.5 | 2400 | $3,800 | $1.58 | 12d | 1 | 1.45mi |
Listing history 23 events
-
2026-06-18days on market $199,000 Active 307 DOM
-
2026-06-17days on market $199,000 Active 306 DOM
-
2026-06-16days on market $199,000 Active 305 DOM
-
2026-06-15days on market $199,000 Active 304 DOM
-
2026-06-13days on market $199,000 Active 302 DOM
-
2026-06-09days on market $199,000 Active 298 DOM
-
2026-06-08days on market $199,000 Active 297 DOM
-
2026-06-08days on market $199,000 Active 296 DOM
-
2026-06-05days on market $199,000 Active 293 DOM
-
2026-06-03days on market $199,000 Active 292 DOM
-
2026-06-02days on market $199,000 Active 291 DOM
-
2026-06-01days on market $199,000 Active 290 DOM
-
2026-06-01days on market $199,000 Active 289 DOM
-
2025-11-03price $199,000 283-char remark
Show marketing remark (283 chars)
Great 2-Family available in South City with major potential for a serious investor. Property to be sold in as in condition. Seller to make no repairs or provide any inspections. Earnest Money and proof of funds to be submitted with all offers. Buyer must close with sellers Title Co.
-
2025-08-15$209,000 Active 283-char remark
Show marketing remark (283 chars)
Great 2-Family available in South City with major potential for a serious investor. Property to be sold in as in condition. Seller to make no repairs or provide any inspections. Earnest Money and proof of funds to be submitted with all offers. Buyer must close with sellers Title Co.
-
2021-11-10soldstatus $65,000
-
2012-07-19soldstatus
-
2012-07-13soldstatus 462-char remark
Show marketing remark (462 chars)
Short Sale Approved!!!BOTTOM LINE PRICING!!!BRING US AN OFFER!!!THIS ONE IS RUNNING OUT OF TIME!!!GREAT BUILDING FOR A GREAT PRICE!!!Recently rehabbed 2 family in South St. Louis. Both apts have 2 bedrms, eat-in kitchens, ceramic flrs in kitchen and bath, beautiful hardwood flrs, newer electric hot water heaters, and newer windows. 1st flr unit has newer furnace and a/c. Property is being offered as a short sale with approval needed by lender. Offered as is.
-
2010-12-15$45,000 462-char remark
Show marketing remark (462 chars)
Short Sale Approved!!!BOTTOM LINE PRICING!!!BRING US AN OFFER!!!THIS ONE IS RUNNING OUT OF TIME!!!GREAT BUILDING FOR A GREAT PRICE!!!Recently rehabbed 2 family in South St. Louis. Both apts have 2 bedrms, eat-in kitchens, ceramic flrs in kitchen and bath, beautiful hardwood flrs, newer electric hot water heaters, and newer windows. 1st flr unit has newer furnace and a/c. Property is being offered as a short sale with approval needed by lender. Offered as is.
-
2008-12-23soldstatus $155,000
-
2006-09-05soldstatus $158,000
-
1992-10-29soldstatus
-
1989-02-01soldstatus
ⓘ Source: listings_history table (triggers on properties + properties_extension) + one-shot
backfill from property_details.listing_events for pre-trigger history.
Tax reassessment forecast MO · Resets to sale price
- Current annual tax
- $959 · $80/mo
- Projected year-2 tax
- $1,930 · $161/mo
- Expected delta
- +$971/yr (+$81/mo · 101.3%)
ⓘ Screening estimate from a state-policy table — verify with the county assessor before closing.
Climate risk First Street
- Flood 1/10 Low FEMA zone X (unshaded) · 0% chance over 30 yrs
- Wildfire 1/10 Low
- Heat 5/10 Major 7 d/yr ≥108°F today · 21 d/yr by 30 yrs out
- Wind 2/10 Low 100% chance of damaging wind over 30 yrs
- Air quality 3/10 Moderate 3 unhealthy d/yr today · 4 by 30 yrs out
Nearby sold comps map
Loading sold comps map…
Walkable amenities ~0.75 mi
Loading nearby amenities…
Taxation est. · year 1
- Rental income
- $27,504
- − Mortgage interest
- −$11,147
- − Property taxes
- −$959
- − Insurance
- −$995
- − Repairs & maintenance
- −$2,200
- − Management
- −$2,200
- − Depreciation
- −$5,789
- Taxable income
- $4,213
- Est. tax owed @ 24.0%
- −$1,011
- After-tax cash flow
- $6,240/yr
For passive investors: Depreciation is non-cash, so a rental often shows a tax loss while cash-flowing — sheltering income. Rental losses are passive: they offset passive income freely, and up to $25,000/yr can offset ordinary (W-2) income if you actively participate and your MAGI is under $100k (phasing out to $0 by $150k); unused losses carry forward. On sale, claimed depreciation is recaptured at up to 25%, and gains may owe capital-gains tax (a 1031 exchange can defer both). Figures are a year-1 estimate at your 24.0% rate — not tax advice; consult a CPA.
Schools (NCES district)
- District
- St. Louis City
- NCES district ID
- 2929280
- Math proficiency
- 10% ▼ -6.00%
- Reading proficiency
- 18% ▼ -3.00%
- Median HH income
- $35,685
- Composite
- 11.54/100
- National rank
- #9699
- State rank
- #312 of 324 in MO
Livability — St. Louis
No livability data for this city. (Only ~50 U.S. cities are tracked.)
Census & demographics
- Census place
- St. Louis, MO
- County
- Saint Louis City · 254,015 people
- City population
- 283,259
- Metro
- St. Louis, MO-IL
- Population (ZIP)
- 25,913
- Household income
- $57,762
- Rent vs Own
- Severe rent burden
- 1495.0
Population outlook (St. Louis County) Hauer SSP2
- Today (2025)
- 315,737 people
- By 2030
- 313,865 · -0.6%
- By 2040
- 305,439 · -3.3%
- By 2050
- 296,529 · -6.1%
- By 2075
- 271,028 · -14.2%
- By 2100
- 255,359 · -19.1%
Race, ethnicity, and origin ACS 2023
- Neighborhood character
- Diverse neighborhood (Simpson 0.63)
- Race & ethnicity
- White 44% Black 41% Two or more races 8% Hispanic / Latino 8% Asian 2%
- Hispanic origin (detail)
- Mexican 6%
- Common ancestry
- Slovak 2% Lithuanian 2% Romanian 2%
- Foreign-born
- 6% · Canada, Vietnam
- Languages at home
- 90% English-only · Spanish 5% Vietnamese 1% French/Haitian/Cajun 1%
Political lean MEDSL · St. Louis
- 2024 margin
- Solid D (+64.7) · D 81.4% · R 16.7% · Other 2.0%
- 2008→2024 swing
- -3.5pp toward R · 2008: 68.2pp · 2024: 64.7pp
- All cycles
- 2024: D+64.7 2020: D+66.2 2016: D+63.7 2012: D+66.6 2008: D+68.2
Not yet ingested
- Civics
- —
Market trends
- HPI YoY
- ▼ -347.51%
- Current HPI
- 171.5963
- Rent YoY
- ▲ 4.89%
- Metro
- St. Louis, MO-IL
- State GDP YoY
- ▲ 1.84%
- F500 in state
- 20
Industry mix (Fortune 500 HQ in MO)
| Industry | F500 HQs | Revenue |
|---|---|---|
| Healthcare | 1 | $163B |
|
||
| Insurance | 1 | $21B |
|
||
| Industrial Technology | 1 | $17B |
|
||
| Retail | 1 | $16B |
|
||
| Industrial Distribution | 1 | $10B |
|
||
| Utilities | 1 | $9B |
|
||
Price history
+25.9% since first listed10 events — show timeline
- 2025-11-03 Price Changed $199,000 MARIS as Distributed by MLS Grid
- 2025-08-15 Listed $209,000 MARIS as Distributed by MLS Grid
- 2021-11-10 Sold (Public Records) $65,000 Public Records
- 2012-07-19 Sold (Public Records) — Public Records
- 2012-07-13 Sold (MLS) — MARIS as Distributed by MLS Grid
- 2010-12-15 Listed $45,000 MARIS as Distributed by MLS Grid
- 2008-12-23 Sold (Public Records) $155,000 Public Records
- 2006-09-05 Sold (Public Records) $158,000 Public Records
- 1992-10-29 Sold (Public Records) — Public Records
- 1989-02-01 Sold (Public Records) — Public Records
Property tax history
+6.0%/yrLatest (2024): $959 · +5.0% YoY. Source: county tax records.
Cash-flow waterfall
monthlySold comps — $/sqft
last 12 mo · ≤1 miLoading sold comps…