2870 Riser Rd · Ruston, LA
Flood risk 1/10 · Minimal
- FEMA flood zone
- X (unshaded)
- Chance of flooding over 30 yrs
- 0.0%
- Est. flood insurance / yr
- $507 – $1,088
Fire risk 4/10 · Minor
- Est. fire insurance / yr
- $1,269 – $2,357
Heat risk 7/10 · Major
- Hot days now (above 111°F)
- 7 days/yr
- Hot days in 30 yrs
- 20 days/yr
Wind risk 6/10 · Moderate
- Chance of severe wind over 30 yrs
- 73.0%
Air-quality risk 1/10 · Minimal
- Unhealthy air days now
- 0 days/yr
- Unhealthy air days in 30 yrs
- 0 days/yr
Risk factors via First Street. Map © Google.
Why this score? — see what drove the D grade
The composite is a weighted blend of 9 inputs, each scored 0–100. Each bar is that input's sub-score; the figure is the points it added to the 100-point composite (weight × sub-score).
- Cash flow +12.7/30.0
- ARV discount +7.5/15.0
- Rent growth +4.2/5.0
- Condition / age +4.0/5.0
- DSCR +3.8/10.0
- 1% rule +3.6/10.0
- Livability +3.4/5.0
- Schools +2.3/10.0
- Appreciation +0.0/10.0
$125,000
🖨 Deal sheet (PDF) 📄 Offer letter ✓ Due diligence
Listing remarks
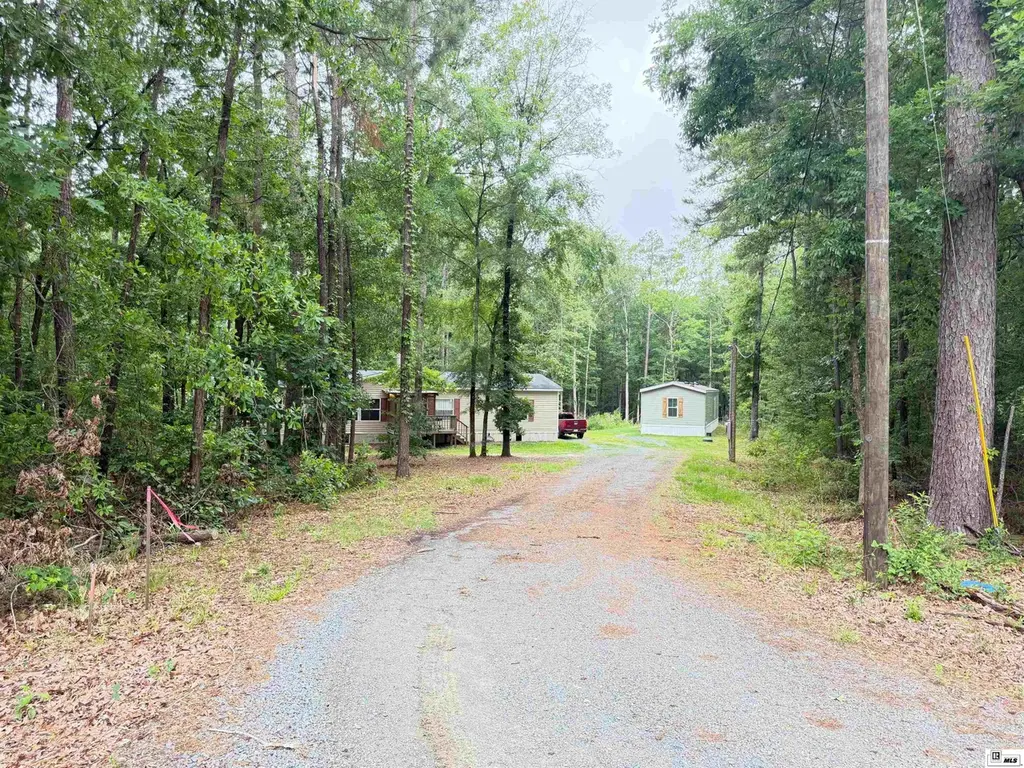
Don't miss this 2023 single wide mobile home situated on approximately 1.92 +/- acres in a peaceful setting. This 2 bedroom, 2 bath home measures approximately 14x64 and offers a comfortable open-concept layout with the living area and kitchen flowing together for easy everyday living. The split-bedroom floor plan provides added privacy, with each bedroom located on opposite ends of the home. The property is set back from the road and shares a driveway with the neighboring home, while still offering a quiet retreat where you can enjoy the outdoors and nature around you. Call a local REALTOR today to schedule your private showing!
Key facts
- Open-concept layout
- 1.92 acre lot
- Built 2023
Tags
Property features AI
Finance
- HOA & community: No association amenities
Exterior
- Parking: Open parking; Gravel parking surface
- Security: Smoke detector(s); Carbon monoxide detector(s)
- Utilities: Public water; Septic tank; Natural gas not available
- Home design: Residential mobile home (single wide); One level; Entry on level 1
- Construction: Vinyl siding; Asphalt roof; Built on crawl space
- Exterior features: Irregular lot; Paved road access; No fencing
Interior
- Kitchen: Dishwasher; Microwave; Electric range
- Bedrooms: 2 bedrooms on the main level
- Bathrooms: 2 full bathrooms (both on the main level)
- Heating & cooling: Central heating (electric); Central air conditioning (electric)
- Interior features: Walk-in closet(s); Double-pane windows; Window blinds; Crawl space basement
- Laundry & utility: Electric water heater
Neighborhood map
What this means for you Summary
Snapshot
- This is a 2-bed/2.0-bath manufactured listed at $125k. Condition is rated good.
Deal economics
- At list price, monthly cash flow is $-13 ($-160/yr) — negative.
- To cash-flow at today's rent, offer at most $123k (1.5% below list).
- To meet the 1% rule (rent ≥ 1% of price), the offer needs to be $108k (13.9% below list).
- Recommended offer: $108k (13.9% below list) — sets the bar for 1% rule.
- Cap rate 6.2% vs local median 3.2% in Ruston — top-decile yield for the area; either an underpriced asset or a hidden risk that comps aren't pricing in. Stress-test before assuming the spread holds.
Location & tenants
- Location reads 68/100 on livability (#86 in LA) — a middle-class / working-renter tenant base. Strengths: cost of living A+, health & safety A+; Watch: amenities C-, crime F, commute F.
- Jackson Parish (rural): math 25% / reading 31% proficiency, ranked #50 of 98 in LA (top 51%) — low school quality limits family demand, transient renter base, plan for 1-2y turnover.
- Zoned schools: Jonesboro-Hodge Elementary School (math 2% / reading 8%, grade F, #633 of 646 statewide, top 99%, 340 students, 84% FRL); Jonesboro-Hodge Middle School (math 8% / reading 17%, grade F, #192 of 218 statewide, top 88%, 162 students, 77% FRL); Jonesboro-Hodge High School (math 5% / reading 15%, grade F, #239 of 265 statewide, top 91%, 228 students, 72% FRL) — zoned schools average 77% FRL vs 56% district-wide (21 pts higher); higher-poverty schools than district average — tighter screening recommended.
- Zoned-school proficiency averages 9% at this address vs 28% district-wide (-19 pts) — the specific schools serving this property underperform the Jackson Parish average; the district grade overstates school quality for this exact location.
- Market conditions: Rents rising fast (+6.6%/yr); 277 active listings in the ZIP; lower-income renter base — watch delinquency.
- This rent runs 35% of the median local income ($37k/yr) — at the standard rent-burdened threshold; future hikes will face affordability resistance.
Forward outlook
- Local home prices are declining (-3.0%/yr); year-one equity from $864 of loan paydown is wiped out by about $4k of value loss. Plan a longer hold.
- Jackson County population projected at -18% by 2050 — secular population decline; favor cash flow + early exit over multi-decade hold.
Negotiation context
- It's been on market 15 days — a 2% lower offer ($123k) is reasonable based on typical stale-listing flexibility.
Risks & watch-outs
- Climate carrying-cost: major wind risk, 73% chance of damaging wind over 30y; extreme-heat days projected 7→20/yr by 2055 (HVAC capex compounding) — expect insurance premiums to compound above CPI over the hold.
Questions for the listing agent
- What do current leases actually rent for vs. the listed asking? Can we see a recent rent roll and the last 12 months of T-12 income?
- Is there a deadline driving the sale (1031 exchange, divorce, estate, relocation)? That informs how much negotiation room exists.
- Schools are B-rated — typically a magnet for longer-tenancy family renters. What's the average tenant stay here, and is there a school-zone premium baked into asking?
- Crime grade is F in this area — have there been break-ins, vandalism, or insurance claims at this property in the last 3 years? What carrier currently insures it and at what premium?
- The area grade is low — what's the realistic commute time and amenity access for the typical tenant pool here? Any planned neighborhood developments (good or bad) we should know about?
- What's the average days-on-market for RENTAL listings here right now (not sales)? A rising rental-DOM trend means longer vacancies and softer asking-rent achievability than the comps imply.
- What's the recent tenant-quality profile in this submarket — average credit score on applications, eviction rate, late-payment / NSF rate, and stable-employment percentage? A property-management company in the area should have these aggregated.
- How much new for-sale + rental construction is in the pipeline within 1–3 miles? Heavy new supply typically softens prices + rents 12–24 months out; constrained supply supports both.
Investment metrics
- 1% rule
- 0.86% ✗
- Cap rate
- 6.17%
- Cash-on-cash
- -0.46%
- DSCR
- 0.98
- GRM
- 9.7
CMA / ARV
No comps found within radius.
Projected returns pro-forma
-3.0% appreciation · 6.6% rent growth · sell at horizon
- IRR
- -13.1%
- Equity multiple
- 0.51×
- Total profit
- $-17,046
- Equity at exit
- $18,638
- IRR
- 0.7%
- Equity multiple
- 1.06×
- Total profit
- $1,988
- Equity at exit
- $10,808
Cash invested: $35,000 (down + closing). Projections, not guarantees.
Landlord ↔ Tenant lean methodology
- Overall (STATE)
- 90 Strongly Landlord-Friendly
- State Louisiana
- 90 Strongly Landlord-Friendly · R+12
- County
- — inherits STATE
- City
- — inherits STATE
ZIP-level market 71270
- Home prices YoY
- -16.1%
- Rents YoY
- 6.6%
- Active inventory
- 277
- Price-to-rent
- 9.7×
Monthly cashflow live
- Estimated rent
- $1,077 medium interval (Pro) →
- Mortgage (P&I)
- −$656
- Tax est. 1.5%
- −$156 /mo · $1,875/yr
- Insurance
- −$52
- HOA
- −$0
- Vacancy / Maint / Mgmt
- −$226
- Net cashflow
- $-13
Break-even live
Sensitivity live
| Price | -10% $73 | -5% $30 | +0% $-13 | +5% $-57 | +10% $-100 |
|---|---|---|---|---|---|
| Rent | -10% $-98 | -5% $-56 | +0% $-13 | +5% $29 | +10% $72 |
| Rate | -1.0pp $50 | -0.5pp $18 | base $-13 | +0.5pp $-46 | +1.0pp $-79 |
UW: 25.0% down · 7.5% · 30yr · 1.5% tax · 5.0% vac · 8.0% maint · 8.0% mgmt
Financing live
Cash to close
- Down payment
- $31,250
- Closing costs
- $3,750
- Reserves months
- —
- Total cash needed
- —
Loan-product check · same deal, 3 products live
Conventional
25% down · 7.5% · 30yr
- Down + closing
- —
- Monthly P&I
- —
- Monthly cashflow
- —
- DSCR
- —
- Eligible?
- —
Personal DTI + credit; lowest rate.
DSCR
20% down · 8.5% · 30yr
- Down + closing
- —
- Monthly P&I
- —
- Monthly cashflow
- —
- DSCR
- —
- Eligible?
- —
No personal income docs; deal must DSCR.
Hard money
10% down · 12.0% · 12mo
- Down + closing
- —
- Monthly P&I
- —
- Monthly cashflow
- —
- DSCR
- —
- Eligible?
- —
Short-term bridge; refi at stabilization.
Listing history 7 events
-
2026-06-05statusdays on market $125,000 Pending 15 DOM
-
2026-06-03days on market $125,000 Active 14 DOM
-
2026-06-02days on market $125,000 Active 13 DOM
-
2026-06-01days on market $125,000 Active 12 DOM
-
2026-05-31days on market $125,000 Active 11 DOM
-
2026-05-30days on market $125,000 Active 10 DOM
-
2026-05-18$125,000 Active
ⓘ Source: listings_history table (triggers on properties + properties_extension) + one-shot
backfill from property_details.listing_events for pre-trigger history.
Climate risk First Street
- Flood 1/10 Low FEMA zone X (unshaded) · 0% chance over 30 yrs
- Wildfire 4/10 Moderate
- Heat 7/10 Severe 7 d/yr ≥111°F today · 20 d/yr by 30 yrs out
- Wind 6/10 Major 73% chance of damaging wind over 30 yrs
- Air quality 1/10 Low 0 unhealthy d/yr today · 0 by 30 yrs out
Nearby sold comps map
Loading sold comps map…
Walkable amenities ~0.75 mi
Loading nearby amenities…
Taxation est. · year 1
- Rental income
- $12,920
- − Mortgage interest
- −$7,002
- − Property taxes
- −$1,875
- − Insurance
- −$625
- − Repairs & maintenance
- −$1,034
- − Management
- −$1,034
- − Depreciation
- −$3,636
- Taxable loss
- −$2,286
- Est. tax savings @ 24.0%
- +$549
- After-tax cash flow
- $389/yr
For passive investors: Depreciation is non-cash, so a rental often shows a tax loss while cash-flowing — sheltering income. Rental losses are passive: they offset passive income freely, and up to $25,000/yr can offset ordinary (W-2) income if you actively participate and your MAGI is under $100k (phasing out to $0 by $150k); unused losses carry forward. On sale, claimed depreciation is recaptured at up to 25%, and gains may owe capital-gains tax (a 1031 exchange can defer both). Figures are a year-1 estimate at your 24.0% rate — not tax advice; consult a CPA.
Condition & rehab AI · 23 photos
This 2023 single-wide mobile home is in excellent condition with new updates throughout, making it move-in ready and ideal for both resale and rental.
Value-add opportunities
- Both Painting exterior and interior — Enhances curb appeal and interior aesthetics
- Both Landscaping and curb appeal improvements — Enhances curb appeal and property value
- Both New flooring in bathrooms — Improves functionality and aesthetics
- Both New lighting fixtures — Enhances safety and aesthetics
Renovation cost estimate screening
Value-add ROI direction
- Both Painting exterior and interior — Enhances curb appeal and interior aesthetics ↑
- Both Landscaping and curb appeal improvements — Enhances curb appeal and property value ↑
- Both New flooring in bathrooms — Improves functionality and aesthetics ↑
- Both New lighting fixtures — Enhances safety and aesthetics ↑
ⓘ Cost ranges are severity-bucket heuristics (US national rule-of-thumb). Get contractor quotes + a written scope before underwriting a rehab budget.
Schools (NCES district)
- District
- Jackson Parish
- NCES district ID
- 2200780
- Math proficiency
- 25% ▼ -26.00%
- Reading proficiency
- 31% ▼ -30.00%
- Median HH income
- $37,823
- Composite
- 23.36/100
- National rank
- #7909
- State rank
- #50 of 98 in LA
Livability — Ruston
- Score
- 68/100
- State rank
- #86
- US rank
- #9522
Category grades
Schools grade is shown separately in the Schools card above.
Census & demographics
- County
- Lincoln Parish · 32,885 people
- City population
- 32,885
- Metro
- Ruston, LA
- Population (ZIP)
- 32,885
- Household income
- $36,791
- Rent vs Own
- Severe rent burden
- 2476.0
Population outlook (Jackson County) Hauer SSP2
- Today (2025)
- 15,022 people
- By 2030
- 14,489 · -3.5%
- By 2040
- 13,361 · -11.1%
- By 2050
- 12,269 · -18.3%
- By 2075
- 9,848 · -34.4%
- By 2100
- 7,510 · -50.0%
Race, ethnicity, and origin ACS 2023
- Neighborhood character
- Diverse neighborhood (Simpson 0.60)
- Race & ethnicity
- White 51% Black 38% Two or more races 6% Hispanic / Latino 4% Asian 2% Native American 1%
- Common ancestry
- Lithuanian 4% Slovak 2% Serbian 1%
- Foreign-born
- 3% · Canada, Vietnam
- Languages at home
- 95% English-only · Spanish 2% Other Indo-European 1% Arabic 1%
Political lean MEDSL · Jackson
- 2024 margin
- Solid R (+47.6) · D 25.6% · R 73.2% · Other 1.1%
- 2008→2024 swing
- -12.2pp toward R · 2008: -35.3pp · 2024: -47.6pp
- All cycles
- 2024: R+47.6 2020: R+42.6 2016: R+40.6 2012: R+37.5 2008: R+35.3
Not yet ingested
- Civics
- —
Market trends
- HPI YoY
- ▼ -40.69%
- Current HPI
- 212.8211
- Rent YoY
- ▲ 6.60%
- Metro
- Ruston, LA
- State GDP YoY
- ▲ 3.29%
- F500 in state
- 10
Industry mix (Fortune 500 HQ in LA)
| Industry | F500 HQs | Revenue |
|---|---|---|
| Telecommunications | 2 | $23B |
|
||
| Utilities | 1 | $12B |
|
||
| Wholesale / Distribution | 1 | $5B |
|
||
| Advertising | 1 | $2B |
|
||
Price history
1 event — show timeline
- 2026-05-18 Listed $125,000 NELABOR
Cash-flow waterfall
monthlySold comps — $/sqft
last 12 mo · ≤1 miLoading sold comps…