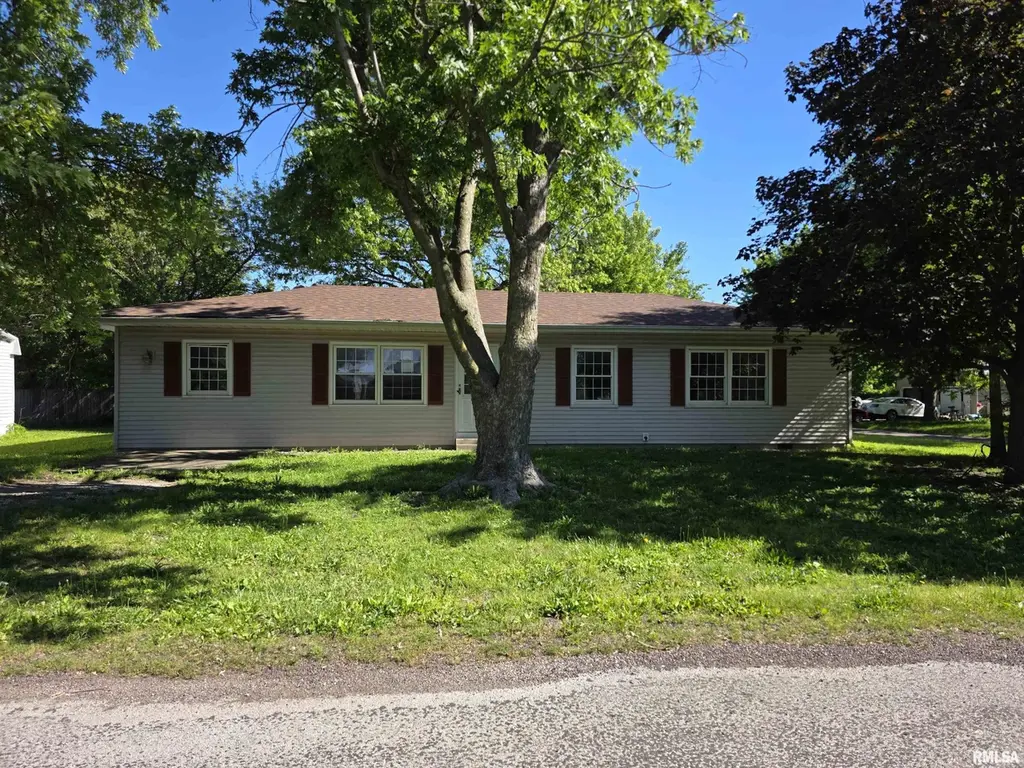
405 Keller Ave · Virden, IL
Flood risk 1/10 · Minimal
- FEMA flood zone
- —
- Chance of flooding over 30 yrs
- 0.0%
- Est. flood insurance / yr
- —
Fire risk 1/10 · Minimal
- Est. fire insurance / yr
- $804 – $1,492
Heat risk 4/10 · Minor
- Hot days now (above 105°F)
- 7 days/yr
- Hot days in 30 yrs
- 20 days/yr
Wind risk 2/10 · Minimal
- Chance of severe wind over 30 yrs
- 2.0%
Air-quality risk 2/10 · Minimal
- Unhealthy air days now
- 1 days/yr
- Unhealthy air days in 30 yrs
- 2 days/yr
Risk factors via First Street. Map © Google.
Why this score? — see what drove the B grade
The composite is a weighted blend of 9 inputs, each scored 0–100. Each bar is that input's sub-score; the figure is the points it added to the 100-point composite (weight × sub-score).
- Cash flow +30.0/30.0
- 1% rule +10.0/10.0
- DSCR +10.0/10.0
- ARV discount +7.5/15.0
- Schools +5.0/10.0
- Livability +3.0/5.0
- Rent growth +2.5/5.0
- Condition / age +2.5/5.0
- Appreciation +0.0/10.0
$33,500
🖨 Deal sheet 📄 Offer letter ✓ Due diligence
Listing remarks
Spacious 3 bedroom 2.5 bath ranch home with detached 2 car garage situated on over a half acre corner lot on the edge of town. Great small town setting near the local school and just approximately 30 minutes from Springfield. Home offers a functional layout, generous lot size, and plenty of potential for an owner occupant, investor, or rehab project. Property needs repairs and updating but offers an excellent opportunity to build equity and make it your own. Large yard provides room for outdoor activities, gardening, or future improvements. Hard to find combination of space, location, and potential at this price point.
Key facts
- Large yard
- Corner lot
- 0.52 acre lot
Tags
Property features AI
Exterior
- Parking: Detached 2-car garage
- Utilities: Public water; Public sewer
- Home design: Single-family residence; Not new construction; Approx. 2,000 total building area
- Construction: Built in 1975; Partial, unfinished basement
- Exterior features: Corner lot; Paved road access; Shingle roof
Interior
- Kitchen: Kitchen on main level (vinyl flooring, approx. 12' x 14')
- Bedrooms: 3 bedrooms (bedroom sizes on main level: approx. 8' x 9', 10' x 10', 12' x 11'); Egress windows in bedrooms
- Flooring: Carpet in bedrooms; Vinyl in kitchen
- Bathrooms: 2 full bathrooms; 1 half bathroom
- Heating & cooling: Forced air heating; Central air conditioning
- Interior features: Soaking tub; Family room fireplace (1)
Neighborhood map
What this means for you Summary
Snapshot
- This is a 3-bed/2.5-bath single-family listed at $34k.
Deal economics
- At list price, monthly cash flow is $822 ($10k/yr) — positive.
- The deal already cash-flows at list — no discount required.
- Meets the 1% rule at list price ($1k rent vs $34k).
- Recommended offer: $33k (1.5% below list) — sets the bar for market timing.
Location & tenants
- Location reads 60/100 on livability (#975 in IL) — a middle-class / working-renter tenant base. Strengths: cost of living A+, housing A+; Watch: crime D+, schools D-, amenities F.
- Market conditions: 12 active listings in the ZIP; 70 units permitted in Macoupin County in 2024 (0 in 5+ unit buildings).
Forward outlook
- Local home prices are declining (-3.0%/yr); year-one equity from $232 of loan paydown is wiped out by about $1k of value loss. Plan a longer hold.
- Macoupin County population projected at -27% by 2050 — secular population decline; favor cash flow + early exit over multi-decade hold.
- At projected returns (-3.0% appreciation + 3.0% rent growth), your $9k cash investment doubles in ~2 years — after that, you're playing with house money.
Negotiation context
- It's been on market 17 days — a 2% lower offer ($33k) is reasonable based on typical stale-listing flexibility.
Questions for the listing agent
- Built in 1975 — when were the roof, HVAC, electrical panel, plumbing, and water heater last replaced?
- Is there a deadline driving the sale (1031 exchange, divorce, estate, relocation)? That informs how much negotiation room exists.
- Schools are D-rated, which usually means shorter tenancies and higher turnover. Who's the typical renter profile here, and what's been the actual vacancy rate?
- Crime grade is D in this area — have there been break-ins, vandalism, or insurance claims at this property in the last 3 years? What carrier currently insures it and at what premium?
- What's the average days-on-market for RENTAL listings here right now (not sales)? A rising rental-DOM trend means longer vacancies and softer asking-rent achievability than the comps imply.
- What's the recent tenant-quality profile in this submarket — average credit score on applications, eviction rate, late-payment / NSF rate, and stable-employment percentage? A property-management company in the area should have these aggregated.
- How much new for-sale + rental construction is in the pipeline within 1–3 miles? Heavy new supply typically softens prices + rents 12–24 months out; constrained supply supports both.
Investment metrics
- 1% rule
- 3.98% ✓
- Cap rate
- 35.73%
- Cash-on-cash
- 105.14%
- DSCR
- 5.68
- GRM
- 2.1
CMA / ARV
- ARV (on-the-fly)
- $204,000
- Comps found
- 6
Show comp detail 6 sales within ~0.75 mi
| Address | Dist | Beds/Ba | Sqft | Sold | Price | $/sf | Match |
|---|---|---|---|---|---|---|---|
| 110 S Blair St | 0.62mi | 3/2.0 | 1,984 (-1%) | 2mo | $200,000 | $101 | 66 |
| 1536 N Springfield St | 0.62mi | 4/2.5 (+1) | 2,129 (+6%) | 4mo | $218,000 | $102 | 52 |
| 710 W Dean St | 0.71mi | 3/2.0 | 1,862 (-7%) | 5mo | $202,000 | $108 | 49 |
| 315 N Dye St | 0.55mi | 3/1.0 | 1,786 (-11%) | 20mo | $50,000 | $28 | 34 |
| — | 0.69mi | 4/2.0 (+1) | 1,774 (-11%) | 10mo | $337,500 | $190 | 34 |
| 320 W Green St | 0.67mi | 3/1.0 | 1,700 (-15%) | 23mo | $50,500 | $30 | 18 |
Match score weights: distance 35% · size 25% · config 20% · recency 20%. Top-matched comps best support the ARV.
Projected returns pro-forma
-3.0% appreciation · 3.0% rent growth · sell at horizon
- IRR
- —
- Equity multiple
- 6.00×
- Total profit
- $46,937
- Equity at exit
- $4,995
- IRR
- —
- Equity multiple
- 12.55×
- Total profit
- $108,357
- Equity at exit
- $2,896
Cash invested: $9,380 (down + closing). Projections, not guarantees.
Landlord ↔ Tenant lean methodology
- Overall (STATE)
- 43 Moderately Tenant-Leaning
- State Illinois
- 43 Moderately Tenant-Leaning · D+7
- County
- — inherits STATE
- City
- — inherits STATE
ZIP-level market 62690
- Home prices YoY
- -28.3%
- Active inventory
- 12
- Price-to-rent
- 2.1×
Monthly cashflow live
- Estimated rent
- $1,333 medium interval (Pro) →
- Mortgage (P&I)
- −$176
- Tax est. 1.5%
- −$42 /mo · $502/yr
- Insurance
- −$14
- HOA
- −$0
- Vacancy / Maint / Mgmt
- −$280
- Net cashflow
- $822
Break-even live
UW: 25.0% down · 7.5% · 30yr · 1.5% tax · 5.0% vac · 8.0% maint · 8.0% mgmt
Financing live
Cash to close
- Down payment
- $8,375
- Closing costs
- $1,005
- Reserves months
- —
- Total cash needed
- —
Loan-product check · same deal, 3 products live
Conventional
25% down · 7.5% · 30yr
- Down + closing
- —
- Monthly P&I
- —
- Monthly cashflow
- —
- DSCR
- —
- Eligible?
- —
Personal DTI + credit; lowest rate.
DSCR
20% down · 8.5% · 30yr
- Down + closing
- —
- Monthly P&I
- —
- Monthly cashflow
- —
- DSCR
- —
- Eligible?
- —
No personal income docs; deal must DSCR.
Hard money
10% down · 12.0% · 12mo
- Down + closing
- —
- Monthly P&I
- —
- Monthly cashflow
- —
- DSCR
- —
- Eligible?
- —
Short-term bridge; refi at stabilization.
Listing history 7 events
-
2026-06-07statusdays on market $33,500 Pending 17 DOM
-
2026-06-04days on market $33,500 Active 16 DOM
-
2026-06-02days on market $33,500 Active 15 DOM
-
2026-06-01days on market $33,500 Active 14 DOM
-
2026-05-31days on market $33,500 Active 13 DOM
-
2026-05-31days on market $33,500 Active 12 DOM
-
2026-05-17$33,500 Active
ⓘ Source: listings_history table (triggers on properties + properties_extension) + one-shot
backfill from property_details.listing_events for pre-trigger history.
Climate risk First Street
- Flood 1/10 Low 0% chance over 30 yrs
- Wildfire 1/10 Low
- Heat 4/10 Moderate 7 d/yr ≥105°F today · 20 d/yr by 30 yrs out
- Wind 2/10 Low 2% chance of damaging wind over 30 yrs
- Air quality 2/10 Low 1 unhealthy d/yr today · 2 by 30 yrs out
Nearby sold comps map
Loading sold comps map…
Walkable amenities ~0.75 mi
Loading nearby amenities…
Taxation est. · year 1
- Rental income
- $16,001
- − Mortgage interest
- −$1,877
- − Property taxes
- −$502
- − Insurance
- −$168
- − Repairs & maintenance
- −$1,280
- − Management
- −$1,280
- − Depreciation
- −$975
- Taxable income
- $9,920
- Est. tax owed @ 24.0%
- −$2,381
- After-tax cash flow
- $7,482/yr
For passive investors: Depreciation is non-cash, so a rental often shows a tax loss while cash-flowing — sheltering income. Rental losses are passive: they offset passive income freely, and up to $25,000/yr can offset ordinary (W-2) income if you actively participate and your MAGI is under $100k (phasing out to $0 by $150k); unused losses carry forward. On sale, claimed depreciation is recaptured at up to 25%, and gains may owe capital-gains tax (a 1031 exchange can defer both). Figures are a year-1 estimate at your 24.0% rate — not tax advice; consult a CPA.
Schools (NCES district)
No district data.
Livability — Virden
- Score
- 60/100
- State rank
- #975
- US rank
- #18878
Category grades
Schools grade is shown separately in the Schools card above.
Census & demographics
- Census place
- Virden, IL
- City population
- 3,878
- Population (ZIP)
- 3,878
Population outlook (Macoupin County) Hauer SSP2
- Today (2025)
- 42,867 people
- By 2030
- 40,796 · -4.8%
- By 2040
- 36,135 · -15.7%
- By 2050
- 31,469 · -26.6%
- By 2075
- 22,102 · -48.4%
- By 2100
- 15,380 · -64.1%
Race, ethnicity, and origin ACS 2023
- Neighborhood character
- Predominantly White (98%)
- Race & ethnicity
- White 98% Two or more races 1%
- Common ancestry
- Iranian 7% Lithuanian 2% Italian 1%
- Foreign-born
- 1%
Political lean MEDSL · Macoupin
- 2024 margin
- Solid R (+39.2) · D 29.4% · R 68.7% · Other 1.9%
- 2008→2024 swing
- -49.0pp toward R · 2008: 9.8pp · 2024: -39.2pp
- All cycles
- 2024: R+39.2 2020: R+36.5 2016: R+35.0 2012: R+7.0 2008: D+9.8
Not yet ingested
- Civics
- —
Market trends
- HPI YoY
- ▼ -49.41%
- Current HPI
- 125.3599
- Rent YoY
- —
- Metro
- —
- State GDP YoY
- ▲ 1.59%
- F500 in state
- 60
Industry mix (Fortune 500 HQ in IL)
| Industry | F500 HQs | Revenue |
|---|---|---|
| Insurance | 4 | $201B |
|
||
| Consumer Goods | 4 | $87B |
|
||
| Industrial Machinery | 3 | $64B |
|
||
| Healthcare | 2 | $55B |
|
||
| Retail / Pharmacy | 1 | $148B |
|
||
| Agriculture / Food | 1 | $86B |
|
||
Price history
1 event — show timeline
- 2026-05-17 Listed $33,500 RMLSA as Distributed by MLS Grid
Property tax history
+3.8%/yrLatest (2024): $2,968 · +6.1% YoY. Source: county tax records.
Cash-flow waterfall
monthlySold comps — $/sqft
last 12 mo · ≤1 miLoading sold comps…