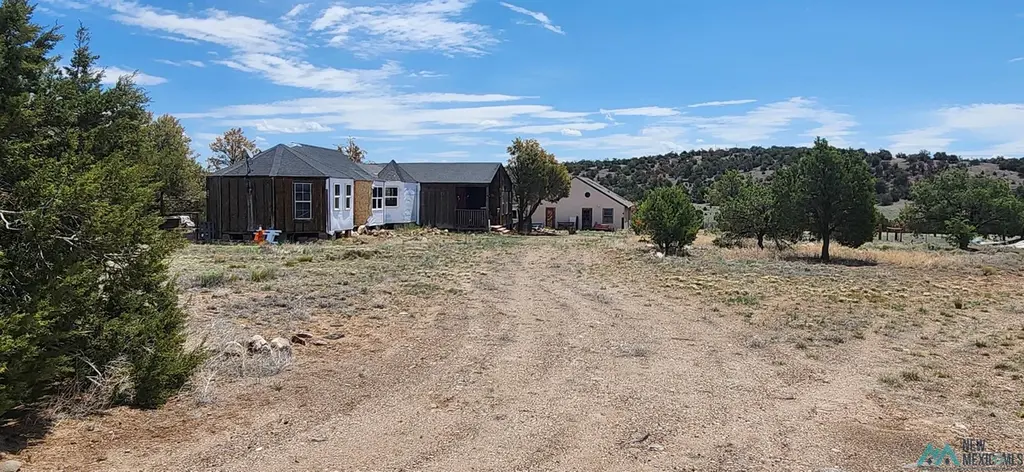
53 Horseshoe Rd · Quemado, NM
Flood risk No data
- FEMA flood zone
- —
- Chance of flooding over 30 yrs
- —
- Est. flood insurance / yr
- —
Fire risk No data
- Est. fire insurance / yr
- —
Heat risk No data
- Hot days now (above threshold)
- —
- Hot days in 30 yrs
- —
Wind risk No data
- Chance of severe wind over 30 yrs
- —
Air-quality risk No data
- Unhealthy air days now
- —
- Unhealthy air days in 30 yrs
- —
Risk factors via First Street. Map © Google.
Why this score? — see what drove the D grade
The composite is a weighted blend of 9 inputs, each scored 0–100. Each bar is that input's sub-score; the figure is the points it added to the 100-point composite (weight × sub-score).
- Cash flow +10.5/30.0
- ARV discount +7.5/15.0
- Appreciation +6.7/10.0
- Schools +4.1/10.0
- 1% rule +3.1/10.0
- DSCR +3.0/10.0
- Rent growth +2.5/5.0
- Livability +2.2/5.0
- Condition / age +2.2/5.0
$135,000
🖨 Deal sheet (PDF) 📄 Offer letter ✓ Due diligence
Listing remarks
INVESTMENT OPPORTUNITY!! Discover the potential of this distinctive property featuring a home, two-story barn, horse stalls, chicken coop, dog run, and storage shed. The property is fully fenced with additional cross-fencing, making it well-suited for animals, projects, or rural living. According to the well summary, the well is 260 feet deep with an estimated production of 10 gallons per minute. Several frost-free water hydrants are located throughout the property, and 200-amp electric service is available at both the house and barn. The home offers solid bones and unique character, presenting a promising opportunity for renovation. The primary bathroom and kitchen have been gutted, allow
Key facts
- Fully fenced
- Two story barn
- Horse stalls
Tags
Property features AI
Finance
- Other: Property suitable for horses with corrals and corral amenities
- HOA & community: Has homeowners association
Exterior
- Parking: No garage; RV access/parking
- Utilities: Private well water; Electricity connected; Propane available; Septic tank
- Home design: Single-story residential property; One level; Located in the Horseshoe Trails subdivision
- Construction: Frame construction with wood siding
- Exterior features: Barns; Corrals; Workshop; Fenced yard with wire fencing
Interior
- Bathrooms: One full bathroom
- Heating & cooling: No heating system specified
- Interior features: Dog run; Irregular lot
Neighborhood map
What this means for you Summary
Snapshot
- This is a 2-bed/1.0-bath single-family listed at $135k. Condition is rated fair.
Deal economics
- At list price, monthly cash flow is $-70 ($-841/yr) — negative.
- To cash-flow at today's rent, offer at most $125k (7.5% below list).
- To meet the 1% rule (rent ≥ 1% of price), the offer needs to be $109k (19.1% below list).
- Recommended offer: $109k (19.1% below list) — sets the bar for 1% rule.
Location & tenants
- Location reads 45/100 on livability (#336 in NM) — a working-class tenant base; expect higher turnover. Strengths: cost of living A+, crime A; Watch: health & safety C-, amenities F, commute F.
- Quemado Independent Schools (rural): math 25% / reading 75% proficiency, ranked #10 of 29 in NM (top 34%) — acceptable for families but not a draw, mixed tenant base, ~2y average lease; 67% free/reduced lunch — lower-income household profile, screen leases tightly.
- Zoned schools: Quemado Elementary (86 students, 58% FRL); Quemado High (math 24% / reading 75%, grade D+, #36 of 110 statewide, top 45%, 71 students, 65% FRL).
- Market conditions: 97 active listings in the ZIP.
Forward outlook
- In year one you build about $6k of equity ($933 loan paydown + $5k appreciation (3.5% local appreciation)).
- Catron County population projected at -52% by 2050 — secular population decline; favor cash flow + early exit over multi-decade hold.
- At projected returns (3.5% appreciation + 3.0% rent growth), your $38k cash investment doubles in ~7 years — after that, you're playing with house money.
- By year 7, paydown + projected appreciation supports a ~$35k cash-out refi (75% LTV) — recoverable capital for the next deal without selling this one.
Negotiation context
- Only 5 days on market — expect competitive offers; lowballing is unlikely to land.
Questions for the listing agent
- What do current leases actually rent for vs. the listed asking? Can we see a recent rent roll and the last 12 months of T-12 income?
- Have any recent inspections been done? Can we get a copy of the seller's disclosures and any deferred-maintenance estimates?
- Is there a deadline driving the sale (1031 exchange, divorce, estate, relocation)? That informs how much negotiation room exists.
- Schools are D-rated, which usually means shorter tenancies and higher turnover. Who's the typical renter profile here, and what's been the actual vacancy rate?
- The area grade is low — what's the realistic commute time and amenity access for the typical tenant pool here? Any planned neighborhood developments (good or bad) we should know about?
- What's the average days-on-market for RENTAL listings here right now (not sales)? A rising rental-DOM trend means longer vacancies and softer asking-rent achievability than the comps imply.
- What's the recent tenant-quality profile in this submarket — average credit score on applications, eviction rate, late-payment / NSF rate, and stable-employment percentage? A property-management company in the area should have these aggregated.
- How much new for-sale + rental construction is in the pipeline within 1–3 miles? Heavy new supply typically softens prices + rents 12–24 months out; constrained supply supports both.
Investment metrics
- 1% rule
- 0.81% ✗
- Cap rate
- 5.67%
- Cash-on-cash
- -2.23%
- DSCR
- 0.90
- GRM
- 10.3
CMA / ARV
- ARV (on-the-fly)
- $389,536
- Comps found
- 3
Show comp detail 3 sales within ~0.75 mi
| Address | Dist | Beds/Ba | Sqft | Sold | Price | $/sf | Match |
|---|---|---|---|---|---|---|---|
| 59 Bridle Path | 0.56mi | 2/2.0 | 1,334 (-11%) | 1mo | $349,900 | $262 | 50 |
| 59 Bridle Path | 0.56mi | 2/2.0 | 1,334 (-11%) | 1mo | $340,000 | $255 | 50 |
| 59 Bridle Path | 0.73mi | 2/2.0 | 1,334 (-11%) | 1mo | $345,000 | $259 | 42 |
Match score weights: distance 35% · size 25% · config 20% · recency 20%. Top-matched comps best support the ARV.
Projected returns pro-forma
3.45% appreciation · 3.0% rent growth · sell at horizon
- IRR
- 6.8%
- Equity multiple
- 1.40×
- Total profit
- $15,091
- Equity at exit
- $64,189
- IRR
- 9.4%
- Equity multiple
- 2.48×
- Total profit
- $56,041
- Equity at exit
- $101,725
Cash invested: $37,800 (down + closing). Projections, not guarantees.
Landlord ↔ Tenant lean methodology
- Overall (STATE)
- 55 Moderately Landlord-Leaning
- State New Mexico
- 55 Moderately Landlord-Leaning · D+3
- County
- — inherits STATE
- City
- — inherits STATE
ZIP-level market 87829
- Home prices YoY
- 3.6%
- Active inventory
- 97
- Price-to-rent
- 10.3×
Monthly cashflow live
- Estimated rent
- $1,092 medium interval (Pro) →
- Mortgage (P&I)
- −$708
- Tax est. 1.5%
- −$169 /mo · $2,025/yr
- Insurance
- −$56
- HOA
- −$0
- Vacancy / Maint / Mgmt
- −$229
- Net cashflow
- $-70
Break-even live
Sensitivity live
| Price | -10% $23 | -5% $-23 | +0% $-70 | +5% $-117 | +10% $-163 |
|---|---|---|---|---|---|
| Rent | -10% $-156 | -5% $-113 | +0% $-70 | +5% $-27 | +10% $16 |
| Rate | -1.0pp $-2 | -0.5pp $-36 | base $-70 | +0.5pp $-105 | +1.0pp $-141 |
UW: 25.0% down · 7.5% · 30yr · 1.5% tax · 5.0% vac · 8.0% maint · 8.0% mgmt
Financing live
Cash to close
- Down payment
- $33,750
- Closing costs
- $4,050
- Reserves months
- —
- Total cash needed
- —
Loan-product check · same deal, 3 products live
Conventional
25% down · 7.5% · 30yr
- Down + closing
- —
- Monthly P&I
- —
- Monthly cashflow
- —
- DSCR
- —
- Eligible?
- —
Personal DTI + credit; lowest rate.
DSCR
20% down · 8.5% · 30yr
- Down + closing
- —
- Monthly P&I
- —
- Monthly cashflow
- —
- DSCR
- —
- Eligible?
- —
No personal income docs; deal must DSCR.
Hard money
10% down · 12.0% · 12mo
- Down + closing
- —
- Monthly P&I
- —
- Monthly cashflow
- —
- DSCR
- —
- Eligible?
- —
Short-term bridge; refi at stabilization.
Listing history 5 events
-
2026-06-21days on market $135,000 Active 5 DOM
-
2026-06-21days on market $135,000 Active 4 DOM
-
2026-06-18days on market $135,000 Active 2 DOM
-
2026-06-17remarks 699-char remark
-
2026-06-17$135,000 Active 1 DOM
ⓘ Source: listings_history table (triggers on properties + properties_extension) + one-shot
backfill from property_details.listing_events for pre-trigger history.
Nearby sold comps map
Loading sold comps map…
Walkable amenities ~0.75 mi
Loading nearby amenities…
Taxation est. · year 1
- Rental income
- $13,106
- − Mortgage interest
- −$7,562
- − Property taxes
- −$2,025
- − Insurance
- −$675
- − Repairs & maintenance
- −$1,049
- − Management
- −$1,049
- − Depreciation
- −$3,927
- Taxable loss
- −$3,180
- Est. tax savings @ 24.0%
- +$763
- After-tax cash flow
- $-78/yr
For passive investors: Depreciation is non-cash, so a rental often shows a tax loss while cash-flowing — sheltering income. Rental losses are passive: they offset passive income freely, and up to $25,000/yr can offset ordinary (W-2) income if you actively participate and your MAGI is under $100k (phasing out to $0 by $150k); unused losses carry forward. On sale, claimed depreciation is recaptured at up to 25%, and gains may owe capital-gains tax (a 1031 exchange can defer both). Figures are a year-1 estimate at your 24.0% rate — not tax advice; consult a CPA.
Condition & rehab AI · 12 photos
This property presents a significant renovation opportunity with extensive gutting and repairs needed, but offers a unique investment potential with a well-suited rural setting.
Repairs flagged
- Major Exterior siding — Weathered and in need of replacement
- Major Interior walls — Exposed and in need of repainting
- Major Kitchen cabinets — Removed and need replacement
- Major Bathroom fixtures — Removed and need replacement
Value-add opportunities
- Both Painting and repainting — Enhances curb appeal and interior aesthetics
- Both Floor refinishing — Improves living space and adds value
- Both New kitchen cabinets — Updates the kitchen and adds functionality
- Both New bathroom fixtures — Enhances bathroom functionality and aesthetics
Renovation cost estimate screening
| Repair item | Severity | Est. cost |
|---|---|---|
| Exterior siding · Weathered and in need of replacement | Major | $15,000–50,000 |
| Interior walls · Exposed and in need of repainting | Major | $15,000–50,000 |
| Kitchen cabinets · Removed and need replacement | Major | $15,000–50,000 |
| Bathroom fixtures · Removed and need replacement | Major | $15,000–50,000 |
| Total estimated repair cost · 4 items | $60,000–200,000 |
Value-add ROI direction
- Both Painting and repainting — Enhances curb appeal and interior aesthetics ↑
- Both Floor refinishing — Improves living space and adds value ↑
- Both New kitchen cabinets — Updates the kitchen and adds functionality ↑
- Both New bathroom fixtures — Enhances bathroom functionality and aesthetics ↑
ⓘ Cost ranges are severity-bucket heuristics (US national rule-of-thumb). Get contractor quotes + a written scope before underwriting a rehab budget.
Schools (NCES district)
- District
- Quemado Independent Schools
- NCES district ID
- 3502130
- Math proficiency
- 25% ▲ 10.00%
- Reading proficiency
- 75% ▲ 50.00%
- Median HH income
- $38,381
- Composite
- 41.46/100
- National rank
- #3464
- State rank
- #10 of 29 in NM
Livability — Quemado
- Score
- 45/100
- State rank
- #336
- US rank
- #26538
Category grades
Schools grade is shown separately in the Schools card above.
Census & demographics
- Population (ZIP)
- 840
Population outlook (Catron County) Hauer SSP2
- Today (2025)
- 2,847 people
- By 2030
- 2,487 · -12.6%
- By 2040
- 1,821 · -36.0%
- By 2050
- 1,366 · -52.0%
- By 2075
- 909 · -68.1%
- By 2100
- 617 · -78.3%
Race, ethnicity, and origin ACS 2023
- Neighborhood character
- Predominantly White (89%)
- Race & ethnicity
- White 89% Hispanic / Latino 10% Two or more races 2%
- Hispanic origin (detail)
- Mexican 4%
- Common ancestry
- Slovak 17% Lithuanian 15% Scottish 2%
- Foreign-born
- 8%
- Languages at home
- 80% English-only · Spanish 15% French/Haitian/Cajun 5%
Political lean MEDSL · Catron
- 2024 margin
- Solid R (+50.1) · D 24.2% · R 74.3% · Other 1.4%
- 2008→2024 swing
- -15.4pp toward R · 2008: -34.8pp · 2024: -50.1pp
- All cycles
- 2024: R+50.1 2020: R+47.4 2016: R+50.7 2012: R+43.7 2008: R+34.8
Not yet ingested
- Civics
- —
Market trends
- HPI YoY
- ▲ 3.46%
- Current HPI
- 98.3591
- Rent YoY
- —
- Metro
- —
- State GDP YoY
- —
- F500 in state
- 0
Price history
1 event — show timeline
- 2026-06-16 Listed $135,000 NMMLS
Cash-flow waterfall
monthlySold comps — $/sqft
last 12 mo · ≤1 miLoading sold comps…