3400 SE Glenstone Dr #4 · Grimes, IA
Flood risk No data
- FEMA flood zone
- —
- Chance of flooding over 30 yrs
- —
- Est. flood insurance / yr
- —
Fire risk No data
- Est. fire insurance / yr
- —
Heat risk No data
- Hot days now (above threshold)
- —
- Hot days in 30 yrs
- —
Wind risk No data
- Chance of severe wind over 30 yrs
- —
Air-quality risk No data
- Unhealthy air days now
- —
- Unhealthy air days in 30 yrs
- —
Risk factors via First Street. Map © Google.
Why this score? — see what drove the D grade
The composite is a weighted blend of 9 inputs, each scored 0–100. Each bar is that input's sub-score; the figure is the points it added to the 100-point composite (weight × sub-score).
- Cash flow +10.7/30.0
- ARV discount +7.5/15.0
- Schools +6.9/10.0
- 1% rule +4.2/10.0
- Livability +4.0/5.0
- DSCR +3.1/10.0
- Rent growth +2.7/5.0
- Condition / age +2.5/5.0
- Appreciation +0.0/10.0
$139,900
🖨 Deal sheet (PDF) 📄 Offer letter ✓ Due diligence
Listing remarks
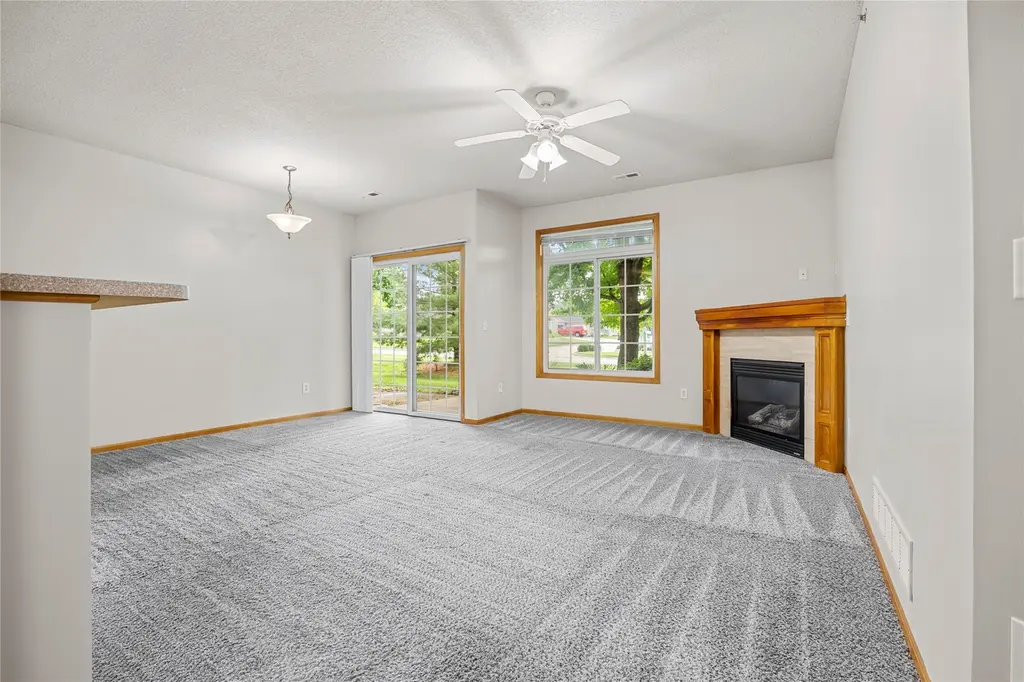
Welcome home to this well-maintained 2 bedroom, 2 bathroom ground-level condo offering easy, low-maintenance living in a convenient Grimes location. The open floor plan provides comfortable living space, while the ground-level access eliminates stairs for added convenience. HOA dues include internet, lawn care, snow removal, exterior maintenance, and common area upkeep. Enjoy being just steps from Glenstone Park featuring a playground, basketball court, shelter house, and green space. Conveniently located near shopping, restaurants, and quick access to Highway 141.
Key facts
- Ground level access
- Glenstone park
- Basketball court
Tags
Property features AI
Finance
- Financial info: Pets allowed with breed restrictions
- HOA & community: Homeowners association (The Reserve at Glenstone / Haverkamp Properties) with a $155 monthly fee
Exterior
- Parking: Detached one-car garage
- Utilities: Public water; Public sewer
- Home design: Resale property
- Construction: Vinyl siding; Asphalt shingle roof
- Exterior features: Open patio
Interior
- Kitchen: Dishwasher; Microwave; Stove; Refrigerator
- Bedrooms: 2 main-level bedrooms
- Bathrooms: 1 full bathroom; 1 three-quarter bathroom
- Heating & cooling: Central air conditioning; Forced air heating; Electric heating; Natural gas heating
- Interior features: Gas log fireplace (1)
- Laundry & utility: Washer; Dryer; Laundry on main level
Neighborhood map
What this means for you Summary
Snapshot
- This is a 2-bed/2.0-bath other listed at $140k.
Deal economics
- At list price, monthly cash flow is $-65 ($-785/yr) — negative.
- To cash-flow at today's rent, offer at most $128k (8.3% below list).
- To meet the 1% rule (rent ≥ 1% of price), the offer needs to be $129k (8.1% below list).
- Recommended offer: $128k (8.3% below list) — sets the bar for cash-flow.
- Cap rate 5.7% vs local median 2.3% in Grimes — top-decile yield for the area; either an underpriced asset or a hidden risk that comps aren't pricing in. Stress-test before assuming the spread holds.
Location & tenants
- Location reads 79/100 on livability (#106 in IA, #2,080 nationally) — a middle-class / working-renter tenant base. Strengths: crime A+, employment A+, cost of living A+; Watch: amenities F, commute F.
- Johnston Community School District (suburban): math 78% / reading 78% proficiency, ranked #24 of 289 in IA (top 8%) — strong family-tenant draw, lease renewals of 3-5y typical; only 14% free/reduced lunch — higher-income household profile.
- Zoned schools: Horizon Elementary (math 71% / reading 67%, grade A-, #263 of 616 statewide, top 43%, 647 students, 36% FRL); Summit Middle School (math 80% / reading 77%, grade A+, #44 of 246 statewide, top 19%, 1,112 students, 27% FRL); Johnston Senior High School (math 76% / reading 79%, grade A-, #56 of 336 statewide, top 17%, 1,790 students, 23% FRL).
- Market conditions: Rents flat; 329 active listings in the ZIP; 12 comparable units currently listed for rent nearby; rentals lingering (median 46d on market — plan ~5-8 weeks vacancy on turnover, expect pricing pressure); 67% of comp listings sitting > 30 days — soft ceiling on asking rent; high-income renter base; 2,953 units permitted in Polk County in 2024 (540 in 5+ unit buildings).
- This rent is only 13% of the median local income ($121k/yr) — well below the 30% rent-burden line; pricing power to push rent on renewal without tenant pushback.
Forward outlook
- Local home prices are declining (-3.0%/yr); year-one equity from $967 of loan paydown is wiped out by about $4k of value loss. Plan a longer hold.
- Polk County population projected at +37% by 2050 — long-run rental-demand tailwind backs the buy-and-hold thesis.
Negotiation context
- Only 11 days on market — expect competitive offers; lowballing is unlikely to land.
- Current owner paid $87k; list at $140k implies a 61% gain — meaningful room to come down on a strong offer.
Questions for the listing agent
- What do current leases actually rent for vs. the listed asking? Can we see a recent rent roll and the last 12 months of T-12 income?
- What does the HOA fee cover, when was the last increase, and are there any pending special assessments or reserve-fund shortfalls?
- Is there a deadline driving the sale (1031 exchange, divorce, estate, relocation)? That informs how much negotiation room exists.
- Schools are A-rated — typically a magnet for longer-tenancy family renters. What's the average tenant stay here, and is there a school-zone premium baked into asking?
- The area grade is low — what's the realistic commute time and amenity access for the typical tenant pool here? Any planned neighborhood developments (good or bad) we should know about?
- What's the average days-on-market for RENTAL listings here right now (not sales)? A rising rental-DOM trend means longer vacancies and softer asking-rent achievability than the comps imply.
- What's the recent tenant-quality profile in this submarket — average credit score on applications, eviction rate, late-payment / NSF rate, and stable-employment percentage? A property-management company in the area should have these aggregated.
- How much new for-sale + rental construction is in the pipeline within 1–3 miles? Heavy new supply typically softens prices + rents 12–24 months out; constrained supply supports both.
Investment metrics
- 1% rule
- 0.92% ✗
- Cap rate
- 5.73%
- Cash-on-cash
- -2.00%
- DSCR
- 0.91
- GRM
- 9.1
CMA / ARV
No comps found within radius.
Projected returns pro-forma
-3.0% appreciation · 0.71% rent growth · sell at horizon
- IRR
- -22.5%
- Equity multiple
- 0.24×
- Total profit
- $-29,643
- Equity at exit
- $20,860
- IRR
- -24.7%
- Equity multiple
- -0.08×
- Total profit
- $-42,164
- Equity at exit
- $12,096
Cash invested: $39,172 (down + closing). Projections, not guarantees.
Landlord ↔ Tenant lean methodology
- Overall (STATE)
- 83 Strongly Landlord-Friendly
- State Iowa
- 83 Strongly Landlord-Friendly · R+6
- County
- — inherits STATE
- City
- — inherits STATE
ZIP-level market 50111
- Home prices YoY
- -11.1%
- Rents YoY
- 0.7%
- Active inventory
- 329
- Price-to-rent
- 9.1×
Monthly cashflow live
- Estimated rent
- $1,285 high interval (Pro) →
- Mortgage (P&I)
- −$734
- Tax from tax record
- −$134 /mo · $1,606/yr
- Insurance
- −$58
- HOA
- −$155
- Vacancy / Maint / Mgmt
- −$270
- Net cashflow
- $-65
Break-even live
Sensitivity live
| Price | -10% $14 | -5% $-26 | +0% $-65 | +5% $-105 | +10% $-145 |
|---|---|---|---|---|---|
| Rent | -10% $-167 | -5% $-116 | +0% $-65 | +5% $-15 | +10% $36 |
| Rate | -1.0pp $5 | -0.5pp $-30 | base $-65 | +0.5pp $-102 | +1.0pp $-139 |
UW: 25.0% down · 7.5% · 30yr · 1.5% tax · 5.0% vac · 8.0% maint · 8.0% mgmt
Financing live
Cash to close
- Down payment
- $34,975
- Closing costs
- $4,197
- Reserves months
- —
- Total cash needed
- —
Loan-product check · same deal, 3 products live
Conventional
25% down · 7.5% · 30yr
- Down + closing
- —
- Monthly P&I
- —
- Monthly cashflow
- —
- DSCR
- —
- Eligible?
- —
Personal DTI + credit; lowest rate.
DSCR
20% down · 8.5% · 30yr
- Down + closing
- —
- Monthly P&I
- —
- Monthly cashflow
- —
- DSCR
- —
- Eligible?
- —
No personal income docs; deal must DSCR.
Hard money
10% down · 12.0% · 12mo
- Down + closing
- —
- Monthly P&I
- —
- Monthly cashflow
- —
- DSCR
- —
- Eligible?
- —
Short-term bridge; refi at stabilization.
Rent comps 12 comps
| Address | Beds | Baths | Sqft | Rent | $/sqft | DOM | Units | Dist |
|---|---|---|---|---|---|---|---|---|
| 6030 Bremen Ct #13 Johnston, IA | 2.0 | 2.0 | 1014 | $1,195 | $1.18 | 46d | 1 | 0.66mi |
| 10320 Norfolk Dr #4 Johnston, IA | 2.0 | 2.0 | 1014 | $1,345 | $1.33 | 25d | 1 | 0.67mi |
| 10535 Norfolk Dr Johnston, IA | 2.0–3.0 | 2.0 | 1099 | $1,295 | $1.18 | 46d | 1 | 0.70mi |
| 10516 Dorset Dr Unit 23 Johnston, IA | 2.0 | 2.0 | 990 | $1,290 | $1.30 | 46d | 1 | 0.74mi |
| 9577 White Oak Ln Johnston, IA | 2.0 | 2.0 | 970 | $1,264 | $1.30 | 16d | 4 | 0.76mi |
| 10457 Dorset Dr Unit 22 Johnston, IA | 2.0 | 2.0 | 990 | $1,290 | $1.30 | 46d | 1 | 0.79mi |
| 10509 Dorset Dr Unit 6120-01 Johnston, IA | 2.0 | 2.0 | 1014 | $1,225 | $1.21 | 46d | 1 | 0.79mi |
| 10509 Dorset Dr Unit 6120-23 Johnston, IA | 2.0 | 2.0 | 1014 | $1,175 | $1.16 | 46d | 1 | 0.79mi |
| 10301 Dorset Dr Unit 01 Johnston, IA | 2.0 | 2.0 | 990 | $1,340 | $1.35 | 46d | 1 | 0.81mi |
| 10141 Sutton Dr Urbandale, IA | 2.0 | 1.0 | 864 | $1,150 | $1.33 | 46d | 1 | 1.03mi |
| 935 SE Silkwood Ln Grimes, IA | 1.0–2.0 | 1.0–2.0 | 914 | $1,436 | $1.57 | 16d | 27 | 1.41mi |
| 8650 Crescent Chase Johnston, IA | 2.0 | 2.0 | 950 | $1,009 | $1.06 | 16d | 6 | 1.44mi |
HOA detail
- Monthly dues
- $155 · $1,860/yr
- Likely covers
- internetlandscapingsnow removalexterior maint.
Listing history 8 events
-
2026-06-21days on market $139,900 Active 11 DOM
-
2026-06-18days on market $139,900 Active 8 DOM
-
2026-06-17days on market $139,900 Active 7 DOM
-
2026-06-16days on market $139,900 Active 6 DOM
-
2026-06-15days on market $139,900 Active 5 DOM
-
2026-06-14days on market $139,900 Active 3 DOM
-
2026-06-13remarks 571-char remark
-
2026-06-13$139,900 Active 2 DOM
ⓘ Source: listings_history table (triggers on properties + properties_extension) + one-shot
backfill from property_details.listing_events for pre-trigger history.
Tax reassessment forecast IA · Partial reset (capped growth)
- Current annual tax
- $1,606 · $134/mo
- Projected year-2 tax
- $1,901 · $158/mo
- Expected delta
- +$295/yr (+$25/mo · 18.4%)
ⓘ Screening estimate from a state-policy table — verify with the county assessor before closing.
Nearby sold comps map
Loading sold comps map…
Walkable amenities ~0.75 mi
Loading nearby amenities…
Taxation est. · year 1
- Rental income
- $15,423
- − Mortgage interest
- −$7,837
- − Property taxes
- −$1,606
- − Insurance
- −$700
- − Repairs & maintenance
- −$1,234
- − Management
- −$1,234
- − HOA
- −$1,860
- − Depreciation
- −$4,070
- Taxable loss
- −$3,117
- Est. tax savings @ 24.0%
- +$748
- After-tax cash flow
- $-37/yr
For passive investors: Depreciation is non-cash, so a rental often shows a tax loss while cash-flowing — sheltering income. Rental losses are passive: they offset passive income freely, and up to $25,000/yr can offset ordinary (W-2) income if you actively participate and your MAGI is under $100k (phasing out to $0 by $150k); unused losses carry forward. On sale, claimed depreciation is recaptured at up to 25%, and gains may owe capital-gains tax (a 1031 exchange can defer both). Figures are a year-1 estimate at your 24.0% rate — not tax advice; consult a CPA.
Schools (NCES district)
- District
- Johnston Community School District
- NCES district ID
- 1915450
- Math proficiency
- 78% ▼ -6.00%
- Reading proficiency
- 78% ▼ -3.00%
- Median HH income
- $85,758
- Composite
- 69.43/100
- National rank
- #309
- State rank
- #24 of 289 in IA
Livability — Grimes
- Score
- 79/100
- State rank
- #106
- US rank
- #2080
Category grades
Schools grade is shown separately in the Schools card above.
Census & demographics
- Census place
- Grimes, IA
- County
- Polk County · 453,298 people
- City population
- 16,865
- Metro
- Des Moines-West Des Moines, IA
- Population (ZIP)
- 16,865
- Household income
- $120,769
- Rent vs Own
- Severe rent burden
- 249.0
Population outlook (Polk County) Hauer SSP2
- Today (2025)
- 548,042 people
- By 2030
- 588,557 · +7.4%
- By 2040
- 670,629 · +22.4%
- By 2050
- 752,830 · +37.4%
- By 2075
- 955,069 · +74.3%
- By 2100
- 1,115,436 · +103.5%
Race, ethnicity, and origin ACS 2023
- Neighborhood character
- Predominantly White (85%)
- Race & ethnicity
- White 85% Hispanic / Latino 6% Two or more races 5% Asian 3% Black 2%
- Hispanic origin (detail)
- Mexican 4%
- Common ancestry
- Portuguese 3% Italian 3% Iranian 2%
- Foreign-born
- 6% · China, Canada
- Languages at home
- 92% English-only · Other Asian/Pacific 3% Spanish 2% Other Indo-European 1%
Political lean MEDSL · Polk
- 2024 margin
- D (+10.9) · D 54.8% · R 43.9% · Other 1.3%
- 2008→2024 swing
- -3.7pp toward R · 2008: 14.6pp · 2024: 10.9pp
- All cycles
- 2024: D+10.9 2020: D+15.2 2016: D+11.5 2012: D+14.2 2008: D+14.6
Not yet ingested
- Civics
- —
Market trends
- HPI YoY
- ▼ -30.93%
- Current HPI
- 249.0614
- Rent YoY
- ▲ 0.71%
- Metro
- Des Moines-West Des Moines, IA
- State GDP YoY
- ▲ 2.48%
- F500 in state
- 4
Industry mix (Fortune 500 HQ in IA)
| Industry | F500 HQs | Revenue |
|---|---|---|
| Financial Services | 1 | $16B |
|
||
| Retail / Convenience | 1 | $15B |
|
||
Price history
+60.8% since first listed2 events — show timeline
- 2026-06-10 Listed $139,900 DMMLS
- 2022-10-26 Sold (Public Records) $87,000 Public Records
Property tax history
+1.2%/yrLatest (2025): $1,606 · +3.1% YoY. Source: county tax records.
Cash-flow waterfall
monthlySold comps — $/sqft
last 12 mo · ≤1 miLoading sold comps…