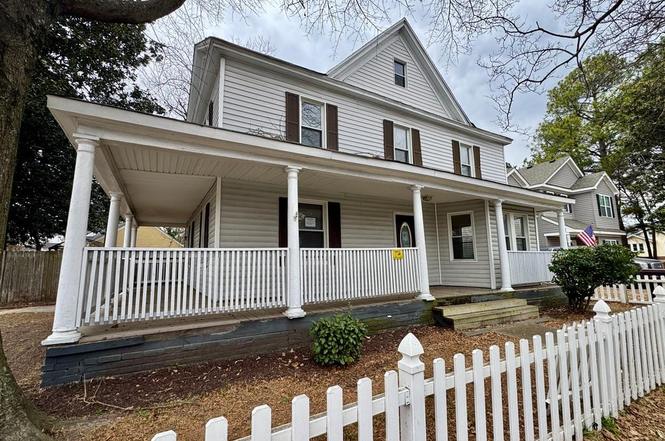
3608 Bainbridge Blvd · Chesapeake, VA
Flood risk 3/10 · Minor
- FEMA flood zone
- X (unshaded)
- Chance of flooding over 30 yrs
- 0.1%
- Est. flood insurance / yr
- $507 – $1,088
Fire risk 1/10 · Minimal
- Est. fire insurance / yr
- $666 – $1,236
Heat risk 9/10 · Severe
- Hot days now (above 106°F)
- 7 days/yr
- Hot days in 30 yrs
- 16 days/yr
Wind risk 8/10 · Major
- Chance of severe wind over 30 yrs
- 80.0%
Air-quality risk 5/10 · Moderate
- Unhealthy air days now
- 6 days/yr
- Unhealthy air days in 30 yrs
- 7 days/yr
Risk factors via First Street. Map © Google.
Why this score? — see what drove the C+ grade
The composite is a weighted blend of 9 inputs, each scored 0–100. Each bar is that input's sub-score; the figure is the points it added to the 100-point composite (weight × sub-score).
- Cash flow +19.7/30.0
- ARV discount +15.0/15.0
- DSCR +6.2/10.0
- Schools +5.8/10.0
- 1% rule +5.2/10.0
- Livability +3.5/5.0
- Rent growth +2.5/5.0
- Condition / age +2.5/5.0
- Appreciation +0.0/10.0
$264,900
🖨 Deal sheet (PDF) 📄 Offer letter ✓ Due diligence
Listing remarks
This spacious 5-bedroom, 3-bath home with over 3,000 square feet of living space is waiting for your personal touch! With some updating and TLC, this home has incredible potential to truly shine. Featuring a generous floor plan with large living spaces. Situated on a spacious lot, there’s plenty of room to create your own outdoor oasis! Conveniently located near dining, shopping, the Interstate, and more! Call today for more information and to schedule your tour!
Key facts
- 7,143 sq ft lot
- Built 1952
- Listed 126 days
Property features AI
Finance
- HOA & community: No HOA fees
Exterior
- Parking: Driveway parking spaces
- Utilities: City/County water; City/County sewer; Electric water heater
- Home design: Detached Victorian-style home; 2 stories; Crawl foundation
- Construction: Asphalt shingle roof
- Exterior features: Vinyl siding; Back fenced yard
Interior
- Bedrooms: Bedroom and full bathroom on the first floor; Total rooms: 10
- Flooring: Carpet
- Bathrooms: 3 full bathrooms
- Heating & cooling: Central air conditioning; Forced hot air heating
- Interior features: Carpet flooring
Neighborhood map
What this means for you Summary
Snapshot
- This is a 5-bed/3.0-bath single-family listed at $265k.
Deal economics
- At list price, monthly cash flow is $312 ($4k/yr) — positive.
- The deal already cash-flows at list — no discount required.
- Meets the 1% rule at list price ($3k rent vs $265k).
- Recommended offer: $233k (12.0% below list) — sets the bar for market timing.
- Cap rate 7.7% vs local median 3.7% in Chesapeake — top-decile yield for the area; either an underpriced asset or a hidden risk that comps aren't pricing in. Stress-test before assuming the spread holds.
Location & tenants
- Location reads 70/100 on livability (#236 in VA) — a middle-class / working-renter tenant base. Strengths: employment A+, housing A+; Watch: crime C-, cost of living C-, amenities F.
- Chesapeake City Public School District (suburban): math 58% / reading 74% proficiency, ranked #31 of 131 in VA (top 24%) — acceptable for families but not a draw, mixed tenant base, ~2y average lease.
- Zoned schools: Portlock Primary (541 students, 93% FRL); Oscar F. Smith High (math 63% / reading 75%, grade B, #170 of 319 statewide, top 55%, 2,291 students, 70% FRL) — zoned schools average 82% FRL vs 28% district-wide (54 pts higher); higher-poverty schools than district average — tighter screening recommended.
- Market conditions: 116 active listings in the ZIP; 1 comparable units currently listed for rent nearby; 597 units permitted in Chesapeake city in 2024 (0 in 5+ unit buildings).
- At $2,714/mo this rent would consume 57% of the median local household income ($57k/yr) (locally 1301% of renters already pay >50% of income on rent) — very limited rent-growth headroom before tenants either downsize or default.
Forward outlook
- Local home prices are declining (-3.0%/yr); year-one equity from $2k of loan paydown is wiped out by about $8k of value loss. Plan a longer hold.
- Chesapeake County population projected at +21% by 2050 — long-run rental-demand tailwind backs the buy-and-hold thesis.
Negotiation context
- It's been on market 126 days — a 12% lower offer ($233k) is reasonable based on typical stale-listing flexibility.
- 5 sale attempts since 9y ago; this cycle's ask has dropped $58k (18%) from the opening price — seller is motivated, your offer sets the floor, not the list.
Risks & watch-outs
- Watch-outs: built in 1952 — expect roof / HVAC / electrical / plumbing capex.
- Climate carrying-cost: severe wind risk, 80% chance of damaging wind over 30y; extreme-heat days projected 7→16/yr by 2055 (HVAC capex compounding) — expect insurance premiums to compound above CPI over the hold.
Questions for the listing agent
- It's been on market 126 days. Have you received any prior offers? Is the seller open to a 12% concession, seller financing, or rate buy-down credit?
- Built in 1952 — when were the roof, HVAC, electrical panel, plumbing, and water heater last replaced?
- Why hasn't it sold? Are there any deal-killer items the seller is aware of (foundation, flood, title, zoning, code violations)?
- Is there a deadline driving the sale (1031 exchange, divorce, estate, relocation)? That informs how much negotiation room exists.
- Schools are A-rated — typically a magnet for longer-tenancy family renters. What's the average tenant stay here, and is there a school-zone premium baked into asking?
- What's the average days-on-market for RENTAL listings here right now (not sales)? A rising rental-DOM trend means longer vacancies and softer asking-rent achievability than the comps imply.
- What's the recent tenant-quality profile in this submarket — average credit score on applications, eviction rate, late-payment / NSF rate, and stable-employment percentage? A property-management company in the area should have these aggregated.
- How much new for-sale + rental construction is in the pipeline within 1–3 miles? Heavy new supply typically softens prices + rents 12–24 months out; constrained supply supports both.
Investment metrics
- 1% rule
- 1.02% ✓
- Cap rate
- 7.71%
- Cash-on-cash
- 5.05%
- DSCR
- 1.22
- GRM
- 8.1
CMA / ARV
- ARV (on-the-fly)
- $475,952
- Comps found
- 2
Show comp detail 2 sales within ~0.75 mi
| Address | Dist | Beds/Ba | Sqft | Sold | Price | $/sf | Match |
|---|---|---|---|---|---|---|---|
| 1732 2nd St | 0.26mi | 4/3.0 (-1) | 3,015 (-4%) | 18mo | $375,000 | $124 | 61 |
| 424 Rutgers Ave | 0.40mi | 6/4.0 (+1) | 3,320 (+5%) | 8mo | $499,900 | $151 | 56 |
Match score weights: distance 35% · size 25% · config 20% · recency 20%. Top-matched comps best support the ARV.
Projected returns pro-forma
-3.0% appreciation · 3.0% rent growth · sell at horizon
- IRR
- -8.4%
- Equity multiple
- 0.69×
- Total profit
- $-22,989
- Equity at exit
- $39,497
- IRR
- 1.1%
- Equity multiple
- 1.08×
- Total profit
- $5,768
- Equity at exit
- $22,904
Cash invested: $74,172 (down + closing). Projections, not guarantees.
Landlord ↔ Tenant lean methodology
- Overall (STATE)
- 55 Moderately Landlord-Leaning
- State Virginia
- 55 Moderately Landlord-Leaning · D+2
- County
- — inherits STATE
- City
- — inherits STATE
ZIP-level market 23324
- Home prices YoY
- -17.3%
- Active inventory
- 116
- Price-to-rent
- 8.1×
Monthly cashflow live
- Estimated rent
- $2,714 medium interval (Pro) →
- Mortgage (P&I)
- −$1,389
- Tax from tax record
- −$332 /mo · $3,981/yr
- Insurance
- −$110
- HOA
- −$0
- Vacancy / Maint / Mgmt
- −$570
- Net cashflow
- $312
Break-even live
Sensitivity live
| Price | -10% $462 | -5% $387 | +0% $312 | +5% $237 | +10% $162 |
|---|---|---|---|---|---|
| Rent | -10% $98 | -5% $205 | +0% $312 | +5% $420 | +10% $527 |
| Rate | -1.0pp $446 | -0.5pp $380 | base $312 | +0.5pp $244 | +1.0pp $174 |
UW: 25.0% down · 7.5% · 30yr · 1.5% tax · 5.0% vac · 8.0% maint · 8.0% mgmt
Financing live
Cash to close
- Down payment
- $66,225
- Closing costs
- $7,947
- Reserves months
- —
- Total cash needed
- —
Loan-product check · same deal, 3 products live
Conventional
25% down · 7.5% · 30yr
- Down + closing
- —
- Monthly P&I
- —
- Monthly cashflow
- —
- DSCR
- —
- Eligible?
- —
Personal DTI + credit; lowest rate.
DSCR
20% down · 8.5% · 30yr
- Down + closing
- —
- Monthly P&I
- —
- Monthly cashflow
- —
- DSCR
- —
- Eligible?
- —
No personal income docs; deal must DSCR.
Hard money
10% down · 12.0% · 12mo
- Down + closing
- —
- Monthly P&I
- —
- Monthly cashflow
- —
- DSCR
- —
- Eligible?
- —
Short-term bridge; refi at stabilization.
Rent comps 1 comps
| Address | Beds | Baths | Sqft | Rent | $/sqft | DOM | Units | Dist |
|---|---|---|---|---|---|---|---|---|
| 4110 Hamilton St Chesapeake, VA | 4.0 | 2.5 | 2400 | $3,000 | $1.25 | 24d | 1 | 0.39mi |
Listing history 26 events
-
2026-05-21status Under Contract
-
2026-05-02price $264,900
-
2026-03-10price $284,900
-
2026-02-20price $295,900
-
2026-02-05price $319,900
-
2026-01-22status Active
-
2026-01-22historical
-
2026-01-14$322,900 Active
-
2022-10-03soldstatus $288,000
-
2022-09-12status Under Contract
-
2022-09-06historical Active Under Contract
-
2022-08-23price $300,000
-
2022-08-10$269,900 Active
-
2018-02-08soldstatus $199,000
-
2017-12-27status Under Contract
-
2017-11-28price $199,000
-
2017-11-21price $209,000
-
2017-10-30price $210,000
-
2017-10-11price $217,500
-
2017-10-02price $218,000
-
2017-09-19$220,000 Active
-
2017-08-21historical
-
2017-08-15price $222,500
-
2017-07-26$225,000 Active
-
2006-09-22soldstatus $229,000
-
2005-04-20soldstatus $52,000
ⓘ Source: listings_history table (triggers on properties + properties_extension) + one-shot
backfill from property_details.listing_events for pre-trigger history.
Tax reassessment forecast VA · Resets to sale price
- Current annual tax
- $3,981 · $332/mo
- Projected year-2 tax
- $3,981 · $332/mo
- Expected delta
- $0/yr ($0/mo · 0.0%)
ⓘ Screening estimate from a state-policy table — verify with the county assessor before closing.
Climate risk First Street
- Flood 3/10 Moderate FEMA zone X (unshaded) · 10% chance over 30 yrs
- Wildfire 1/10 Low
- Heat 9/10 Extreme 7 d/yr ≥106°F today · 16 d/yr by 30 yrs out
- Wind 8/10 Severe 80% chance of damaging wind over 30 yrs
- Air quality 5/10 Major 6 unhealthy d/yr today · 7 by 30 yrs out
Nearby sold comps map
Loading sold comps map…
Walkable amenities ~0.75 mi
Loading nearby amenities…
Taxation est. · year 1
- Rental income
- $32,562
- − Mortgage interest
- −$14,839
- − Property taxes
- −$3,981
- − Insurance
- −$1,324
- − Repairs & maintenance
- −$2,605
- − Management
- −$2,605
- − Depreciation
- −$7,706
- Taxable loss
- −$498
- Est. tax savings @ 24.0%
- +$120
- After-tax cash flow
- $3,868/yr
For passive investors: Depreciation is non-cash, so a rental often shows a tax loss while cash-flowing — sheltering income. Rental losses are passive: they offset passive income freely, and up to $25,000/yr can offset ordinary (W-2) income if you actively participate and your MAGI is under $100k (phasing out to $0 by $150k); unused losses carry forward. On sale, claimed depreciation is recaptured at up to 25%, and gains may owe capital-gains tax (a 1031 exchange can defer both). Figures are a year-1 estimate at your 24.0% rate — not tax advice; consult a CPA.
Schools (NCES district)
- District
- Chesapeake City Public School District
- NCES district ID
- 5100810
- Math proficiency
- 58% ▼ -29.00%
- Reading proficiency
- 74% ▼ -7.00%
- Median HH income
- $69,356
- Composite
- 57.84/100
- National rank
- #1047
- State rank
- #31 of 131 in VA
Livability — Chesapeake
- Score
- 70/100
- State rank
- #236
- US rank
- #7942
Category grades
Schools grade is shown separately in the Schools card above.
Census & demographics
- Census place
- Chesapeake, VA
- County
- Chesapeake City · 253,091 people
- City population
- 253,091
- Metro
- Virginia Beach-Norfolk-Newport News, VA-NC
- Population (ZIP)
- 24,670
- Household income
- $57,045
- Rent vs Own
- Severe rent burden
- 1301.0
Population outlook (Chesapeake County) Hauer SSP2
- Today (2025)
- 263,804 people
- By 2030
- 276,798 · +4.9%
- By 2040
- 299,906 · +13.7%
- By 2050
- 318,284 · +20.7%
- By 2075
- 362,137 · +37.3%
- By 2100
- 372,225 · +41.1%
Race, ethnicity, and origin ACS 2023
- Neighborhood character
- Diverse neighborhood (Simpson 0.59)
- Race & ethnicity
- Black 58% White 27% Two or more races 9% Hispanic / Latino 9% Asian 1%
- Hispanic origin (detail)
- Mexican 3% Puerto Rican 4%
- Common ancestry
- Slovak 2% Italian 2% Romanian 1%
- Foreign-born
- 4% · Canada
- Languages at home
- 92% English-only · Spanish 6% French/Haitian/Cajun 1% Other Indo-European 1%
Political lean MEDSL · Chesapeake
- 2024 margin
- Toss-up / Even · D 51.3% · R 47.5% · Other 1.2%
- 2008→2024 swing
- +2.5pp toward D · 2008: 1.3pp · 2024: 3.8pp
- All cycles
- 2024: D+3.8 2020: D+6.5 2016: R+1.3 2012: D+1.1 2008: D+1.3
Not yet ingested
- Civics
- —
Market trends
- HPI YoY
- ▼ -66.73%
- Current HPI
- 319.2653
- Rent YoY
- —
- Metro
- Virginia Beach-Norfolk-Newport News, VA-NC
- State GDP YoY
- ▲ 2.40%
- F500 in state
- 50
Industry mix (Fortune 500 HQ in VA)
| Industry | F500 HQs | Revenue |
|---|---|---|
| Aerospace / Defense | 4 | $236B |
|
||
| Technology / Defense | 3 | $32B |
|
||
| Financial Services | 2 | $176B |
|
||
| Utilities | 2 | $27B |
|
||
| Insurance | 2 | $25B |
|
||
| Technology | 2 | $15B |
|
||
Price history
+409.4% since first listed26 events — show timeline
- 2026-05-21 Pending — REINMLS
- 2026-05-02 Price Changed $264,900 REINMLS
- 2026-03-10 Price Changed $284,900 REINMLS
- 2026-02-20 Price Changed $295,900 REINMLS
- 2026-02-05 Price Changed $319,900 REINMLS
- 2026-01-22 Relisted — REINMLS
- 2026-01-22 Listing Removed — REINMLS
- 2026-01-14 Listed $322,900 REINMLS
- 2022-10-03 Sold (Public Records) $288,000 Public Records
- 2022-09-12 Pending — REINMLS
- 2022-09-06 Contingent — REINMLS
- 2022-08-23 Price Changed $300,000 REINMLS
- 2022-08-10 Listed $269,900 REINMLS
- 2018-02-08 Sold (Public Records) $199,000 Public Records
- 2017-12-27 Pending — REINMLS
- 2017-11-28 Price Changed $199,000 REINMLS
- 2017-11-21 Price Changed $209,000 REINMLS
- 2017-10-30 Price Changed $210,000 REINMLS
- 2017-10-11 Price Changed $217,500 REINMLS
- 2017-10-02 Price Changed $218,000 REINMLS
- 2017-09-19 Listed $220,000 REINMLS
- 2017-08-21 Listing Removed — REINMLS
- 2017-08-15 Price Changed $222,500 REINMLS
- 2017-07-26 Listed $225,000 REINMLS
- 2006-09-22 Sold (Public Records) $229,000 Public Records
- 2005-04-20 Sold (Public Records) $52,000 Public Records
Property tax history
+4.4%/yrLatest (2025): $3,981 · +7.6% YoY. Source: county tax records.
Cash-flow waterfall
monthlySold comps — $/sqft
last 12 mo · ≤1 miLoading sold comps…