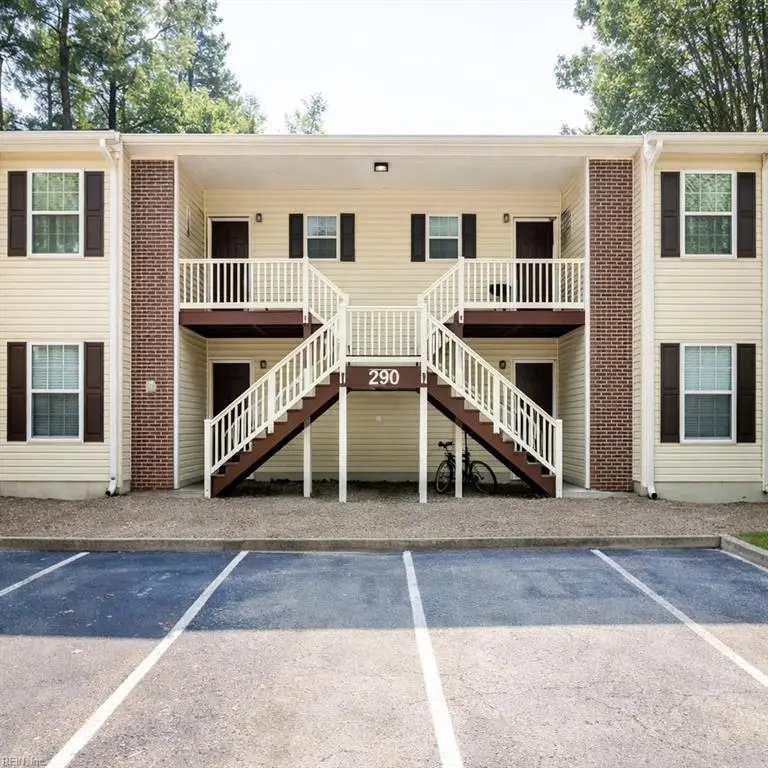
290 Patriot Ln Unit D · Williamsburg, VA
Flood risk 1/10 · Minimal
- FEMA flood zone
- X (unshaded)
- Chance of flooding over 30 yrs
- 0.0%
- Est. flood insurance / yr
- $507 – $1,088
Fire risk 3/10 · Minor
- Est. fire insurance / yr
- $666 – $1,236
Heat risk 8/10 · Major
- Hot days now (above 107°F)
- 7 days/yr
- Hot days in 30 yrs
- 16 days/yr
Wind risk 6/10 · Moderate
- Chance of severe wind over 30 yrs
- 63.0%
Air-quality risk 2/10 · Minimal
- Unhealthy air days now
- 1 days/yr
- Unhealthy air days in 30 yrs
- 1 days/yr
Risk factors via First Street. Map © Google.
Why this score? — see what drove the D+ grade
The composite is a weighted blend of 9 inputs, each scored 0–100. Each bar is that input's sub-score; the figure is the points it added to the 100-point composite (weight × sub-score).
- Cash flow +15.6/30.0
- ARV discount +7.5/15.0
- Schools +5.6/10.0
- 1% rule +5.3/10.0
- DSCR +4.8/10.0
- Livability +4.2/5.0
- Rent growth +3.8/5.0
- Condition / age +2.5/5.0
- Appreciation +0.0/10.0
$189,990
🖨 Deal sheet 📄 Offer letter ✓ Due diligence
Listing remarks
Enjoy low-maintenance living in this first-floor condo, ideally located just over a mile from the Williamsburg Outlets. The spacious kitchen offers plenty of room to cook and entertain, while the in-unit washer and dryer add everyday convenience. Nestled near major commuter routes and surrounded by dining, shopping, and entertainment, this home combines comfort with unbeatable accessibility. A perfect blend of style and location!
Key facts
- Spacious kitchen
- First floor condo
- $290 HOA
Tags
Property features AI
Finance
- Other: Neighborhood: PATRIOT LANE CONDOS
- HOA & community: HOA (Patriot Lane Condominiums) with ground maintenance; Monthly HOA fee: $290; Association management: Town Management (757-565-6200)
Exterior
- Parking: One assigned/reserved parking space
- Utilities: City/County water; City/County sewer; Electric water heater; Electric service
- Home design: Attached condo; Traditional style; One living level; One story; Condo unit on level 1; Foyer entry
- Construction: Slab foundation; Asphalt shingle roof
- Exterior features: Brick and vinyl siding
Interior
- Kitchen: Electric range; Microwave; Dishwasher; Garbage disposal; Refrigerator
- Bedrooms: First-floor master bedroom; Bedroom and full bathroom on first floor; Total rooms: 5 (includes foyer)
- Flooring: Carpet; Ceramic; Vinyl
- Bathrooms: 2 full bathrooms
- Heating & cooling: Heat pump heating; Central air conditioning
- Interior features: Decorative fireplace
- Laundry & utility: Washer; Dryer
Neighborhood map
What this means for you Summary
Snapshot
- This is a 2-bed/2.0-bath condo listed at $190k.
Deal economics
- At list price, monthly cash flow is $80 ($957/yr) — positive.
- The deal already cash-flows at list — no discount required.
- Meets the 1% rule at list price ($2k rent vs $190k).
- Recommended offer: $179k (6.0% below list) — sets the bar for market timing.
- Cap rate 6.8% vs local median 3.1% in Williamsburg — top-decile yield for the area; either an underpriced asset or a hidden risk that comps aren't pricing in. Stress-test before assuming the spread holds.
Location & tenants
- Location reads 84/100 on livability (#31 in VA, #734 nationally) — a professional / high-income tenant draw. Strengths: amenities A+, commute A+, health & safety A+; Watch: cost of living D.
- Williamsburg-James City Public School District (suburban): math 60% / reading 73% proficiency, ranked #36 of 131 in VA (top 28%) — acceptable for families but not a draw, mixed tenant base, ~2y average lease.
- Zoned schools: Matthew Whaley Elementary (math 57% / reading 67%, grade B, #480 of 1,108 statewide, top 46%, 435 students, 72% FRL); Warhill High (math 66% / reading 84%, grade A-, #106 of 319 statewide, top 33%, 1,322 students, 36% FRL) — zoned schools average 54% FRL vs 27% district-wide (27 pts higher); higher-poverty schools than district average — tighter screening recommended.
- Market conditions: Rents rising fast (+5.2%/yr); 390 active listings in the ZIP; 10 comparable units currently listed for rent nearby; rentals leasing fast (median 2d on market — plan ~1-2 weeks tenant-placement turnaround); solid renter incomes; 10 units permitted in Williamsburg city in 2024 (0 in 5+ unit buildings).
Forward outlook
- Local home prices are declining (-3.0%/yr); year-one equity from $1k of loan paydown is wiped out by about $6k of value loss. Plan a longer hold.
- Williamsburg County population projected at +44% by 2050 — long-run rental-demand tailwind backs the buy-and-hold thesis.
Negotiation context
- It's been on market 86 days — a 6% lower offer ($179k) is reasonable based on typical stale-listing flexibility.
- 6 sale attempts since 7y ago; this cycle's ask has dropped $10k (5%) from the opening price — seller is motivated, your offer sets the floor, not the list.
- Current owner paid $152k; 25% above their basis — modest negotiation headroom, anchor on the comps not their cost.
Risks & watch-outs
- Climate carrying-cost: major wind risk, 63% chance of damaging wind over 30y; extreme-heat days projected 7→16/yr by 2055 (HVAC capex compounding) — expect insurance premiums to compound above CPI over the hold.
Questions for the listing agent
- It's been on market 86 days. Have you received any prior offers? Is the seller open to a 6% concession, seller financing, or rate buy-down credit?
- What does the HOA fee cover, when was the last increase, and are there any pending special assessments or reserve-fund shortfalls?
- Any open or pending special assessments — roof, HVAC, plumbing, elevator, façade? What's the per-unit balance and payoff schedule, and is the seller paying it off at close or rolling it to the buyer?
- Why hasn't it sold? Are there any deal-killer items the seller is aware of (foundation, flood, title, zoning, code violations)?
- Is there a deadline driving the sale (1031 exchange, divorce, estate, relocation)? That informs how much negotiation room exists.
- Schools are A-rated — typically a magnet for longer-tenancy family renters. What's the average tenant stay here, and is there a school-zone premium baked into asking?
- The area grade is low — what's the realistic commute time and amenity access for the typical tenant pool here? Any planned neighborhood developments (good or bad) we should know about?
- What's the average days-on-market for RENTAL listings here right now (not sales)? A rising rental-DOM trend means longer vacancies and softer asking-rent achievability than the comps imply.
- What's the recent tenant-quality profile in this submarket — average credit score on applications, eviction rate, late-payment / NSF rate, and stable-employment percentage? A property-management company in the area should have these aggregated.
- How much new apartment / multifamily construction is in the pipeline within 1–3 miles? Heavy new supply (>2% of stock underway) typically softens rents 12–24 months out; light construction supports rent growth.
Investment metrics
- 1% rule
- 1.03% ✓
- Cap rate
- 6.80%
- Cash-on-cash
- 1.80%
- DSCR
- 1.08
- GRM
- 8.1
CMA / ARV
No comps found within radius.
Projected returns pro-forma
-3.0% appreciation · 5.21% rent growth · sell at horizon
- IRR
- -10.7%
- Equity multiple
- 0.60×
- Total profit
- $-21,156
- Equity at exit
- $28,328
- IRR
- 1.8%
- Equity multiple
- 1.14×
- Total profit
- $7,637
- Equity at exit
- $16,427
Cash invested: $53,197 (down + closing). Projections, not guarantees.
Landlord ↔ Tenant lean methodology
- Overall (STATE)
- 55 Moderately Landlord-Leaning
- State Virginia
- 55 Moderately Landlord-Leaning · D+2
- County
- — inherits STATE
- City
- — inherits STATE
ZIP-level market 23185
- Rents YoY
- 5.2%
- Active inventory
- 390
- Price-to-rent
- 8.1×
Monthly cashflow live
- Estimated rent
- $1,951 high interval (Pro) →
- Mortgage (P&I)
- −$996
- Tax from tax record
- −$96 /mo · $1,149/yr
- Insurance
- −$79
- HOA
- −$290
- Vacancy / Maint / Mgmt
- −$410
- Net cashflow
- $80
Break-even live
UW: 25.0% down · 7.5% · 30yr · 1.5% tax · 5.0% vac · 8.0% maint · 8.0% mgmt
Financing live
Cash to close
- Down payment
- $47,498
- Closing costs
- $5,700
- Reserves months
- —
- Total cash needed
- —
Loan-product check · same deal, 3 products live
Conventional
25% down · 7.5% · 30yr
- Down + closing
- —
- Monthly P&I
- —
- Monthly cashflow
- —
- DSCR
- —
- Eligible?
- —
Personal DTI + credit; lowest rate.
DSCR
20% down · 8.5% · 30yr
- Down + closing
- —
- Monthly P&I
- —
- Monthly cashflow
- —
- DSCR
- —
- Eligible?
- —
No personal income docs; deal must DSCR.
Hard money
10% down · 12.0% · 12mo
- Down + closing
- —
- Monthly P&I
- —
- Monthly cashflow
- —
- DSCR
- —
- Eligible?
- —
Short-term bridge; refi at stabilization.
Rent comps 10 comps
| Address | Beds | Baths | Sqft | Rent | $/sqft | DOM | Units | Dist |
|---|---|---|---|---|---|---|---|---|
| 5302 Aden Ct Williamsburg, VA | 2.0 | 2.0 | 1364 | $1,700 | $1.25 | 3d | 1 | 0.47mi |
| 5403 Sasha Ct Williamsburg, VA | 3.0 | 1.5 | 1407 | $1,850 | $1.31 | 1d | 1 | 0.51mi |
| 5302 Lane Place Dr Williamsburg, VA | 1.0–2.0 | 1.0–2.0 | 873 | $1,675 | $1.92 | 1d | 7 | 0.98mi |
| 5302 Lane Place Dr Williamsburg, VA | 1.0–3.0 | 1.0–2.0 | 1069 | $1,738 | $1.62 | 17d | 5 | 0.98mi |
| 100 Whitworth Way Williamsburg, VA | 1.0–3.0 | 1.0–2.0 | 964 | $2,103 | $2.18 | 1d | 14 | 1.00mi |
| 155 Sterling Manor Dr Williamsburg, VA | 1.0–3.0 | 1.0–3.5 | 1588 | $2,404 | $1.51 | 1d | 13 | 1.16mi |
| 203 Bristol Cmn Williamsburg, VA | 2.0 | 2.0 | 1159 | $2,100 | $1.81 | 1d | 1 | 1.17mi |
| 100 Glenburnie Rd Williamsburg, VA | 1.0–3.0 | 1.0–2.0 | 1198 | $2,092 | $1.75 | 1d | 20 | 1.29mi |
| 150 Kings Manor Dr Williamsburg, VA | 1.0–3.0 | 1.0–3.0 | 1295 | $2,846 | $2.20 | 1d | 23 | 1.33mi |
| 1400 Middle St Williamsburg, VA | 1.0–2.0 | 1.0 | 686 | $1,565 | $2.28 | 1d | 1 | 1.37mi |
HOA detail condo
- Monthly dues
- $290 · $3,480/yr
- Assessments
- None detected in remarks — confirm with the listing agent.
Listing history 28 events
-
2026-06-18days on market $189,990 Active 86 DOM
-
2026-06-17days on market $189,990 Active 85 DOM
-
2026-06-16days on market $189,990 Active 84 DOM
-
2026-06-15days on market $189,990 Active 83 DOM
-
2026-06-13days on market $189,990 Active 81 DOM
-
2026-06-09days on market $189,990 Active 77 DOM
-
2026-06-08days on market $189,990 Active 76 DOM
-
2026-06-07days on market $189,990 Active 75 DOM
-
2026-06-05days on market $189,990 Active 72 DOM
-
2026-06-03days on market $189,990 Active 71 DOM
-
2026-06-02days on market $189,990 Active 70 DOM
-
2026-06-01days on market $189,990 Active 69 DOM
-
2026-05-31days on market $189,990 Active 68 DOM
-
2026-04-17price $189,990
-
2026-03-24$199,990 Active
-
2025-12-10historical
-
2025-09-30historical
-
2025-09-30$199,990 Active
-
2025-09-08price $199,990
-
2025-08-14price $209,990
-
2025-07-02$214,990 Active
-
2025-03-10$215,000 Active
-
2022-08-16soldstatus $152,000 Closed
-
2022-06-26status Pending
-
2022-06-21$149,900 Active
-
2019-05-17soldstatus $102,000
-
2019-05-16soldstatus $102,000
-
2019-04-12$102,000
ⓘ Source: listings_history table (triggers on properties + properties_extension) + one-shot
backfill from property_details.listing_events for pre-trigger history.
Tax reassessment forecast VA · Resets to sale price
- Current annual tax
- $1,149 · $96/mo
- Projected year-2 tax
- $1,558 · $130/mo
- Expected delta
- +$408/yr (+$34/mo · 35.5%)
ⓘ Screening estimate from a state-policy table — verify with the county assessor before closing.
Climate risk First Street
- Flood 1/10 Low FEMA zone X (unshaded) · 0% chance over 30 yrs
- Wildfire 3/10 Moderate
- Heat 8/10 Severe 7 d/yr ≥107°F today · 16 d/yr by 30 yrs out
- Wind 6/10 Major 63% chance of damaging wind over 30 yrs
- Air quality 2/10 Low 1 unhealthy d/yr today · 1 by 30 yrs out
Nearby sold comps map
Loading sold comps map…
Walkable amenities ~0.75 mi
Loading nearby amenities…
Taxation est. · year 1
- Rental income
- $23,407
- − Mortgage interest
- −$10,642
- − Property taxes
- −$1,149
- − Insurance
- −$950
- − Repairs & maintenance
- −$1,873
- − Management
- −$1,873
- − HOA
- −$3,480
- − Depreciation
- −$5,527
- Taxable loss
- −$2,087
- Est. tax savings @ 24.0%
- +$501
- After-tax cash flow
- $1,457/yr
For passive investors: Depreciation is non-cash, so a rental often shows a tax loss while cash-flowing — sheltering income. Rental losses are passive: they offset passive income freely, and up to $25,000/yr can offset ordinary (W-2) income if you actively participate and your MAGI is under $100k (phasing out to $0 by $150k); unused losses carry forward. On sale, claimed depreciation is recaptured at up to 25%, and gains may owe capital-gains tax (a 1031 exchange can defer both). Figures are a year-1 estimate at your 24.0% rate — not tax advice; consult a CPA.
Schools (NCES district)
- District
- Williamsburg-James City Public School District
- NCES district ID
- 5104020
- Math proficiency
- 60% ▼ -25.00%
- Reading proficiency
- 73% ▼ -8.00%
- Median HH income
- $49,497
- Composite
- 56.37/100
- National rank
- #1163
- State rank
- #36 of 131 in VA
Livability — Williamsburg
- Score
- 84/100
- State rank
- #31
- US rank
- #734
Category grades
Schools grade is shown separately in the Schools card above.
Census & demographics
- Census place
- Williamsburg, VA
- County
- Williamsburg City · 55,270 people
- City population
- 101,073
- Metro
- Virginia Beach-Norfolk-Newport News, VA-NC
- Population (ZIP)
- 55,270
- Household income
- $105,431
- Rent vs Own
- Severe rent burden
- 1770.0
Population outlook (Williamsburg County) Hauer SSP2
- Today (2025)
- 20,784 people
- By 2030
- 22,731 · +9.4%
- By 2040
- 26,175 · +25.9%
- By 2050
- 29,939 · +44.0%
- By 2075
- 39,953 · +92.2%
- By 2100
- 49,884 · +140.0%
Race, ethnicity, and origin ACS 2023
- Neighborhood character
- Predominantly White (71%)
- Race & ethnicity
- White 71% Black 14% Two or more races 9% Hispanic / Latino 8% Asian 4%
- Hispanic origin (detail)
- Mexican 2% Puerto Rican 3%
- Common ancestry
- Slovak 3% Lithuanian 3% Romanian 3%
- Foreign-born
- 8% · Canada, China, Vietnam
- Languages at home
- 89% English-only · Spanish 5% Other Indo-European 1% Chinese 1%
Political lean MEDSL · Williamsburg
- 2024 margin
- Solid D (+44.5) · D 71.5% · R 27.0% · Other 1.5%
- 2008→2024 swing
- +15.4pp toward D · 2008: 29.1pp · 2024: 44.5pp
- All cycles
- 2024: D+44.5 2020: D+41.1 2016: D+43.5 2012: D+28.8 2008: D+29.1
Not yet ingested
- Civics
- —
Market trends
- HPI YoY
- ▼ -345.15%
- Current HPI
- 240.1637
- Rent YoY
- ▲ 5.21%
- Metro
- Virginia Beach-Norfolk-Newport News, VA-NC
- State GDP YoY
- ▲ 2.40%
- F500 in state
- 50
Industry mix (Fortune 500 HQ in VA)
| Industry | F500 HQs | Revenue |
|---|---|---|
| Aerospace / Defense | 4 | $236B |
|
||
| Technology / Defense | 3 | $32B |
|
||
| Financial Services | 2 | $176B |
|
||
| Utilities | 2 | $27B |
|
||
| Insurance | 2 | $25B |
|
||
| Technology | 2 | $15B |
|
||
Price history
+86.3% since first listed15 events — show timeline
- 2026-04-17 Price Changed $189,990 REINMLS
- 2026-03-24 Listed $199,990 REINMLS
- 2025-12-10 Listing Removed — REINMLS
- 2025-09-30 Listing Removed — REINMLS
- 2025-09-30 Listed $199,990 REINMLS
- 2025-09-08 Price Changed $199,990 REINMLS
- 2025-08-14 Price Changed $209,990 REINMLS
- 2025-07-02 Listed $214,990 REINMLS
- 2025-03-10 Listed $215,000 WMLS
- 2022-08-16 Sold (MLS) $152,000 WMLS
- 2022-06-26 Pending — WMLS
- 2022-06-21 Listed $149,900 WMLS
- 2019-05-17 Sold (Public Records) $102,000 Public Records
- 2019-05-16 Sold (MLS) $102,000 WMLS
- 2019-04-12 Listed $102,000 WMLS
Property tax history
+8.4%/yrLatest (2025): $1,149 · +23.2% YoY. Source: county tax records.
Cash-flow waterfall
monthlySold comps — $/sqft
last 12 mo · ≤1 miLoading sold comps…