17 Squirrel Holw · Sierra City, CA
Flood risk 4/10 · Minor
- FEMA flood zone
- X (unshaded)
- Chance of flooding over 30 yrs
- 0.24%
- Est. flood insurance / yr
- $507 – $1,088
Fire risk 7/10 · Major
- Est. fire insurance / yr
- $659 – $1,223
Heat risk 3/10 · Minor
- Hot days now (above 86°F)
- 12 days/yr
- Hot days in 30 yrs
- 31 days/yr
Wind risk 1/10 · Minimal
- Chance of severe wind over 30 yrs
- —
Air-quality risk 10/10 · Severe
- Unhealthy air days now
- 19 days/yr
- Unhealthy air days in 30 yrs
- 26 days/yr
Risk factors via First Street. Map © Google.
Why this score? — see what drove the D grade
The composite is a weighted blend of 9 inputs, each scored 0–100. Each bar is that input's sub-score; the figure is the points it added to the 100-point composite (weight × sub-score).
- ARV discount +15.0/15.0
- Cash flow +7.0/30.0
- Appreciation +5.5/10.0
- Schools +3.7/10.0
- Livability +3.1/5.0
- Rent growth +2.5/5.0
- Condition / age +2.5/5.0
- DSCR +1.2/10.0
- 1% rule +0.7/10.0
$279,000
🖨 Deal sheet (PDF) 📄 Offer letter ✓ Due diligence
Listing remarks
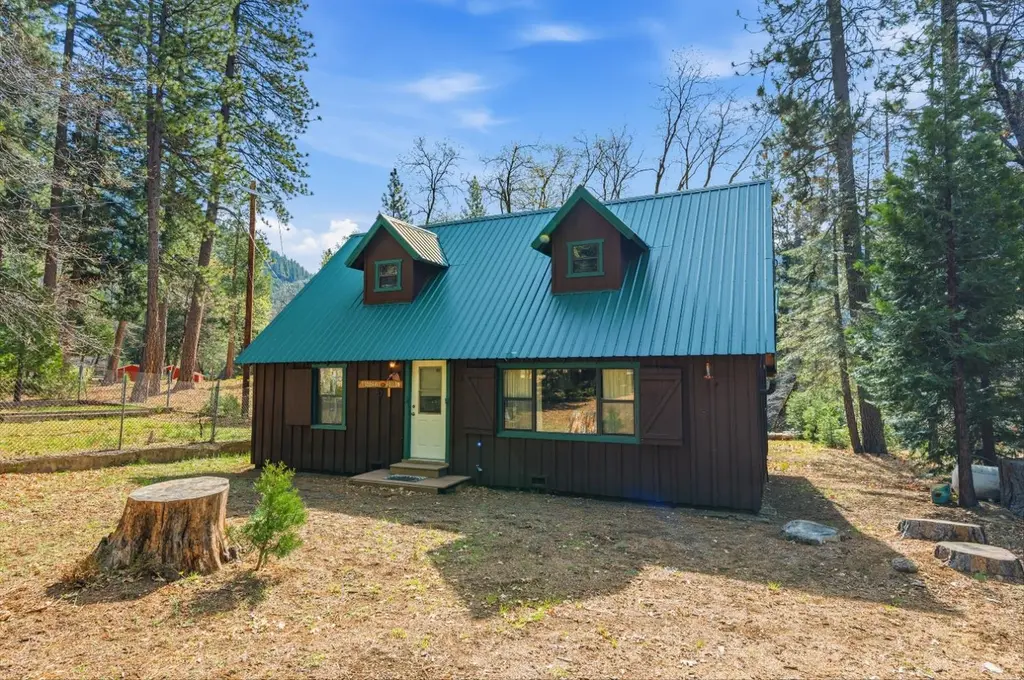
Here's your opportunity to own a charming rustic 3-bedroom, 1-bath cabin nestled in the peaceful surroundings of Sierra City. Ideally located just minutes from downtown, this property offers the perfect balance of convenience and tranquility. The open-concept main level features a spacious layout with the kitchen, dining, and living areas seamlessly connected, along with two bedrooms and a full bath for easy everyday living. Upstairs, a generous loft-style bedroom provides plenty of space for multiple bedsideal for hosting family and guests. Step out onto the back deck to relax and take in the calm, quiet pace of mountain life. The flat, usable lot offers ample room for outdoor enjoyment, w
Key facts
- Pacific crest trail
- Flat usable lot
- Back deck
Tags
Neighborhood map
What this means for you Summary
Snapshot
- This is a 3-bed/1.0-bath other listed at $279k.
Deal economics
- At list price, monthly cash flow is $-413 ($-5k/yr) — negative.
- To cash-flow at today's rent, offer at most $206k (26.2% below list).
- To meet the 1% rule (rent ≥ 1% of price), the offer needs to be $159k (42.9% below list).
- Recommended offer: $159k (42.9% below list) — sets the bar for 1% rule.
Location & tenants
- Location reads 61/100 on livability (#527 in CA) — a middle-class / working-renter tenant base. Strengths: employment A+, housing A+; Watch: crime C-, amenities F, commute F.
- Sierra-Plumas Joint Unified (rural): math 36% / reading 44% proficiency, ranked #735 of 1,400 in CA (top 52%) — families likely to look elsewhere, expect single-tenant / working-renter base with shorter leases.
- Market conditions: 17 active listings in the ZIP; 3 units permitted in Sierra County in 2024 (0 in 5+ unit buildings).
Forward outlook
- In year one you build about $5k of equity ($2k loan paydown + $3k appreciation (0.9% local appreciation)).
- Sierra County population projected at -35% by 2050 — secular population decline; favor cash flow + early exit over multi-decade hold.
- By year 7, paydown + projected appreciation supports a ~$31k cash-out refi (75% LTV) — recoverable capital for the next deal without selling this one.
Negotiation context
- It's been on market 79 days — a 6% lower offer ($262k) is reasonable based on typical stale-listing flexibility.
Risks & watch-outs
- Climate carrying-cost: major wildfire risk — expect insurance premiums to compound above CPI over the hold.
Questions for the listing agent
- What do current leases actually rent for vs. the listed asking? Can we see a recent rent roll and the last 12 months of T-12 income?
- It's been on market 79 days. Have you received any prior offers? Is the seller open to a 43% concession, seller financing, or rate buy-down credit?
- Built in 1963 — when were the roof, HVAC, electrical panel, plumbing, and water heater last replaced?
- Why hasn't it sold? Are there any deal-killer items the seller is aware of (foundation, flood, title, zoning, code violations)?
- Is there a deadline driving the sale (1031 exchange, divorce, estate, relocation)? That informs how much negotiation room exists.
- The area grade is low — what's the realistic commute time and amenity access for the typical tenant pool here? Any planned neighborhood developments (good or bad) we should know about?
- What's the average days-on-market for RENTAL listings here right now (not sales)? A rising rental-DOM trend means longer vacancies and softer asking-rent achievability than the comps imply.
- What's the recent tenant-quality profile in this submarket — average credit score on applications, eviction rate, late-payment / NSF rate, and stable-employment percentage? A property-management company in the area should have these aggregated.
- How much new for-sale + rental construction is in the pipeline within 1–3 miles? Heavy new supply typically softens prices + rents 12–24 months out; constrained supply supports both.
Investment metrics
- 1% rule
- 0.57% ✗
- Cap rate
- 4.51%
- Cash-on-cash
- -6.35%
- DSCR
- 0.72
- GRM
- 14.6
CMA / ARV
- ARV (median comp)
- $377,711
- List price
- $279,000
- Delta
- -26.13%
- Verdict
- UNDERPRICED
- Comps
- 8 within 1.0 mi
Projected returns pro-forma
0.94% appreciation · 3.0% rent growth · sell at horizon
- IRR
- -5.6%
- Equity multiple
- 0.72×
- Total profit
- $-22,086
- Equity at exit
- $94,359
- IRR
- -0.2%
- Equity multiple
- 0.97×
- Total profit
- $-2,319
- Equity at exit
- $124,712
Cash invested: $78,120 (down + closing). Projections, not guarantees.
Landlord ↔ Tenant lean methodology
- Overall (STATE)
- 18 Strongly Tenant-Friendly
- State California
- 18 Strongly Tenant-Friendly · D+13
- County
- — inherits STATE
- City
- — inherits STATE
ZIP-level market 96125
- Home prices YoY
- 0.5%
- Active inventory
- 17
- Price-to-rent
- 14.6×
Monthly cashflow live
- Estimated rent
- $1,592 medium interval (Pro) →
- Mortgage (P&I)
- −$1,463
- Tax from tax record
- −$92 /mo · $1,103/yr
- Insurance
- −$116
- HOA
- −$0
- Vacancy / Maint / Mgmt
- −$334
- Net cashflow
- $-413
Break-even live
Sensitivity live
| Price | -10% $-256 | -5% $-335 | +0% $-413 | +5% $-492 | +10% $-571 |
|---|---|---|---|---|---|
| Rent | -10% $-539 | -5% $-476 | +0% $-413 | +5% $-351 | +10% $-288 |
| Rate | -1.0pp $-273 | -0.5pp $-343 | base $-413 | +0.5pp $-486 | +1.0pp $-559 |
UW: 25.0% down · 7.5% · 30yr · 1.5% tax · 5.0% vac · 8.0% maint · 8.0% mgmt
Financing live
Cash to close
- Down payment
- $69,750
- Closing costs
- $8,370
- Reserves months
- —
- Total cash needed
- —
Loan-product check · same deal, 3 products live
Conventional
25% down · 7.5% · 30yr
- Down + closing
- —
- Monthly P&I
- —
- Monthly cashflow
- —
- DSCR
- —
- Eligible?
- —
Personal DTI + credit; lowest rate.
DSCR
20% down · 8.5% · 30yr
- Down + closing
- —
- Monthly P&I
- —
- Monthly cashflow
- —
- DSCR
- —
- Eligible?
- —
No personal income docs; deal must DSCR.
Hard money
10% down · 12.0% · 12mo
- Down + closing
- —
- Monthly P&I
- —
- Monthly cashflow
- —
- DSCR
- —
- Eligible?
- —
Short-term bridge; refi at stabilization.
Listing history 16 events
-
2026-06-18days on market $279,000 Active 79 DOM
-
2026-06-17days on market $279,000 Active 78 DOM
-
2026-06-16days on market $279,000 Active 77 DOM
-
2026-06-15days on market $279,000 Active 76 DOM
-
2026-06-14days on market $279,000 Active 74 DOM
-
2026-06-13days on market $279,000 Active 73 DOM
-
2026-06-10days on market $279,000 Active 71 DOM
-
2026-06-09days on market $279,000 Active 70 DOM
-
2026-06-08days on market $279,000 Active 69 DOM
-
2026-06-07days on market $279,000 Active 68 DOM
-
2026-06-05days on market $279,000 Active 65 DOM
-
2026-06-03days on market $279,000 Active 64 DOM
-
2026-06-02days on market $279,000 Active 63 DOM
-
2026-06-01days on market $279,000 Active 62 DOM
-
2026-05-31days on market $279,000 Active 61 DOM
-
2026-05-30days on market $279,000 Active 60 DOM
ⓘ Source: listings_history table (triggers on properties + properties_extension) + one-shot
backfill from property_details.listing_events for pre-trigger history.
Tax reassessment forecast CA · Resets to sale price
- Current annual tax
- $1,103 · $92/mo
- Projected year-2 tax
- $2,120 · $177/mo
- Expected delta
- +$1,017/yr (+$85/mo · 92.2%)
ⓘ Screening estimate from a state-policy table — verify with the county assessor before closing.
Climate risk First Street
- Flood 4/10 Moderate FEMA zone X (unshaded) · 24% chance over 30 yrs
- Wildfire 7/10 Severe
- Heat 3/10 Moderate 12 d/yr ≥86°F today · 31 d/yr by 30 yrs out
- Wind 1/10 Low
- Air quality 10/10 Extreme 19 unhealthy d/yr today · 26 by 30 yrs out
Nearby sold comps map
Loading sold comps map…
Walkable amenities ~0.75 mi
Loading nearby amenities…
Taxation est. · year 1
- Rental income
- $19,105
- − Mortgage interest
- −$15,628
- − Property taxes
- −$1,103
- − Insurance
- −$1,395
- − Repairs & maintenance
- −$1,528
- − Management
- −$1,528
- − Depreciation
- −$8,116
- Taxable loss
- −$10,194
- Est. tax savings @ 24.0%
- +$2,447
- After-tax cash flow
- $-2,515/yr
For passive investors: Depreciation is non-cash, so a rental often shows a tax loss while cash-flowing — sheltering income. Rental losses are passive: they offset passive income freely, and up to $25,000/yr can offset ordinary (W-2) income if you actively participate and your MAGI is under $100k (phasing out to $0 by $150k); unused losses carry forward. On sale, claimed depreciation is recaptured at up to 25%, and gains may owe capital-gains tax (a 1031 exchange can defer both). Figures are a year-1 estimate at your 24.0% rate — not tax advice; consult a CPA.
Schools (NCES district)
- District
- Sierra-Plumas Joint Unified
- NCES district ID
- 0636780
- Math proficiency
- 36% ▲ 1.00%
- Reading proficiency
- 44% ▲ 1.00%
- Median HH income
- $46,060
- Composite
- 36.53/100
- National rank
- #9297
- State rank
- #735 of 1400 in CA
Livability — Sierra City
- Score
- 61/100
- State rank
- #527
- US rank
- #17708
Category grades
Schools grade is shown separately in the Schools card above.
Census & demographics
- Census place
- Sierra City, CA
- Population (ZIP)
- 226
Population outlook (Sierra County) Hauer SSP2
- Today (2025)
- 2,515 people
- By 2030
- 2,279 · -9.4%
- By 2040
- 1,868 · -25.7%
- By 2050
- 1,636 · -35.0%
- By 2075
- 1,478 · -41.2%
- By 2100
- 1,451 · -42.3%
Race, ethnicity, and origin ACS 2023
- Neighborhood character
- Predominantly White (93%)
- Race & ethnicity
- White 93% Two or more races 7%
- Common ancestry
- Lithuanian 13% Slovak 11% Romanian 8%
Political lean MEDSL · Sierra
- 2024 margin
- Strong R (+24.2) · D 36.5% · R 60.8% · Other 2.7%
- 2008→2024 swing
- -3.4pp toward R · 2008: -20.8pp · 2024: -24.2pp
- All cycles
- 2024: R+24.2 2020: R+21.4 2016: R+24.8 2012: R+22.7 2008: R+20.8
Not yet ingested
- Civics
- —
Market trends
- HPI YoY
- ▲ 0.94%
- Current HPI
- 194.0081
- Rent YoY
- —
- Metro
- —
- State GDP YoY
- ▲ 3.21%
- F500 in state
- 116
Industry mix (Fortune 500 HQ in CA)
| Industry | F500 HQs | Revenue |
|---|---|---|
| Technology | 27 | $1,492B |
|
||
| Financial Services | 3 | $174B |
|
||
| Retail | 3 | $44B |
|
||
| Insurance | 3 | $26B |
|
||
| Media / Entertainment | 2 | $115B |
|
||
| Pharmaceuticals / Biotech | 2 | $62B |
|
||
Property tax history
+2.6%/yrLatest (2025): $1,103 · +1.2% YoY. Source: county tax records.
Cash-flow waterfall
monthlySold comps — $/sqft
last 12 mo · ≤1 miLoading sold comps…