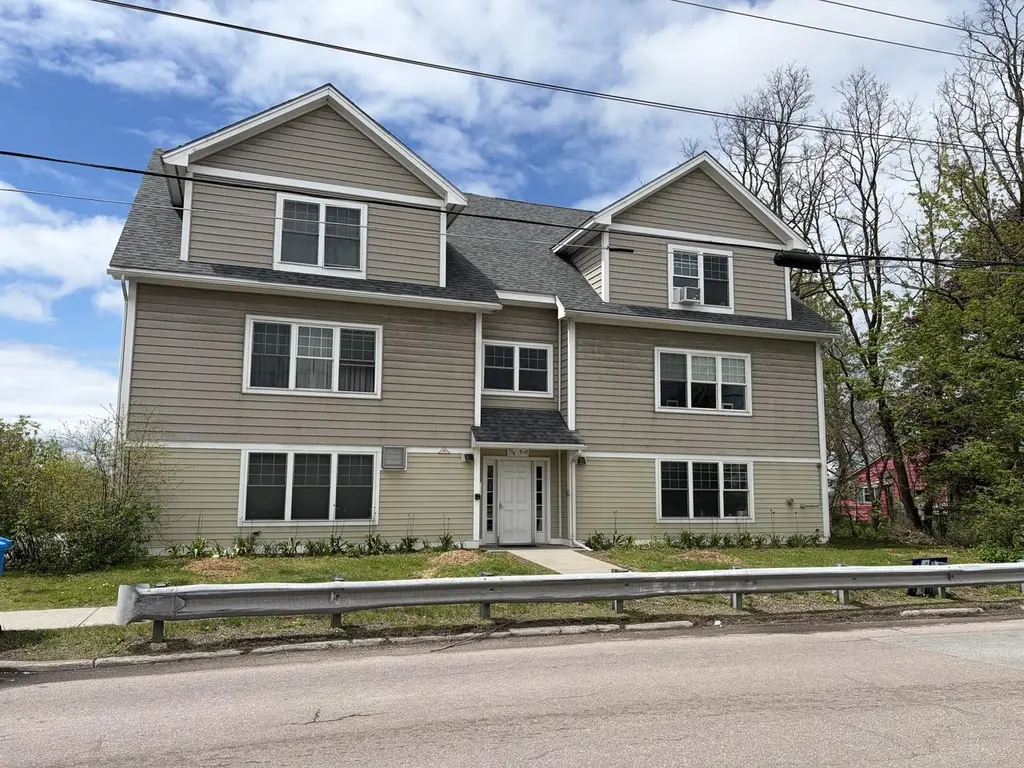
354 Manhattan Dr #14 · Burlington, VT
Flood risk 1/10 · Minimal
- FEMA flood zone
- X (unshaded)
- Chance of flooding over 30 yrs
- 0.0%
- Est. flood insurance / yr
- $507 – $1,088
Fire risk 1/10 · Minimal
- Est. fire insurance / yr
- $480 – $892
Heat risk 3/10 · Minor
- Hot days now (above 93°F)
- 7 days/yr
- Hot days in 30 yrs
- 15 days/yr
Wind risk 2/10 · Minimal
- Chance of severe wind over 30 yrs
- 1.0%
Air-quality risk 2/10 · Minimal
- Unhealthy air days now
- 1 days/yr
- Unhealthy air days in 30 yrs
- 1 days/yr
Risk factors via First Street. Map © Google.
Why this score? — see what drove the D grade
The composite is a weighted blend of 9 inputs, each scored 0–100. Each bar is that input's sub-score; the figure is the points it added to the 100-point composite (weight × sub-score).
- Cash flow +11.0/30.0
- ARV discount +7.5/15.0
- 1% rule +5.6/10.0
- Schools +5.0/10.0
- Livability +3.7/5.0
- DSCR +3.2/10.0
- Rent growth +2.6/5.0
- Condition / age +2.5/5.0
- Appreciation +0.0/10.0
$250,000
🖨 Deal sheet (PDF) 📄 Offer letter ✓ Due diligence
Listing remarks MLS
Affordable housing in the city. Unit includes one garage parking space. 1 cat or 1 small to med. dog allowed. Assoc. fees incl. gas usage for gas dryer, hot water and heat. Secured entrance with intercom. Seller to contribute $3,000 towards the purchasers closing cost.
Key facts
- Deeded garage space
- Spacious closets
- Large living room
Tags
Property features AI
Finance
- Other: Directions: Riverside Avenue to Oak Street to left on Manhattan Drive. Building on right.
- HOA & community: Condo fees (monthly); HOA covers building maintenance and master insurance; Indoor storage available; Common acreage; Snow removal and trash removal provided
Exterior
- Parking: One-car garage
- Utilities: Public water; Public sewer; Electric service with circuit breakers (Burlington Electric); VGS fuel service; Cable available; Internet availability unknown
- Home design: Top-floor unit with a flat architectural style; Beige exterior
- Construction: Built in 2007; Wood frame construction; Shingle roof; Unit/lot number 14
- Exterior features: Condo development; Near shopping; Paved driveway
Interior
- Kitchen: Dishwasher; Electric stove; Refrigerator
- Flooring: Carpet; Laminate
- Bathrooms: One full bathroom
- Heating & cooling: Natural gas heating; Baseboard heat
- Interior features: Five total rooms; Basement with interior access and assigned storage
- Laundry & utility: Washer; Dryer
Neighborhood map
What this means for you Summary
Snapshot
- This is a 2-bed/1.0-bath condo listed at $250k.
Deal economics
- At list price, monthly cash flow is $-106 ($-1k/yr) — negative.
- To cash-flow at today's rent, offer at most $231k (7.5% below list).
- Meets the 1% rule at list price ($3k rent vs $250k).
- Recommended offer: $231k (7.5% below list) — sets the bar for cash-flow.
- Cap rate 5.8% vs local median 3.2% in Burlington — top-decile yield for the area; either an underpriced asset or a hidden risk that comps aren't pricing in. Stress-test before assuming the spread holds.
Location & tenants
- Location reads 74/100 on livability (#19 in VT, #4,619 nationally) — a middle-class / working-renter tenant base. Strengths: commute A+, health & safety A+, employment B; Watch: cost of living D, crime F, amenities F.
- Zoned schools: Integrated Arts Academy At H. O. Wheeler (math 37% / reading 52%, grade F, #72 of 192 statewide, top 42%, 248 students, 58% FRL); Lyman C. Hunt Middle School (math 34% / reading 47%, grade F, #13 of 26 statewide, top 52%, 337 students, 49% FRL); Burlington High School (math 42% / reading 57%, grade D, #8 of 48 statewide, top 15%, 987 students, 48% FRL).
- Market conditions: Rents flat; 138 active listings in the ZIP; 22 comparable units currently listed for rent nearby; rentals lingering (median 46d on market — plan ~5-8 weeks vacancy on turnover, expect pricing pressure); 55% of comp listings sitting > 30 days — soft ceiling on asking rent; 898 units permitted in Chittenden County in 2024 (554 in 5+ unit buildings).
- At $2,660/mo this rent would consume 49% of the median local household income ($66k/yr) (locally 2757% of renters already pay >50% of income on rent) — very limited rent-growth headroom before tenants either downsize or default.
Forward outlook
- Local home prices are declining (-3.0%/yr); year-one equity from $2k of loan paydown is wiped out by about $8k of value loss. Plan a longer hold.
- Chittenden County population projected at +8% by 2050 — modest demand growth; plan on rents tracking national, not racing it.
Negotiation context
- It's been on market 37 days — a 3% lower offer ($242k) is reasonable based on typical stale-listing flexibility.
- 2 sale attempts since 19y ago with the ask held roughly flat each time — persistent listings suggest the price (not the market) is what's stuck; bring a comps-based counter.
- Current owner paid $162k; list at $250k implies a 54% gain — meaningful room to come down on a strong offer.
Risks & watch-outs
- Watch-outs: HOA is 21% of rent.
Questions for the listing agent
- What do current leases actually rent for vs. the listed asking? Can we see a recent rent roll and the last 12 months of T-12 income?
- It's been on market 37 days. Have you received any prior offers? Is the seller open to a 7% concession, seller financing, or rate buy-down credit?
- What does the HOA fee cover, when was the last increase, and are there any pending special assessments or reserve-fund shortfalls?
- Any open or pending special assessments — roof, HVAC, plumbing, elevator, façade? What's the per-unit balance and payoff schedule, and is the seller paying it off at close or rolling it to the buyer?
- Is there a deadline driving the sale (1031 exchange, divorce, estate, relocation)? That informs how much negotiation room exists.
- Schools are B-rated — typically a magnet for longer-tenancy family renters. What's the average tenant stay here, and is there a school-zone premium baked into asking?
- Crime grade is F in this area — have there been break-ins, vandalism, or insurance claims at this property in the last 3 years? What carrier currently insures it and at what premium?
- The area grade is low — what's the realistic commute time and amenity access for the typical tenant pool here? Any planned neighborhood developments (good or bad) we should know about?
- What's the average days-on-market for RENTAL listings here right now (not sales)? A rising rental-DOM trend means longer vacancies and softer asking-rent achievability than the comps imply.
- What's the recent tenant-quality profile in this submarket — average credit score on applications, eviction rate, late-payment / NSF rate, and stable-employment percentage? A property-management company in the area should have these aggregated.
- How much new apartment / multifamily construction is in the pipeline within 1–3 miles? Heavy new supply (>2% of stock underway) typically softens rents 12–24 months out; light construction supports rent growth.
Investment metrics
- 1% rule
- 1.06% ✓
- Cap rate
- 5.78%
- Cash-on-cash
- -1.82%
- DSCR
- 0.92
- GRM
- 7.8
CMA / ARV
No comps found within radius.
Projected returns pro-forma
-3.0% appreciation · 0.52% rent growth · sell at horizon
- IRR
- -22.8%
- Equity multiple
- 0.24×
- Total profit
- $-53,401
- Equity at exit
- $37,276
- IRR
- -28.3%
- Equity multiple
- -0.13×
- Total profit
- $-79,119
- Equity at exit
- $21,615
Cash invested: $70,000 (down + closing). Projections, not guarantees.
Landlord ↔ Tenant lean methodology
- Overall (STATE)
- 41 Moderately Tenant-Leaning
- State Vermont
- 41 Moderately Tenant-Leaning · D+15
- County
- — inherits STATE
- City
- — inherits STATE
ZIP-level market 05401
- Rents YoY
- 0.5%
- Active inventory
- 138
- Price-to-rent
- 7.8×
Monthly cashflow live
- Estimated rent
- $2,660 high interval (Pro) →
- Mortgage (P&I)
- −$1,311
- Tax from tax record
- −$227 /mo · $2,724/yr
- Insurance
- −$104
- HOA
- −$565
- Vacancy / Maint / Mgmt
- −$559
- Net cashflow
- $-106
Break-even live
Sensitivity live
| Price | -10% $36 | -5% $-35 | +0% $-106 | +5% $-177 | +10% $-247 |
|---|---|---|---|---|---|
| Rent | -10% $-316 | -5% $-211 | +0% $-106 | +5% $-1 | +10% $104 |
| Rate | -1.0pp $20 | -0.5pp $-42 | base $-106 | +0.5pp $-171 | +1.0pp $-237 |
UW: 25.0% down · 7.5% · 30yr · 1.5% tax · 5.0% vac · 8.0% maint · 8.0% mgmt
Financing live
Cash to close
- Down payment
- $62,500
- Closing costs
- $7,500
- Reserves months
- —
- Total cash needed
- —
Loan-product check · same deal, 3 products live
Conventional
25% down · 7.5% · 30yr
- Down + closing
- —
- Monthly P&I
- —
- Monthly cashflow
- —
- DSCR
- —
- Eligible?
- —
Personal DTI + credit; lowest rate.
DSCR
20% down · 8.5% · 30yr
- Down + closing
- —
- Monthly P&I
- —
- Monthly cashflow
- —
- DSCR
- —
- Eligible?
- —
No personal income docs; deal must DSCR.
Hard money
10% down · 12.0% · 12mo
- Down + closing
- —
- Monthly P&I
- —
- Monthly cashflow
- —
- DSCR
- —
- Eligible?
- —
Short-term bridge; refi at stabilization.
Rent comps 22 comps
| Address | Beds | Baths | Sqft | Rent | $/sqft | DOM | Units | Dist |
|---|---|---|---|---|---|---|---|---|
| 93 Walnut St #5 Burlington, VT | 3.0 | 1.0 | 950 | $3,000 | $3.16 | 45d | 1 | 0.05mi |
| 170 Park St Burlington, VT | 3.0 | 1.0 | 896 | $2,900 | $3.24 | 45d | 1 | 0.41mi |
| 372-374 North St Burlington, VT | 3.0 | 1.0 | 1080 | $2,880 | $2.67 | 45d | 1 | 0.50mi |
| 150 North Ave Burlington, VT | 2.0 | 1.0 | 1000 | $2,500 | $2.50 | 45d | 1 | 0.54mi |
| 135 North Ave Unit 135 Burlington, VT | 3.0 | 2.0 | 1090 | $2,800 | $2.57 | 45d | 1 | 0.56mi |
| 52 Isham St Unit 2 Burlington, VT | 3.0 | 1.0 | 1065 | $3,050 | $2.86 | 45d | 1 | 0.61mi |
| 8 S Union St Unit 1 Burlington, VT | 2.0 | 1.0 | 1100 | $2,100 | $1.91 | 23d | 1 | 0.72mi |
| 375 North Ave Apt 310 Burlington, VT | 1.0 | 1.0 | 570 | $2,100 | $3.68 | 45d | 1 | 0.72mi |
| 70 Cambrian Way Burlington, VT | 1.0 | 1.0 | 685 | $2,750 | $4.01 | 23d | 14 | 0.72mi |
| 125 Cambrian Way Burlington, VT | 1.0–2.0 | 1.0–2.0 | 1149 | $4,050 | $3.52 | 23d | 6 | 0.75mi |
| 37 S Willard St Burlington, VT | 3.0 | 1.0 | 900 | $2,625 | $2.92 | 45d | 1 | 0.82mi |
| 79 Pine St Burlington, VT | 1.0 | 1.0 | 979 | $4,600 | $4.70 | 23d | 1 | 0.87mi |
| 288 Main St Burlington, VT | 2.0 | 1.0 | 712 | $2,000 | $2.81 | 45d | 1 | 0.99mi |
| 131 Main St Burlington, VT | 1.0–2.0 | 1.0–1.5 | 685 | $2,500 | $3.65 | 23d | 1 | 1.00mi |
| 267 Hildred Dr Burlington, VT | 2.0 | 1.0 | 820 | $2,450 | $2.99 | 23d | 1 | 1.03mi |
| 94 Malletts Bay Ave Unit 1A Winooski, VT | 3.0 | 1.0 | 984 | $2,595 | $2.64 | 23d | 1 | 1.14mi |
| 101 Union St Unit 1A Winooski, VT | 3.0 | 1.0 | 1046 | $2,895 | $2.77 | 23d | 1 | 1.18mi |
| 12 North St Unit A Winooski, VT | 2.0 | 1.0 | 900 | $1,650 | $1.83 | 45d | 1 | 1.22mi |
| 20 W Canal St Winooski, VT | 1.0–2.0 | 1.0–2.0 | 1114 | $2,700 | $2.42 | 45d | 1 | 1.28mi |
| 304 S Winooski Ave Burlington, VT | 3.0 | 2.0 | 780 | $2,950 | $3.78 | 45d | 1 | 1.31mi |
| 23 Weaver Ln Unit 1A Winooski, VT | 2.0 | 1.0 | 767 | $1,500 | $1.96 | 23d | 1 | 1.42mi |
| 25 Winooski Falls Way Winooski, VT | 2.0–8.0 | 1.0–2.0 | 822 | $850 | $1.03 | 23d | 11 | 1.44mi |
HOA detail condo
- Monthly dues
- $565 · $6,780/yr
- Likely covers
- watergas
- Assessments
- None detected in remarks — confirm with the listing agent.
Listing history 23 events
-
2026-06-21days on market $250,000 Active 37 DOM
-
2026-06-19days on market $250,000 Active 35 DOM
-
2026-06-18days on market $250,000 Active 34 DOM
-
2026-06-17days on market $250,000 Active 33 DOM
-
2026-06-16days on market $250,000 Active 32 DOM
-
2026-06-15days on market $250,000 Active 31 DOM
-
2026-06-14days on market $250,000 Active 29 DOM
-
2026-06-13days on market $250,000 Active 28 DOM
-
2026-06-10days on market $250,000 Active 26 DOM
-
2026-06-09days on market $250,000 Active 25 DOM
-
2026-06-08days on market $250,000 Active 24 DOM
-
2026-06-07days on market $250,000 Active 23 DOM
-
2026-06-05days on market $250,000 Active 20 DOM
-
2026-06-03days on market $250,000 Active 19 DOM
-
2026-06-02days on market $250,000 Active 18 DOM
-
2026-06-01days on market $250,000 Active 17 DOM
-
2026-05-31days on market $250,000 Active 16 DOM
-
2026-05-30days on market $250,000 Active 15 DOM
-
2026-05-15$250,000 Active
-
2025-06-17price $260,000
-
2008-06-23soldstatus $161,900
-
2008-06-20soldstatus $161,900 269-char remark
Show marketing remark (269 chars)
Affordable housing in the city. Unit includes one garage parking space. 1 cat or 1 small to med. dog allowed. Assoc. fees incl. gas usage for gas dryer, hot water and heat. Secured entrance with intercom. Seller to contribute $3,000 towards the purchasers closing cost.
-
2007-10-15$164,900 269-char remark
Show marketing remark (269 chars)
Affordable housing in the city. Unit includes one garage parking space. 1 cat or 1 small to med. dog allowed. Assoc. fees incl. gas usage for gas dryer, hot water and heat. Secured entrance with intercom. Seller to contribute $3,000 towards the purchasers closing cost.
ⓘ Source: listings_history table (triggers on properties + properties_extension) + one-shot
backfill from property_details.listing_events for pre-trigger history.
Tax reassessment forecast VT · Partial reset (capped growth)
- Current annual tax
- $2,724 · $227/mo
- Projected year-2 tax
- $3,737 · $311/mo
- Expected delta
- +$1,013/yr (+$84/mo · 37.2%)
ⓘ Screening estimate from a state-policy table — verify with the county assessor before closing.
Climate risk First Street
- Flood 1/10 Low FEMA zone X (unshaded) · 0% chance over 30 yrs
- Wildfire 1/10 Low
- Heat 3/10 Moderate 7 d/yr ≥93°F today · 15 d/yr by 30 yrs out
- Wind 2/10 Low 100% chance of damaging wind over 30 yrs
- Air quality 2/10 Low 1 unhealthy d/yr today · 1 by 30 yrs out
Nearby sold comps map
Loading sold comps map…
Walkable amenities ~0.75 mi
Loading nearby amenities…
Taxation est. · year 1
- Rental income
- $31,917
- − Mortgage interest
- −$14,004
- − Property taxes
- −$2,724
- − Insurance
- −$1,250
- − Repairs & maintenance
- −$2,553
- − Management
- −$2,553
- − HOA
- −$6,780
- − Depreciation
- −$7,273
- Taxable loss
- −$5,220
- Est. tax savings @ 24.0%
- +$1,253
- After-tax cash flow
- $-19/yr
For passive investors: Depreciation is non-cash, so a rental often shows a tax loss while cash-flowing — sheltering income. Rental losses are passive: they offset passive income freely, and up to $25,000/yr can offset ordinary (W-2) income if you actively participate and your MAGI is under $100k (phasing out to $0 by $150k); unused losses carry forward. On sale, claimed depreciation is recaptured at up to 25%, and gains may owe capital-gains tax (a 1031 exchange can defer both). Figures are a year-1 estimate at your 24.0% rate — not tax advice; consult a CPA.
Schools (NCES district)
No district data.
Livability — Burlington
- Score
- 74/100
- State rank
- #19
- US rank
- #4619
Category grades
Schools grade is shown separately in the Schools card above.
Census & demographics
- Census place
- Burlington, VT
- County
- Chittenden County · 110,603 people
- City population
- 31,662
- Metro
- Burlington-South Burlington, VT
- Population (ZIP)
- 31,662
- Household income
- $65,657
- Rent vs Own
- Severe rent burden
- 2757.0
Population outlook (Chittenden County) Hauer SSP2
- Today (2025)
- 170,769 people
- By 2030
- 174,716 · +2.3%
- By 2040
- 180,337 · +5.6%
- By 2050
- 183,768 · +7.6%
- By 2075
- 194,646 · +14.0%
- By 2100
- 194,933 · +14.2%
Race, ethnicity, and origin ACS 2023
- Neighborhood character
- Predominantly White (84%)
- Race & ethnicity
- White 84% Two or more races 6% Asian 4% Black 4% Hispanic / Latino 4%
- Common ancestry
- Romanian 5% Lithuanian 5% Slovak 4%
- Foreign-born
- 7% · China, Canada, Vietnam
- Languages at home
- 90% English-only · Other Indo-European 2% French/Haitian/Cajun 2% Spanish 2%
Political lean MEDSL · Chittenden
- 2024 margin
- Solid D (+53.6) · D 75.4% · R 21.7% · Other 2.9%
- 2008→2024 swing
- +8.9pp toward D · 2008: 44.8pp · 2024: 53.6pp
- All cycles
- 2024: D+53.6 2020: D+54.5 2016: D+46.8 2012: D+41.9 2008: D+44.8
Not yet ingested
- Civics
- —
Market trends
- HPI YoY
- ▼ -316.87%
- Current HPI
- 352.2081
- Rent YoY
- ▲ 0.52%
- Metro
- Burlington-South Burlington, VT
- State GDP YoY
- —
- F500 in state
- 0
Price history
+51.6% since first listed5 events — show timeline
- 2026-05-15 Listed $250,000 PrimeMLS
- 2025-06-17 Price Changed $260,000 PrimeMLS
- 2008-06-23 Sold (Public Records) $161,900 Public Records
- 2008-06-20 Sold (MLS) $161,900 PrimeMLS
- 2007-10-15 Listed $164,900 PrimeMLS
Property tax history
+19.4%/yrLatest (2024): $2,724 · +8.5% YoY. Source: county tax records.
Cash-flow waterfall
monthlySold comps — $/sqft
last 12 mo · ≤1 miLoading sold comps…