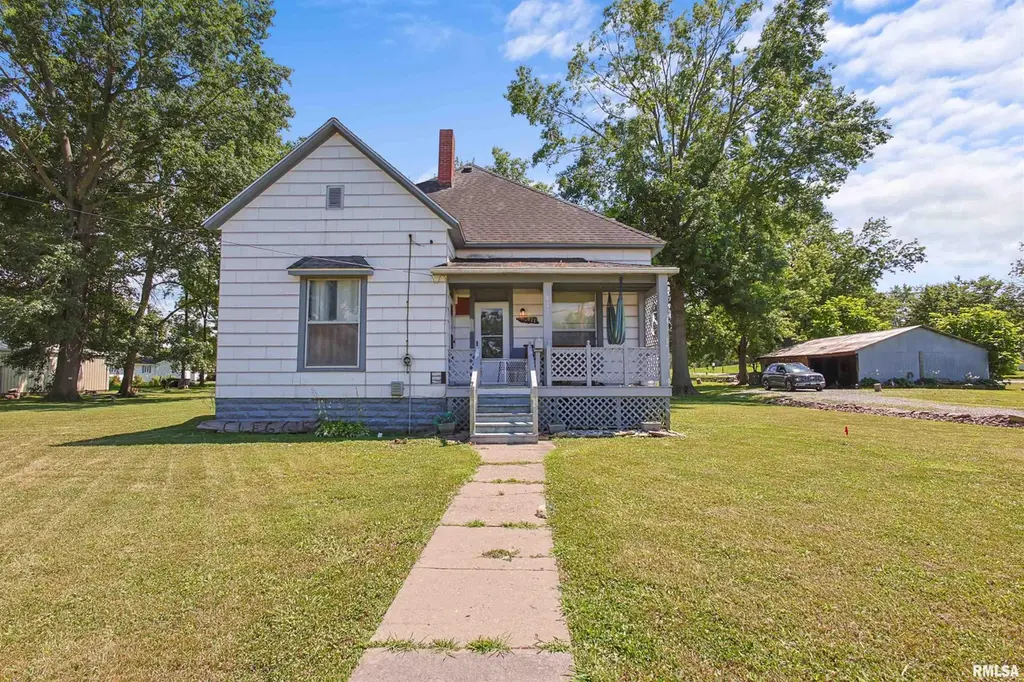
827 W Raymond St · Harrisburg, IL
Flood risk 6/10 · Moderate
- FEMA flood zone
- X (shaded)
- Chance of flooding over 30 yrs
- 0.72%
- Est. flood insurance / yr
- $473 – $860
Fire risk 1/10 · Minimal
- Est. fire insurance / yr
- $804 – $1,492
Heat risk 5/10 · Moderate
- Hot days now (above 108°F)
- 7 days/yr
- Hot days in 30 yrs
- 20 days/yr
Wind risk 2/10 · Minimal
- Chance of severe wind over 30 yrs
- 4.0%
Air-quality risk 2/10 · Minimal
- Unhealthy air days now
- 1 days/yr
- Unhealthy air days in 30 yrs
- 1 days/yr
Risk factors via First Street. Map © Google.
Why this score? — see what drove the B- grade
The composite is a weighted blend of 9 inputs, each scored 0–100. Each bar is that input's sub-score; the figure is the points it added to the 100-point composite (weight × sub-score).
- Cash flow +30.0/30.0
- 1% rule +10.0/10.0
- DSCR +10.0/10.0
- ARV discount +7.5/15.0
- Livability +3.6/5.0
- Rent growth +2.5/5.0
- Condition / age +2.5/5.0
- Schools +1.3/10.0
- Appreciation +0.0/10.0
$55,000
🖨 Deal sheet 📄 Offer letter ✓ Due diligence
Listing remarks MLS
Charming Home on 1.5 Acres – Motivated Sellers!! Just steps from the park, this classic home offers character, potential, and room to grow. Inside, you’ll find original hardwood floors that highlight the charm of its era, with recent updates including electrical and plumbing (2023). Outside, the property features a large outbuilding plus an extra storage shed—perfect for a chicken coop, workshop, hobbies, or extra storage. While the home could use a little TLC to restore it to its full glory, the possibilities are endless with this unique property in a convenient location. Sellers are motivated and may consider splitting the 1.5 acres, giving buyers added flexibility.
Key facts
- 1.5 acre lot
- Parking
- Built 1910
Neighborhood map
What this means for you Summary
Snapshot
- This is a 2-bed/1.0-bath other listed at $55k.
Deal economics
- At list price, monthly cash flow is $346 ($4k/yr) — positive.
- The deal already cash-flows at list — no discount required.
- Meets the 1% rule at list price ($1k rent vs $55k).
- Recommended offer: $50k (9.0% below list) — sets the bar for market timing.
- Cap rate 13.8% vs local median 5.1% in Harrisburg — top-decile yield for the area; either an underpriced asset or a hidden risk that comps aren't pricing in. Stress-test before assuming the spread holds.
Location & tenants
- Location reads 72/100 on livability (#309 in IL) — a middle-class / working-renter tenant base. Strengths: crime A+, cost of living A+, housing A+; Watch: schools F, commute F, employment F.
- Harrisburg CUSD 3 (town): math 5% / reading 25% proficiency, ranked #521 of 620 in IL (top 84%) — low school quality limits family demand, transient renter base, plan for 1-2y turnover.
- Market conditions: 73 active listings in the ZIP.
Forward outlook
- Local home prices are declining (-3.0%/yr); year-one equity from $380 of loan paydown is wiped out by about $2k of value loss. Plan a longer hold.
- Saline County population projected at -16% by 2050 — secular population decline; favor cash flow + early exit over multi-decade hold.
- At projected returns (-3.0% appreciation + 3.0% rent growth), your $15k cash investment doubles in ~5 years — after that, you're playing with house money.
Negotiation context
- It's been on market 119 days — a 9% lower offer ($50k) is reasonable based on typical stale-listing flexibility.
- 6 sale attempts since 4y ago with the ask held roughly flat each time — persistent listings suggest the price (not the market) is what's stuck; bring a comps-based counter.
Risks & watch-outs
- Watch-outs: property tax is 4.0% of price; built in 1910 — expect roof / HVAC / electrical / plumbing capex.
- Climate carrying-cost: major flood risk; extreme-heat days projected 7→20/yr by 2055 (HVAC capex compounding) — expect insurance premiums to compound above CPI over the hold.
Questions for the listing agent
- It's been on market 119 days. Have you received any prior offers? Is the seller open to a 9% concession, seller financing, or rate buy-down credit?
- Built in 1910 — when were the roof, HVAC, electrical panel, plumbing, and water heater last replaced?
- Property tax is high relative to price — has the assessment been appealed recently, and will the sale trigger a re-assessment?
- Why hasn't it sold? Are there any deal-killer items the seller is aware of (foundation, flood, title, zoning, code violations)?
- Is there a deadline driving the sale (1031 exchange, divorce, estate, relocation)? That informs how much negotiation room exists.
- Schools are F-rated, which usually means shorter tenancies and higher turnover. Who's the typical renter profile here, and what's been the actual vacancy rate?
- What's the average days-on-market for RENTAL listings here right now (not sales)? A rising rental-DOM trend means longer vacancies and softer asking-rent achievability than the comps imply.
- What's the recent tenant-quality profile in this submarket — average credit score on applications, eviction rate, late-payment / NSF rate, and stable-employment percentage? A property-management company in the area should have these aggregated.
- How much new for-sale + rental construction is in the pipeline within 1–3 miles? Heavy new supply typically softens prices + rents 12–24 months out; constrained supply supports both.
Investment metrics
- 1% rule
- 1.93% ✓
- Cap rate
- 13.84%
- Cash-on-cash
- 26.96%
- DSCR
- 2.20
- GRM
- 4.3
CMA / ARV
No comps found within radius.
Projected returns pro-forma
-3.0% appreciation · 3.0% rent growth · sell at horizon
- IRR
- 21.0%
- Equity multiple
- 1.86×
- Total profit
- $13,207
- Equity at exit
- $8,201
- IRR
- 29.2%
- Equity multiple
- 3.61×
- Total profit
- $40,219
- Equity at exit
- $4,755
Cash invested: $15,400 (down + closing). Projections, not guarantees.
Landlord ↔ Tenant lean methodology
- Overall (STATE)
- 43 Moderately Tenant-Leaning
- State Illinois
- 43 Moderately Tenant-Leaning · D+7
- County
- — inherits STATE
- City
- — inherits STATE
ZIP-level market 62946
- Active inventory
- 73
- Price-to-rent
- 4.3×
Monthly cashflow live
- Estimated rent
- $1,062 medium interval (Pro) →
- Mortgage (P&I)
- −$288
- Tax from tax record
- −$182 /mo · $2,178/yr
- Insurance
- −$23
- HOA
- −$0
- Vacancy / Maint / Mgmt
- −$223
- Net cashflow
- $346
Break-even live
UW: 25.0% down · 7.5% · 30yr · 1.5% tax · 5.0% vac · 8.0% maint · 8.0% mgmt
Financing live
Cash to close
- Down payment
- $13,750
- Closing costs
- $1,650
- Reserves months
- —
- Total cash needed
- —
Loan-product check · same deal, 3 products live
Conventional
25% down · 7.5% · 30yr
- Down + closing
- —
- Monthly P&I
- —
- Monthly cashflow
- —
- DSCR
- —
- Eligible?
- —
Personal DTI + credit; lowest rate.
DSCR
20% down · 8.5% · 30yr
- Down + closing
- —
- Monthly P&I
- —
- Monthly cashflow
- —
- DSCR
- —
- Eligible?
- —
No personal income docs; deal must DSCR.
Hard money
10% down · 12.0% · 12mo
- Down + closing
- —
- Monthly P&I
- —
- Monthly cashflow
- —
- DSCR
- —
- Eligible?
- —
Short-term bridge; refi at stabilization.
Listing history 30 events
-
2026-06-09days on market $55,000 Active 119 DOM
-
2026-06-08days on market $55,000 Active 118 DOM
-
2026-06-07days on market $55,000 Active 117 DOM
-
2026-06-07days on market $55,000 Active 116 DOM
-
2026-06-04days on market $55,000 Active 113 DOM
-
2026-06-02days on market $55,000 Active 112 DOM
-
2026-06-01days on market $55,000 Active 111 DOM
-
2026-05-31days on market $55,000 Active 110 DOM
-
2026-05-31days on market $55,000 Active 109 DOM
-
2026-02-17historical
-
2026-01-08status Active
-
2026-01-06historical
-
2026-01-06historical
-
2026-01-06status Active
-
2026-01-05historical
-
2025-11-05price
-
2025-10-15price
-
2025-09-23price
-
2025-09-14price
-
2025-08-25price
-
2025-08-05price
-
2025-07-16price
-
2025-07-07Active
Show marketing remark (697 chars)
Charming Home on 1.5 Acres – Motivated Sellers!! Just steps from the park, this classic home offers character, potential, and room to grow. Inside, you’ll find original hardwood floors that highlight the charm of its era, with recent updates including electrical and plumbing (2023). Outside, the property features a large outbuilding plus an extra storage shed—perfect for a chicken coop, workshop, hobbies, or extra storage. While the home could use a little TLC to restore it to its full glory, the possibilities are endless with this unique property in a convenient location. Sellers are motivated and may consider splitting the 1.5 acres, giving buyers added flexibility.
-
2025-07-07$55,000 Active 697-char remark
Show marketing remark (697 chars)
Charming Home on 1.5 Acres – Motivated Sellers!! Just steps from the park, this classic home offers character, potential, and room to grow. Inside, you’ll find original hardwood floors that highlight the charm of its era, with recent updates including electrical and plumbing (2023). Outside, the property features a large outbuilding plus an extra storage shed—perfect for a chicken coop, workshop, hobbies, or extra storage. While the home could use a little TLC to restore it to its full glory, the possibilities are endless with this unique property in a convenient location. Sellers are motivated and may consider splitting the 1.5 acres, giving buyers added flexibility.
-
2022-10-31soldstatus $85,000
-
2022-10-28soldstatus $85,000 Closed
-
2022-10-28soldstatus $85,000
-
2022-09-27historical Under Contract
-
2022-08-16$89,000
-
2022-06-16$89,000 Active
ⓘ Source: listings_history table (triggers on properties + properties_extension) + one-shot
backfill from property_details.listing_events for pre-trigger history.
Tax reassessment forecast IL · Partial reset (capped growth)
- Current annual tax
- $2,178 · $182/mo
- Projected year-2 tax
- $2,178 · $182/mo
- Expected delta
- $0/yr ($0/mo · 0.0%)
ⓘ Screening estimate from a state-policy table — verify with the county assessor before closing.
Climate risk First Street
- Flood 6/10 Major FEMA zone X (shaded) · 72% chance over 30 yrs
- Wildfire 1/10 Low
- Heat 5/10 Major 7 d/yr ≥108°F today · 20 d/yr by 30 yrs out
- Wind 2/10 Low 4% chance of damaging wind over 30 yrs
- Air quality 2/10 Low 1 unhealthy d/yr today · 1 by 30 yrs out
Nearby sold comps map
Loading sold comps map…
Walkable amenities ~0.75 mi
Loading nearby amenities…
Taxation est. · year 1
- Rental income
- $12,741
- − Mortgage interest
- −$3,081
- − Property taxes
- −$2,178
- − Insurance
- −$275
- − Repairs & maintenance
- −$1,019
- − Management
- −$1,019
- − Depreciation
- −$1,600
- Taxable income
- $3,569
- Est. tax owed @ 24.0%
- −$857
- After-tax cash flow
- $3,295/yr
For passive investors: Depreciation is non-cash, so a rental often shows a tax loss while cash-flowing — sheltering income. Rental losses are passive: they offset passive income freely, and up to $25,000/yr can offset ordinary (W-2) income if you actively participate and your MAGI is under $100k (phasing out to $0 by $150k); unused losses carry forward. On sale, claimed depreciation is recaptured at up to 25%, and gains may owe capital-gains tax (a 1031 exchange can defer both). Figures are a year-1 estimate at your 24.0% rate — not tax advice; consult a CPA.
Schools (NCES district)
- District
- Harrisburg CUSD 3
- NCES district ID
- 1718270
- Math proficiency
- 5% ▼ -5.00%
- Reading proficiency
- 25% ▼ -9.00%
- Median HH income
- $38,717
- Composite
- 12.61/100
- National rank
- #9613
- State rank
- #521 of 620 in IL
Livability — Harrisburg
- Score
- 72/100
- State rank
- #309
- US rank
- #6073
Category grades
Schools grade is shown separately in the Schools card above.
Census & demographics
- Census place
- Harrisburg, IL
- Population (ZIP)
- 11,465
Population outlook (Saline County) Hauer SSP2
- Today (2025)
- 23,915 people
- By 2030
- 23,262 · -2.7%
- By 2040
- 21,775 · -8.9%
- By 2050
- 20,098 · -16.0%
- By 2075
- 15,234 · -36.3%
- By 2100
- 10,302 · -56.9%
Race, ethnicity, and origin ACS 2023
- Neighborhood character
- Predominantly White (93%)
- Race & ethnicity
- White 93% Two or more races 4% Black 3%
- Common ancestry
- Italian 2% Slovak 2% Serbian 2%
- Foreign-born
- 0%
Political lean MEDSL · Saline
- 2024 margin
- Solid R (+49.0) · D 24.8% · R 73.8% · Other 1.3%
- 2008→2024 swing
- -40.1pp toward R · 2008: -8.9pp · 2024: -49.0pp
- All cycles
- 2024: R+49.0 2020: R+47.9 2016: R+50.7 2012: R+29.0 2008: R+8.9
Not yet ingested
- Civics
- —
Market trends
- HPI YoY
- ▼ -61.20%
- Current HPI
- 102.6962
- Rent YoY
- —
- Metro
- —
- State GDP YoY
- ▲ 1.59%
- F500 in state
- 60
Industry mix (Fortune 500 HQ in IL)
| Industry | F500 HQs | Revenue |
|---|---|---|
| Insurance | 4 | $201B |
|
||
| Consumer Goods | 4 | $87B |
|
||
| Industrial Machinery | 3 | $64B |
|
||
| Healthcare | 2 | $55B |
|
||
| Retail / Pharmacy | 1 | $148B |
|
||
| Agriculture / Food | 1 | $86B |
|
||
Price history
-38.2% since first listed21 events — show timeline
- 2026-02-17 Listing Removed — MRED as Distributed by MLS Grid
- 2026-01-08 Relisted — MRED as Distributed by MLS Grid
- 2026-01-06 Listing Removed — RMLSA as Distributed by MLS Grid
- 2026-01-06 Listing Removed — MRED as Distributed by MLS Grid
- 2026-01-06 Relisted — MRED as Distributed by MLS Grid
- 2026-01-05 Listing Removed — MRED as Distributed by MLS Grid
- 2025-11-05 Price Changed — RMLSA as Distributed by MLS Grid
- 2025-10-15 Price Changed — RMLSA as Distributed by MLS Grid
- 2025-09-23 Price Changed — RMLSA as Distributed by MLS Grid
- 2025-09-14 Price Changed — RMLSA as Distributed by MLS Grid
- 2025-08-25 Price Changed — RMLSA as Distributed by MLS Grid
- 2025-08-05 Price Changed — RMLSA as Distributed by MLS Grid
- 2025-07-16 Price Changed — RMLSA as Distributed by MLS Grid
- 2025-07-07 Listed $55,000 RMLSA as Distributed by MLS Grid
- 2025-07-07 Listed — RMLSA as Distributed by MLS Grid
- 2022-10-31 Sold (Public Records) $85,000 Public Records
- 2022-10-28 Sold (MLS) $85,000 MRED as Distributed by MLS Grid
- 2022-10-28 Sold (MLS) $85,000 RMLSA as Distributed by MLS Grid
- 2022-09-27 Contingent — RMLSA as Distributed by MLS Grid
- 2022-08-16 Listed $89,000 MRED as Distributed by MLS Grid
- 2022-06-16 Listed $89,000 RMLSA as Distributed by MLS Grid
Property tax history
+28.4%/yrLatest (2024): $2,178 · +6.9% YoY. Source: county tax records.
Cash-flow waterfall
monthlySold comps — $/sqft
last 12 mo · ≤1 miLoading sold comps…