 Triplex
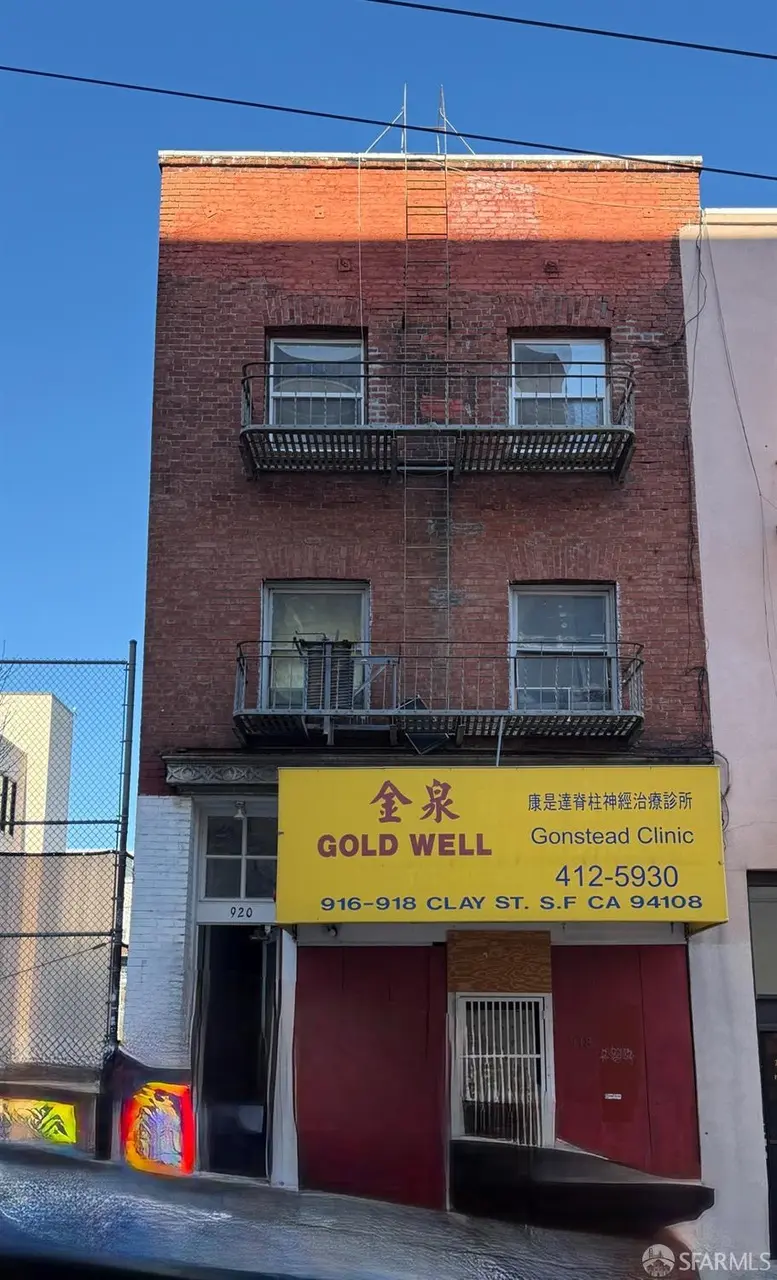
916-920 Clay St · San Francisco, CA
Flood risk 1/10 · Minimal
- FEMA flood zone
- X (unshaded)
- Chance of flooding over 30 yrs
- 0.0%
- Est. flood insurance / yr
- $507 – $1,088
Fire risk 1/10 · Minimal
- Est. fire insurance / yr
- $659 – $1,223
Heat risk 2/10 · Minimal
- Hot days now (above 79°F)
- 7 days/yr
- Hot days in 30 yrs
- 16 days/yr
Wind risk 1/10 · Minimal
- Chance of severe wind over 30 yrs
- —
Air-quality risk 8/10 · Major
- Unhealthy air days now
- 15 days/yr
- Unhealthy air days in 30 yrs
- 15 days/yr
Risk factors via First Street. Map © Google.
Why this score? — see what drove the A- grade
The composite is a weighted blend of 9 inputs, each scored 0–100. Each bar is that input's sub-score; the figure is the points it added to the 100-point composite (weight × sub-score).
- Cash flow +29.3/30.0
- ARV discount +12.5/15.0
- DSCR +10.0/10.0
- Appreciation +8.1/10.0
- 1% rule +7.8/10.0
- Rent growth +5.0/5.0
- Schools +5.0/10.0
- Livability +3.8/5.0
- Condition / age +2.5/5.0
$1,388,000
🖨 Deal sheet 📄 Offer letter ✓ Due diligence
Multi-family units
County records classify this as Multi-Family (5+ Unit). Listing-text estimate: 3 units. estimate disagrees with records
5+ unit building — per-unit beds/baths from public records are typically unavailable; the breakdown below (if shown) is an estimate from the listing text.
Listing remarks MLS
916-920 Clay Street is a mixed-use investment property located in the heart of San Francisco's Chinatown/North Beach corridor. The building features a fully leased ground-floor retail space with basement storage, providing stable income. The upper two floors consist of 12 SRO units (6 per floor) with shared kitchen and bathroom facilities, plus coin-operated laundry on the second floor. Approximately 3,681 SF of living area on a 1,337 SF lot, zoned CRNC. Built in 1907, this property offers strong in-place cash flow with long-term upside potential through operational improvements and repositioning. Conveniently located near public transportation, dining, and neighborhood amenities.
Key facts
- Basement storage
- Dining
- 1,337 sq ft lot
Tags
Neighborhood map
What this means for you Summary
Snapshot
- This is a 3 × 2-bed/?-bath units multifamily listed at $1.39M.
Deal economics
- At list price, monthly cash flow is $5k ($59k/yr) — positive. Per door: $2k/mo.
- The deal already cash-flows at list — no discount required.
- Meets the 1% rule at list price ($18k rent vs $1.39M).
- Recommended offer: $1.30M (6.0% below list) — sets the bar for market timing.
- Cap rate 10.5% vs local median 2.1% in San Francisco — top-decile yield for the area; either an underpriced asset or a hidden risk that comps aren't pricing in. Stress-test before assuming the spread holds.
Location & tenants
- Location reads 76/100 on livability (#90 in CA, #3,143 nationally) — a middle-class / working-renter tenant base. Strengths: amenities A+, commute A+, employment A+; Watch: crime F, cost of living F.
- San Francisco Unified (urban): math 50% / reading 56% proficiency, ranked #322 of 1,400 in CA (top 23%) — acceptable for families but not a draw, mixed tenant base, ~2y average lease.
- Market conditions: Rents rising fast (+14.3%/yr); 28 active listings in the ZIP; 750 units permitted in San Francisco County in 2024 (688 in 5+ unit buildings).
- At $17,727/mo this rent would consume 325% of the median local household income ($65k/yr) (locally 1314% of renters already pay >50% of income on rent) — very limited rent-growth headroom before tenants either downsize or default.
Forward outlook
- In year one you build about $97k of equity ($10k loan paydown + $87k appreciation (6.3% local appreciation)).
- San Francisco County population projected at +39% by 2050 — long-run rental-demand tailwind backs the buy-and-hold thesis.
- At projected returns (6.3% appreciation + 8.0% rent growth), your $389k cash investment doubles in ~3 years — after that, you're playing with house money.
- By year 2, paydown + projected appreciation supports a ~$155k cash-out refi (75% LTV) — recoverable capital for the next deal without selling this one.
Negotiation context
- It's been on market 66 days — a 6% lower offer ($1.30M) is reasonable based on typical stale-listing flexibility.
- Current owner paid $795k; list at $1.39M implies a 75% gain — meaningful room to come down on a strong offer.
Risks & watch-outs
- Watch-outs: built in 1907 — expect roof / HVAC / electrical / plumbing capex.
Questions for the listing agent
- It's been on market 66 days. Have you received any prior offers? Is the seller open to a 6% concession, seller financing, or rate buy-down credit?
- Can we see the unit-by-unit rent roll, current vacancy, and any below-market leases? What's the average tenancy length?
- What capital expenditures (roof, boiler, parking lot, exteriors) have been made in the last 5 years, and what's planned in the next 2?
- Built in 1907 — when were the roof, HVAC, electrical panel, plumbing, and water heater last replaced?
- Why hasn't it sold? Are there any deal-killer items the seller is aware of (foundation, flood, title, zoning, code violations)?
- Is there a deadline driving the sale (1031 exchange, divorce, estate, relocation)? That informs how much negotiation room exists.
- Schools are B-rated — typically a magnet for longer-tenancy family renters. What's the average tenant stay here, and is there a school-zone premium baked into asking?
- Crime grade is F in this area — have there been break-ins, vandalism, or insurance claims at this property in the last 3 years? What carrier currently insures it and at what premium?
- What's the average days-on-market for RENTAL listings here right now (not sales)? A rising rental-DOM trend means longer vacancies and softer asking-rent achievability than the comps imply.
- What's the recent tenant-quality profile in this submarket — average credit score on applications, eviction rate, late-payment / NSF rate, and stable-employment percentage? A property-management company in the area should have these aggregated.
- How much new apartment / multifamily construction is in the pipeline within 1–3 miles? Heavy new supply (>2% of stock underway) typically softens rents 12–24 months out; light construction supports rent growth.
Investment metrics
- 1% rule
- 1.28% ✓
- Cap rate
- 10.52%
- Cash-on-cash
- 15.10%
- DSCR
- 1.67
- GRM
- 6.5
CMA / ARV
- ARV (median comp)
- $1,561,959
- List price
- $1,388,000
- Delta
- -11.14%
- Verdict
- UNDERPRICED
- Comps
- 20 within 1.0 mi
Show comp detail 12 sales within ~0.75 mi
| Address | Dist | Beds/Ba | Sqft | Sold | Price | $/sf | Match |
|---|---|---|---|---|---|---|---|
| 1100 Clay St | 0.17mi | 3/— | 3,390 (-8%) | 0mo | $2,040,000 | $602 | 78 |
| 1272-1276 Sacramento St | 0.33mi | 6/3.0 | 3,765 (+2%) | 3mo | $2,200,000 | $584 | 71 |
| 837-839 Filbert St | 0.53mi | 6/2.0 | 3,666 (-0%) | 10mo | $2,090,000 | $570 | 62 |
| 1312-1314 Powell St | 0.20mi | 6/3.0 | 3,215 (-13%) | 4mo | $1,650,000 | $513 | 58 |
| 1269-1273 Pacific Ave | 0.44mi | 9/3.0 | 3,861 (+5%) | 10mo | $1,250,000 | $324 | 55 |
| 806-810 Union St | 0.48mi | 7/3.5 | 3,600 (-2%) | 11mo | $1,838,000 | $511 | 55 |
| 1029-1031 Jackson St | 0.22mi | 7/5.0 | 4,061 (+10%) | 3mo | $3,050,000 | $751 | 54 |
| 824-826 Vallejo St | 0.33mi | 6/5.0 | 3,852 (+5%) | 8mo | $3,150,000 | $818 | 54 |
| 392-394 Chestnut St | 0.71mi | 5/3.0 | 3,749 (+2%) | 4mo | $4,180,000 | $1,115 | 53 |
| 1475-1479 Washington St | 0.51mi | 9/3.0 | 3,904 (+6%) | 11mo | $2,350,000 | $602 | 49 |
| 2118-2122 Mason St | 0.67mi | —/— | 4,140 (+12%) | 1mo | $2,155,000 | $521 | 47 |
| 950-954 Vallejo St | 0.39mi | 9/4.0 | 4,032 (+10%) | 9mo | $2,000,000 | $496 | 47 |
Match score weights: distance 35% · size 25% · config 20% · recency 20%. Top-matched comps best support the ARV.
Projected returns pro-forma
6.29% appreciation · 8.0% rent growth · sell at horizon
- IRR
- 31.3%
- Equity multiple
- 3.14×
- Total profit
- $829,977
- Equity at exit
- $898,162
- IRR
- 31.2%
- Equity multiple
- 7.24×
- Total profit
- $2,423,799
- Equity at exit
- $1,651,346
Cash invested: $388,640 (down + closing). Projections, not guarantees.
Landlord ↔ Tenant lean methodology
- Overall (CITY)
- 0 Strongly Tenant-Friendly
- State California
- 18 Strongly Tenant-Friendly · D+13
- County
- — inherits STATE
- City San Francisco
- 0 Strongly Tenant-Friendly · D+57
ZIP-level market 94108
- Home prices YoY
- 3.8%
- Rents YoY
- 14.3%
- Active inventory
- 28
- Price-to-rent
- 19.6×
Monthly cashflow live
- Estimated rent
- $17,727 high interval (Pro) →
- Mortgage (P&I)
- −$7,279
- Tax from tax record
- −$1,256 /mo · $15,076/yr
- Insurance
- −$578
- HOA
- −$0
- Vacancy / Maint / Mgmt
- −$3,723
- Net cashflow
- $4,891
Break-even live
3-unit breakdown (identical units grouped — click to expand)
| Units | Beds | Baths | Est. rent |
|---|---|---|---|
| 3× units | 2 | — | $17,727 |
| #1 | 2 | — | $5,909 |
| #2 | 2 | — | $5,909 |
| #3 | 2 | — | $5,909 |
| Total (3 units) | $17,727 | ||
UW: 25.0% down · 7.5% · 30yr · 1.5% tax · 5.0% vac · 8.0% maint · 8.0% mgmt
Financing live
Cash to close
- Down payment
- $347,000
- Closing costs
- $41,640
- Reserves months
- —
- Total cash needed
- —
Loan-product check · same deal, 3 products live
Conventional
25% down · 7.5% · 30yr
- Down + closing
- —
- Monthly P&I
- —
- Monthly cashflow
- —
- DSCR
- —
- Eligible?
- —
Personal DTI + credit; lowest rate.
DSCR
20% down · 8.5% · 30yr
- Down + closing
- —
- Monthly P&I
- —
- Monthly cashflow
- —
- DSCR
- —
- Eligible?
- —
No personal income docs; deal must DSCR.
Hard money
10% down · 12.0% · 12mo
- Down + closing
- —
- Monthly P&I
- —
- Monthly cashflow
- —
- DSCR
- —
- Eligible?
- —
Short-term bridge; refi at stabilization.
Listing history 16 events
-
2026-06-18days on market $1,388,000 Active 66 DOM
-
2026-06-17days on market $1,388,000 Active 65 DOM
-
2026-06-16days on market $1,388,000 Active 64 DOM
-
2026-06-15days on market $1,388,000 Active 63 DOM
-
2026-06-13days on market $1,388,000 Active 61 DOM
-
2026-06-13days on market $1,388,000 Active 60 DOM
-
2026-06-09days on market $1,388,000 Active 57 DOM
-
2026-06-08days on market $1,388,000 Active 56 DOM
-
2026-06-07days on market $1,388,000 Active 55 DOM
-
2026-06-04days on market $1,388,000 Active 52 DOM
-
2026-06-03days on market $1,388,000 Active 51 DOM
-
2026-06-02days on market $1,388,000 Active 50 DOM
-
2026-06-01days on market $1,388,000 Active 49 DOM
-
2026-05-31days on market $1,388,000 Active 48 DOM
-
2026-04-13$1,388,000 Active 689-char remark
Show marketing remark (689 chars)
916-920 Clay Street is a mixed-use investment property located in the heart of San Francisco's Chinatown/North Beach corridor. The building features a fully leased ground-floor retail space with basement storage, providing stable income. The upper two floors consist of 12 SRO units (6 per floor) with shared kitchen and bathroom facilities, plus coin-operated laundry on the second floor. Approximately 3,681 SF of living area on a 1,337 SF lot, zoned CRNC. Built in 1907, this property offers strong in-place cash flow with long-term upside potential through operational improvements and repositioning. Conveniently located near public transportation, dining, and neighborhood amenities.
-
2014-01-22soldstatus $795,000
ⓘ Source: listings_history table (triggers on properties + properties_extension) + one-shot
backfill from property_details.listing_events for pre-trigger history.
Tax reassessment forecast CA · Resets to sale price
- Current annual tax
- $15,076 · $1,256/mo
- Projected year-2 tax
- $15,076 · $1,256/mo
- Expected delta
- $0/yr ($0/mo · 0.0%)
ⓘ Screening estimate from a state-policy table — verify with the county assessor before closing.
Climate risk First Street
- Flood 1/10 Low FEMA zone X (unshaded) · 0% chance over 30 yrs
- Wildfire 1/10 Low
- Heat 2/10 Low 7 d/yr ≥79°F today · 16 d/yr by 30 yrs out
- Wind 1/10 Low
- Air quality 8/10 Severe 15 unhealthy d/yr today · 15 by 30 yrs out
Nearby sold comps map
Loading sold comps map…
Walkable amenities ~0.75 mi
Loading nearby amenities…
Taxation est. · year 1
- Rental income
- $212,724
- − Mortgage interest
- −$77,750
- − Property taxes
- −$15,076
- − Insurance
- −$6,940
- − Repairs & maintenance
- −$17,018
- − Management
- −$17,018
- − Depreciation
- −$40,378
- Taxable income
- $38,545
- Est. tax owed @ 24.0%
- −$9,251
- After-tax cash flow
- $49,440/yr
For passive investors: Depreciation is non-cash, so a rental often shows a tax loss while cash-flowing — sheltering income. Rental losses are passive: they offset passive income freely, and up to $25,000/yr can offset ordinary (W-2) income if you actively participate and your MAGI is under $100k (phasing out to $0 by $150k); unused losses carry forward. On sale, claimed depreciation is recaptured at up to 25%, and gains may owe capital-gains tax (a 1031 exchange can defer both). Figures are a year-1 estimate at your 24.0% rate — not tax advice; consult a CPA.
Schools (NCES district)
- District
- San Francisco Unified
- NCES district ID
- 0634410
- Math proficiency
- 50% ▬ 0.00%
- Reading proficiency
- 56% ▲ 1.00%
- Median HH income
- $81,249
- Composite
- 50.14/100
- National rank
- #4088
- State rank
- #322 of 1400 in CA
Livability — San Francisco
- Score
- 76/100
- State rank
- #90
- US rank
- #3143
Category grades
Schools grade is shown separately in the Schools card above.
Census & demographics
- Census place
- San Francisco, CA
- County
- San Francisco County · 827,552 people
- City population
- 827,552
- Metro
- San Francisco-Oakland-Berkeley, CA
- Population (ZIP)
- 11,305
- Household income
- $65,388
- Rent vs Own
- Severe rent burden
- 1314.0
Population outlook (San Francisco County) Hauer SSP2
- Today (2025)
- 1,030,936 people
- By 2030
- 1,110,409 · +7.7%
- By 2040
- 1,270,010 · +23.2%
- By 2050
- 1,435,001 · +39.2%
- By 2075
- 1,779,074 · +72.6%
- By 2100
- 1,966,767 · +90.8%
Race, ethnicity, and origin ACS 2023
- Neighborhood character
- Diverse neighborhood (Simpson 0.62)
- Race & ethnicity
- Asian 53% White 30% Two or more races 8% Hispanic / Latino 7% Black 2%
- Hispanic origin (detail)
- Mexican 4%
- Common ancestry
- Italian 2% Lithuanian 2% Slovak 2%
- Foreign-born
- 51% · China, Canada, Vietnam
- Languages at home
- 41% English-only · Chinese 42% Spanish 4% Other Indo-European 4%
Political lean MEDSL · San Francisco
- 2024 margin
- Solid D (+64.8) · D 80.3% · R 15.5% · Other 4.1%
- 2008→2024 swing
- -5.7pp toward R · 2008: 70.5pp · 2024: 64.8pp
- All cycles
- 2024: D+64.8 2020: D+72.5 2016: D+76.1 2012: D+70.2 2008: D+70.5
Not yet ingested
- Civics
- —
Market trends
- HPI YoY
- ▲ 6.29%
- Current HPI
- 172.8561
- Rent YoY
- ▲ 14.33%
- Metro
- San Francisco-Oakland-Berkeley, CA
- State GDP YoY
- ▲ 3.21%
- F500 in state
- 116
Industry mix (Fortune 500 HQ in CA)
| Industry | F500 HQs | Revenue |
|---|---|---|
| Technology | 27 | $1,492B |
|
||
| Financial Services | 3 | $174B |
|
||
| Retail | 3 | $44B |
|
||
| Insurance | 3 | $26B |
|
||
| Media / Entertainment | 2 | $115B |
|
||
| Pharmaceuticals / Biotech | 2 | $62B |
|
||
Price history
+74.6% since first listed2 events — show timeline
- 2026-04-13 Listed $1,388,000 San Francisco MLS
- 2014-01-22 Sold (Public Records) $795,000 Public Records
Property tax history
-1.3%/yrLatest (2025): $15,076 · +3.8% YoY. Source: county tax records.
Cash-flow waterfall
monthlySold comps — $/sqft
last 12 mo · ≤1 miLoading sold comps…