10208 Neptune Ct · Waco, TX
Flood risk 1/10 · Minimal
- FEMA flood zone
- X (unshaded)
- Chance of flooding over 30 yrs
- 0.0%
- Est. flood insurance / yr
- $507 – $1,088
Fire risk 6/10 · Moderate
- Est. fire insurance / yr
- $1,222 – $2,270
Heat risk 7/10 · Major
- Hot days now (above 109°F)
- 7 days/yr
- Hot days in 30 yrs
- 23 days/yr
Wind risk 6/10 · Moderate
- Chance of severe wind over 30 yrs
- 61.0%
Air-quality risk 2/10 · Minimal
- Unhealthy air days now
- 0 days/yr
- Unhealthy air days in 30 yrs
- 1 days/yr
Risk factors via First Street. Map © Google.
Why this score? — see what drove the D+ grade
The composite is a weighted blend of 9 inputs, each scored 0–100. Each bar is that input's sub-score; the figure is the points it added to the 100-point composite (weight × sub-score).
- ARV discount +15.0/15.0
- Cash flow +11.2/30.0
- Schools +5.1/10.0
- Livability +3.7/5.0
- 1% rule +3.4/10.0
- DSCR +3.3/10.0
- Rent growth +2.3/5.0
- Condition / age +2.0/5.0
- Appreciation +0.0/10.0
$293,465
🖨 Deal sheet (PDF) 📄 Offer letter ✓ Due diligence
Listing remarks
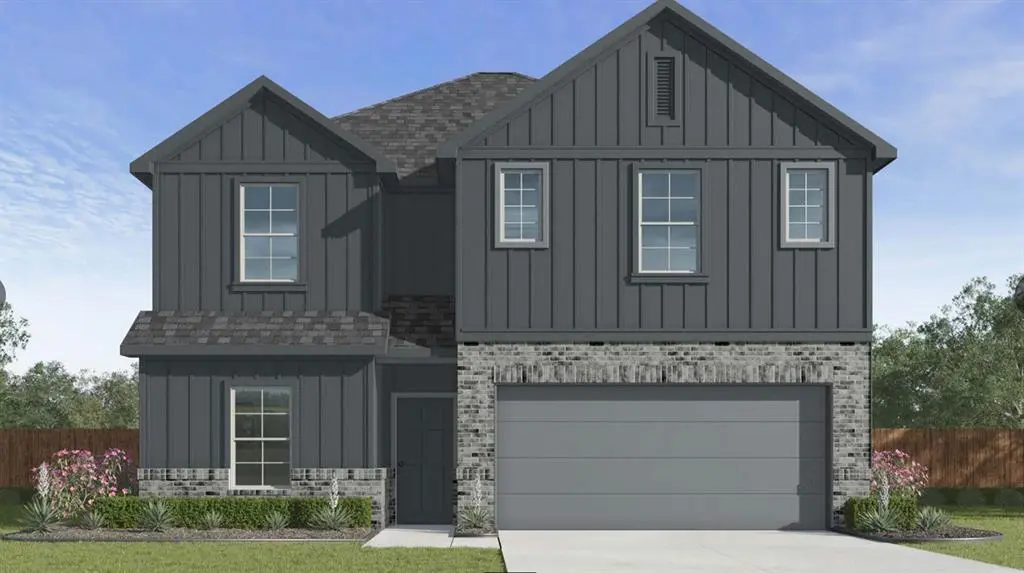
Welcome to the Madison floorplan at Eagles Landing in China Spring, Texas is a 4-bedroom, 2-bathroom two-story home covering approximately 2,076 sq. ft. The 2-car garage ensures plenty of space for vehicles and storage. As you step inside, you'll immediately notice the attention to detail and high-quality finishes throughout. The kitchen boasts beautiful flat panel birch cabinets, quartz countertops, and stainless-steel appliances, making it a chef's dream. The LED lighting adds a modern touch and creates a warm ambiance. On the second floor you will find the primary and secondary bedrooms with the laundry room and secondary bathroom. The secondary bedrooms have carpeted flooring and are co
Key facts
- Quartz countertops
- Led lighting
- Walk-in closet
Tags
Neighborhood map
What this means for you Summary
Snapshot
- This is a 4-bed/2.5-bath single-family listed at $293k. Condition is rated fair.
Deal economics
- At list price, monthly cash flow is $-111 ($-1k/yr) — negative.
- To cash-flow at today's rent, offer at most $277k (5.5% below list).
- To meet the 1% rule (rent ≥ 1% of price), the offer needs to be $245k (16.5% below list).
- Recommended offer: $245k (16.5% below list) — sets the bar for 1% rule.
- Cap rate 5.8% vs local median 3.9% in Waco — top-decile yield for the area; either an underpriced asset or a hidden risk that comps aren't pricing in. Stress-test before assuming the spread holds.
Location & tenants
- Location reads 74/100 on livability (#166 in TX, #4,378 nationally) — a middle-class / working-renter tenant base. Strengths: cost of living A+, housing A+, health & safety A+; Watch: crime D, commute F, employment D-.
- China Spring ISD (rural): math 58% / reading 56% proficiency, ranked #70 of 826 in TX (top 8%) — acceptable for families but not a draw, mixed tenant base, ~2y average lease.
- Zoned schools: China Spring El (math 37% / reading 47%, grade F, #1,335 of 4,322 statewide, top 33%, 677 students, 36% FRL).
- Zoned-school proficiency averages 42% at this address vs 57% district-wide (-15 pts) — the specific schools serving this property underperform the China Spring ISD average; the district grade overstates school quality for this exact location.
- Market conditions: Rents soft (-0.8%/yr); 376 active listings in the ZIP; 3 comparable units currently listed for rent nearby; rentals at typical pace (median 22d on market — plan ~3-4 weeks tenant-placement turnaround); 1,014 units permitted in McLennan County in 2024 (200 in 5+ unit buildings).
- This rent runs 43% of the median local income ($69k/yr) — at the standard rent-burdened threshold; future hikes will face affordability resistance.
Forward outlook
- Local home prices are declining (-3.0%/yr); year-one equity from $2k of loan paydown is wiped out by about $9k of value loss. Plan a longer hold.
- McLennan County population projected at +17% by 2050 — long-run rental-demand tailwind backs the buy-and-hold thesis.
Negotiation context
- Only 3 days on market — expect competitive offers; lowballing is unlikely to land.
Risks & watch-outs
- Climate carrying-cost: major wind risk, 61% chance of damaging wind over 30y; major wildfire risk; extreme-heat days projected 7→23/yr by 2055 (HVAC capex compounding) — expect insurance premiums to compound above CPI over the hold.
Questions for the listing agent
- What do current leases actually rent for vs. the listed asking? Can we see a recent rent roll and the last 12 months of T-12 income?
- Have any recent inspections been done? Can we get a copy of the seller's disclosures and any deferred-maintenance estimates?
- What does the HOA fee cover, when was the last increase, and are there any pending special assessments or reserve-fund shortfalls?
- Is there a deadline driving the sale (1031 exchange, divorce, estate, relocation)? That informs how much negotiation room exists.
- Schools are D-rated, which usually means shorter tenancies and higher turnover. Who's the typical renter profile here, and what's been the actual vacancy rate?
- Crime grade is D in this area — have there been break-ins, vandalism, or insurance claims at this property in the last 3 years? What carrier currently insures it and at what premium?
- The area grade is low — what's the realistic commute time and amenity access for the typical tenant pool here? Any planned neighborhood developments (good or bad) we should know about?
- What's the average days-on-market for RENTAL listings here right now (not sales)? A rising rental-DOM trend means longer vacancies and softer asking-rent achievability than the comps imply.
- What's the recent tenant-quality profile in this submarket — average credit score on applications, eviction rate, late-payment / NSF rate, and stable-employment percentage? A property-management company in the area should have these aggregated.
- How much new for-sale + rental construction is in the pipeline within 1–3 miles? Heavy new supply typically softens prices + rents 12–24 months out; constrained supply supports both.
Investment metrics
- 1% rule
- 0.84% ✗
- Cap rate
- 5.84%
- Cash-on-cash
- -1.62%
- DSCR
- 0.93
- GRM
- 10.0
CMA / ARV
- ARV (on-the-fly)
- $381,984
- Comps found
- 12
Show comp detail 12 sales within ~0.75 mi
| Address | Dist | Beds/Ba | Sqft | Sold | Price | $/sf | Match |
|---|---|---|---|---|---|---|---|
| 5825 Foggy Lagoon Dr | 0.39mi | 4/2.0 | 2,150 (+4%) | 3mo | $325,000 | $151 | 71 |
| 10516 T Bury | 0.51mi | 4/2.5 | 2,028 (-2%) | 4mo | $379,900 | $187 | 69 |
| 10401 T Bury Ln | 0.50mi | 4/2.0 | 2,131 (+3%) | 3mo | $469,990 | $221 | 68 |
| 5731 Foggy Lagoon Dr | 0.39mi | 3/2.0 (-1) | 2,150 (+4%) | 3mo | $341,570 | $159 | 66 |
| 5719 Foggy Lagoon Dr | 0.40mi | 3/2.0 (-1) | 2,150 (+4%) | 5mo | $344,015 | $160 | 64 |
| 5444 Zavalla Dr | 0.34mi | 3/2.0 (-1) | 1,930 (-7%) | 2mo | $399,900 | $207 | 63 |
| 105 Gail Dr | 0.67mi | 4/2.0 | 2,160 (+4%) | 1mo | $294,777 | $136 | 59 |
| 5605 Beckon Fls | 0.61mi | 4/2.5 | 1,953 (-6%) | 4mo | $323,420 | $166 | 58 |
| 5601 Berkley Heights Dr | 0.56mi | 3/2.0 (-1) | 2,150 (+4%) | 3mo | $300,230 | $140 | 58 |
| 5409 Black Horse Ct | 0.44mi | 3/2.0 (-1) | 1,918 (-8%) | 4mo | $389,990 | $203 | 56 |
| 10517 Rayburn Way | 0.33mi | 3/2.0 (-1) | 1,851 (-11%) | 5mo | $349,900 | $189 | 55 |
| 10616 Whitney Trce | 0.40mi | 4/3.0 | 1,795 (-14%) | 4mo | $329,999 | $184 | 53 |
Match score weights: distance 35% · size 25% · config 20% · recency 20%. Top-matched comps best support the ARV.
Projected returns pro-forma
-3.0% appreciation · 0.0% rent growth · sell at horizon
- IRR
- -22.4%
- Equity multiple
- 0.25×
- Total profit
- $-61,766
- Equity at exit
- $43,757
- IRR
- -26.8%
- Equity multiple
- -0.10×
- Total profit
- $-90,464
- Equity at exit
- $25,373
Cash invested: $82,170 (down + closing). Projections, not guarantees.
Landlord ↔ Tenant lean methodology
- Overall (STATE)
- 87 Strongly Landlord-Friendly
- State Texas
- 87 Strongly Landlord-Friendly · R+5
- County
- — inherits STATE
- City
- — inherits STATE
ZIP-level market 76708
- Home prices YoY
- -26.5%
- Rents YoY
- -0.8%
- Active inventory
- 376
- Price-to-rent
- 10.0×
Monthly cashflow live
- Estimated rent
- $2,452 medium interval (Pro) →
- Mortgage (P&I)
- −$1,539
- Tax est. 1.5%
- −$367 /mo · $4,402/yr
- Insurance
- −$122
- HOA
- −$20
- Vacancy / Maint / Mgmt
- −$515
- Net cashflow
- $-111
Break-even live
Sensitivity live
| Price | -10% $92 | -5% $-10 | +0% $-111 | +5% $-212 | +10% $-314 |
|---|---|---|---|---|---|
| Rent | -10% $-305 | -5% $-208 | +0% $-111 | +5% $-14 | +10% $83 |
| Rate | -1.0pp $37 | -0.5pp $-36 | base $-111 | +0.5pp $-187 | +1.0pp $-264 |
UW: 25.0% down · 7.5% · 30yr · 1.5% tax · 5.0% vac · 8.0% maint · 8.0% mgmt
Financing live
Cash to close
- Down payment
- $73,366
- Closing costs
- $8,804
- Reserves months
- —
- Total cash needed
- —
Loan-product check · same deal, 3 products live
Conventional
25% down · 7.5% · 30yr
- Down + closing
- —
- Monthly P&I
- —
- Monthly cashflow
- —
- DSCR
- —
- Eligible?
- —
Personal DTI + credit; lowest rate.
DSCR
20% down · 8.5% · 30yr
- Down + closing
- —
- Monthly P&I
- —
- Monthly cashflow
- —
- DSCR
- —
- Eligible?
- —
No personal income docs; deal must DSCR.
Hard money
10% down · 12.0% · 12mo
- Down + closing
- —
- Monthly P&I
- —
- Monthly cashflow
- —
- DSCR
- —
- Eligible?
- —
Short-term bridge; refi at stabilization.
Rent comps 3 comps
| Address | Beds | Baths | Sqft | Rent | $/sqft | DOM | Units | Dist |
|---|---|---|---|---|---|---|---|---|
| 10201 Altair Dr Waco, TX | 4.0 | 2.0 | 2032 | $2,600 | $1.28 | 21d | 1 | 0.04mi |
| 5516 Pinery Dr Waco, TX | 3.0 | 2.5 | 2124 | $2,600 | $1.22 | 14d | 1 | 0.58mi |
| 10220 Lilac Waco, TX | 3.0 | 2.0 | 1500 | $1,695 | $1.13 | 44d | 1 | 0.93mi |
HOA detail
- Monthly dues
- $20 · $240/yr
Listing history 2 events
-
2026-04-13status Pending
-
2026-04-08$293,465 Active
ⓘ Source: listings_history table (triggers on properties + properties_extension) + one-shot
backfill from property_details.listing_events for pre-trigger history.
Climate risk First Street
- Flood 1/10 Low FEMA zone X (unshaded) · 0% chance over 30 yrs
- Wildfire 6/10 Major
- Heat 7/10 Severe 7 d/yr ≥109°F today · 23 d/yr by 30 yrs out
- Wind 6/10 Major 61% chance of damaging wind over 30 yrs
- Air quality 2/10 Low 0 unhealthy d/yr today · 1 by 30 yrs out
Nearby sold comps map
Loading sold comps map…
Walkable amenities ~0.75 mi
Loading nearby amenities…
Taxation est. · year 1
- Rental income
- $29,422
- − Mortgage interest
- −$16,439
- − Property taxes
- −$4,402
- − Insurance
- −$1,467
- − Repairs & maintenance
- −$2,354
- − Management
- −$2,354
- − HOA
- −$240
- − Depreciation
- −$8,537
- Taxable loss
- −$6,370
- Est. tax savings @ 24.0%
- +$1,529
- After-tax cash flow
- $196/yr
For passive investors: Depreciation is non-cash, so a rental often shows a tax loss while cash-flowing — sheltering income. Rental losses are passive: they offset passive income freely, and up to $25,000/yr can offset ordinary (W-2) income if you actively participate and your MAGI is under $100k (phasing out to $0 by $150k); unused losses carry forward. On sale, claimed depreciation is recaptured at up to 25%, and gains may owe capital-gains tax (a 1031 exchange can defer both). Figures are a year-1 estimate at your 24.0% rate — not tax advice; consult a CPA.
Condition & rehab AI · 4 photos
The home is under construction and requires significant work to complete the exterior siding, interior finishes, flooring, systems, landscaping, and fencing. Once completed, it will be move-in ready and have a significant increase in its resale and rental value.
Repairs flagged
- Major Exterior siding — The exterior siding is only partially installed, indicating significant work is needed to complete the exterior.
- Major Interior finishes — The interior is completely unfinished, requiring extensive work to complete the living spaces.
- Major Flooring — Flooring is not yet installed in any room, requiring significant work to complete the living spaces.
- Major Systems — No systems are installed or operational in the home, requiring significant work to complete the living spaces and ensure functionality.
- Minor Landscaping — Minimal landscaping is present, which can be improved with additional plants and landscaping features.
- Minor Fencing — The fencing is only partially installed, which can be completed with additional fencing posts and panels. The independent image shows a partially installed fence, while the listing photo shows a fully installed fence. This discrepancy suggests the fence may be newly installed or partially completed between the independent and listing photos.
Value-add opportunities
- Both Complete exterior siding — Completing the exterior siding will improve the home's curb appeal and increase its resale and rental value.
- Both Install interior finishes — Completing the interior finishes will make the home move-in ready and increase its resale and rental value.
- Both Install flooring — Completing the flooring will make the home move-in ready and increase its resale and rental value.
- Both Install systems — Completing the systems will make the home fully functional and increase its resale and rental value.
- Both Complete landscaping — Completing the landscaping will improve the home's curb appeal and increase its resale and rental value.
- Both Complete fencing — Completing the fencing will improve the home's curb appeal and increase its resale and rental value. The discrepancy between the independent and listing photos suggests the fence may be newly installed or partially completed, which can be completed with additional fencing posts and panels.
Renovation cost estimate screening
| Repair item | Severity | Est. cost |
|---|---|---|
| Exterior siding · The exterior siding is only partially installed, indicating significant work is needed to complete the exterior. | Major | $15,000–50,000 |
| Interior finishes · The interior is completely unfinished, requiring extensive work to complete the living spaces. | Major | $15,000–50,000 |
| Flooring · Flooring is not yet installed in any room, requiring significant work to complete the living spaces. | Major | $15,000–50,000 |
| Systems · No systems are installed or operational in the home, requiring significant work to complete the living spaces and ensure functionality. | Major | $15,000–50,000 |
| Landscaping · Minimal landscaping is present, which can be improved with additional plants and landscaping features. | Minor | $500–3,000 |
| Fencing · The fencing is only partially installed, which can be completed with additional fencing posts and panels. The independent image shows a partially installed fence, while the listing photo shows a fully installed fence. This discrepancy suggests the fence may be newly installed or partially completed between the independent and listing photos. | Minor | $500–3,000 |
| Total estimated repair cost · 6 items | $61,000–206,000 |
Value-add ROI direction
- Both Complete exterior siding — Completing the exterior siding will improve the home's curb appeal and increase its resale and rental value. ↑
- Both Install interior finishes — Completing the interior finishes will make the home move-in ready and increase its resale and rental value. ↑
- Both Install flooring — Completing the flooring will make the home move-in ready and increase its resale and rental value. ↑
- Both Install systems — Completing the systems will make the home fully functional and increase its resale and rental value. ↑
- Both Complete landscaping — Completing the landscaping will improve the home's curb appeal and increase its resale and rental value. ↑
- Both Complete fencing — Completing the fencing will improve the home's curb appeal and increase its resale and rental value. The discrepancy between the independent and listing photos suggests the fence may be newly installed or partially completed, which can be completed with additional fencing posts and panels. ↑
ⓘ Cost ranges are severity-bucket heuristics (US national rule-of-thumb). Get contractor quotes + a written scope before underwriting a rehab budget.
Schools (NCES district)
- District
- China Spring ISD
- NCES district ID
- 4813960
- Math proficiency
- 58% ▼ -2.00%
- Reading proficiency
- 56% ▼ -1.00%
- Median HH income
- $71,314
- Composite
- 50.64/100
- National rank
- #1837
- State rank
- #70 of 826 in TX
Livability — Waco
- Score
- 74/100
- State rank
- #166
- US rank
- #4378
Category grades
Schools grade is shown separately in the Schools card above.
Census & demographics
- Census place
- Waco, TX
- County
- McLennan County · 213,088 people
- City population
- 125,319
- Metro
- Waco, TX
- Population (ZIP)
- 27,790
- Household income
- $68,856
- Rent vs Own
- Severe rent burden
- 583.0
Population outlook (McLennan County) Hauer SSP2
- Today (2025)
- 264,191 people
- By 2030
- 273,578 · +3.6%
- By 2040
- 291,506 · +10.3%
- By 2050
- 308,044 · +16.6%
- By 2075
- 349,648 · +32.3%
- By 2100
- 364,779 · +38.1%
Race, ethnicity, and origin ACS 2023
- Neighborhood character
- Diverse neighborhood (Simpson 0.63)
- Race & ethnicity
- White 50% Hispanic / Latino 31% Two or more races 20% Black 13% Asian 2%
- Hispanic origin (detail)
- Mexican 28%
- Common ancestry
- Slovak 2% Lithuanian 1% Italian 1%
- Foreign-born
- 11% · Canada, Vietnam
- Languages at home
- 76% English-only · Spanish 21% Other Asian/Pacific 1%
Political lean MEDSL · McLennan
- 2024 margin
- Solid R (+30.9) · D 34.0% · R 64.9% · Other 1.0%
- 2008→2024 swing
- -7.0pp toward R · 2008: -23.9pp · 2024: -30.9pp
- All cycles
- 2024: R+30.9 2020: R+23.4 2016: R+27.1 2012: R+29.8 2008: R+23.9
Not yet ingested
- Civics
- —
Market trends
- HPI YoY
- ▼ -78.80%
- Current HPI
- 218.9643
- Rent YoY
- ▼ -0.80%
- Metro
- Waco, TX
- State GDP YoY
- ▲ 3.95%
- F500 in state
- 110
Industry mix (Fortune 500 HQ in TX)
| Industry | F500 HQs | Revenue |
|---|---|---|
| Energy | 16 | $1,198B |
|
||
| Technology | 5 | $198B |
|
||
| Engineering / Construction | 4 | $72B |
|
||
| Energy Services | 3 | $60B |
|
||
| Utilities | 3 | $41B |
|
||
| Healthcare | 2 | $330B |
|
||
Price history
2 events — show timeline
- 2026-04-13 Pending — NTREIS
- 2026-04-08 Listed $293,465 NTREIS
Cash-flow waterfall
monthlySold comps — $/sqft
last 12 mo · ≤1 miLoading sold comps…