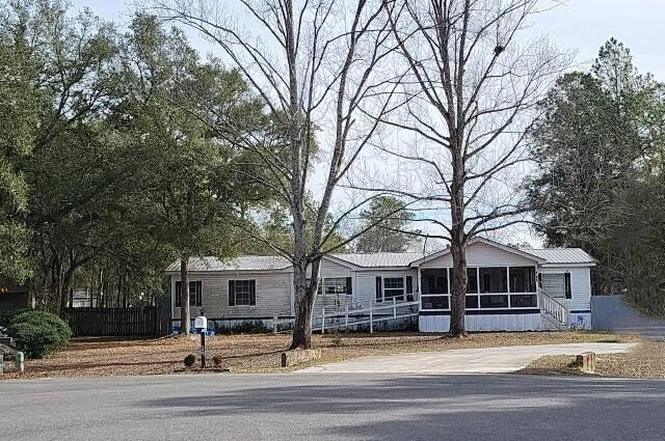
19 Widgeon Ct · Savannah, GA
Flood risk 1/10 · Minimal
- FEMA flood zone
- AE
- Chance of flooding over 30 yrs
- 0.0%
- Est. flood insurance / yr
- $1,737 – $8,500
Fire risk 6/10 · Moderate
- Est. fire insurance / yr
- $963 – $1,789
Heat risk 9/10 · Severe
- Hot days now (above 108°F)
- 7 days/yr
- Hot days in 30 yrs
- 19 days/yr
Wind risk 8/10 · Major
- Chance of severe wind over 30 yrs
- 98.0%
Air-quality risk 2/10 · Minimal
- Unhealthy air days now
- 1 days/yr
- Unhealthy air days in 30 yrs
- 2 days/yr
Risk factors via First Street. Map © Google.
Why this score? — see what drove the B- grade
The composite is a weighted blend of 9 inputs, each scored 0–100. Each bar is that input's sub-score; the figure is the points it added to the 100-point composite (weight × sub-score).
- Cash flow +30.0/30.0
- 1% rule +10.0/10.0
- DSCR +10.0/10.0
- ARV discount +7.5/15.0
- Livability +4.3/5.0
- Condition / age +2.5/5.0
- Schools +2.0/10.0
- Rent growth +1.1/5.0
- Appreciation +0.0/10.0
$105,420
🖨 Deal sheet (PDF) 📄 Offer letter ✓ Due diligence
Listing remarks MLS
Come see this 4 Bedroom, 2 bathroom home located on . 65 acre homesite. Features include an additional space off the master bedroom could be used as an office or a nursery, a large screened entry porch, a detached 2-car garage, fenced yard and a large deck for entertaining! Sold As???????????????????????????????????????? is.
Key facts
- 0.65 acre lot
- Garage
- Built 1995
Neighborhood map
What this means for you Summary
Snapshot
- This is a 3-bed/2.0-bath land listed at $105k.
Deal economics
- At list price, monthly cash flow is $598 ($7k/yr) — positive.
- The deal already cash-flows at list — no discount required.
- Meets the 1% rule at list price ($2k rent vs $105k).
- Recommended offer: $104k (1.5% below list) — sets the bar for market timing.
- Cap rate 18.0% vs local median 4.0% in Savannah — top-decile yield for the area; either an underpriced asset or a hidden risk that comps aren't pricing in. Stress-test before assuming the spread holds.
Location & tenants
- Location reads 86/100 on livability (#1 in GA, #397 nationally) — a professional / high-income tenant draw. Strengths: crime A+, amenities A+, commute A+; Watch: employment D.
- Savannah-Chatham County (urban): math 20% / reading 26% proficiency, ranked #134 of 174 in GA (top 77%) — low school quality limits family demand, transient renter base, plan for 1-2y turnover.
- Zoned schools: Bloomingdale Elementary School (math 12% / reading 22%, grade F, #936 of 1,228 statewide, top 79%, 362 students, 67% FRL); West Chatham Middle School (math 10% / reading 14%, grade F, #417 of 470 statewide, top 90%, 953 students, 72% FRL); New Hampstead High School (math 12% / reading 25%, grade F, #254 of 424 statewide, top 61%, 1,436 students, 58% FRL).
- Market conditions: Rents falling (-5.5%/yr); 262 active listings in the ZIP; 17 comparable units currently listed for rent nearby; rentals lingering (median 45d on market — plan ~5-8 weeks vacancy on turnover, expect pricing pressure); 94% of comp listings sitting > 30 days — soft ceiling on asking rent; 2,694 units permitted in Chatham County in 2024 (973 in 5+ unit buildings).
- This rent runs 42% of the median local income ($69k/yr) — at the standard rent-burdened threshold; future hikes will face affordability resistance.
Forward outlook
- Local home prices are declining (-3.0%/yr); year-one equity from $729 of loan paydown is wiped out by about $3k of value loss. Plan a longer hold.
- Chatham County population projected at +33% by 2050 — long-run rental-demand tailwind backs the buy-and-hold thesis.
- At projected returns (-3.0% appreciation + 0.0% rent growth), your $30k cash investment doubles in ~7 years — after that, you're playing with house money.
Negotiation context
- It's been on market 21 days — a 2% lower offer ($104k) is reasonable based on typical stale-listing flexibility.
- 2 sale attempts since 2y ago; this cycle's ask is 201% above the opening price — seller raised mid-cycle; expect resistance to lowballs.
Risks & watch-outs
- Watch-outs: property tax is 3.0% of price; flood insurance adds $427/mo.
- Climate carrying-cost: in FEMA flood zone AE (mandatory federal flood insurance); severe wind risk, 98% chance of damaging wind over 30y; major wildfire risk; extreme-heat days projected 7→19/yr by 2055 (HVAC capex compounding) — expect insurance premiums to compound above CPI over the hold.
Questions for the listing agent
- Property tax is high relative to price — has the assessment been appealed recently, and will the sale trigger a re-assessment?
- What's the actual annual flood-insurance premium (NFIP or private), and is the property in a SFHA with mandatory coverage?
- Is there a deadline driving the sale (1031 exchange, divorce, estate, relocation)? That informs how much negotiation room exists.
- Schools are F-rated, which usually means shorter tenancies and higher turnover. Who's the typical renter profile here, and what's been the actual vacancy rate?
- What's the average days-on-market for RENTAL listings here right now (not sales)? A rising rental-DOM trend means longer vacancies and softer asking-rent achievability than the comps imply.
- What's the recent tenant-quality profile in this submarket — average credit score on applications, eviction rate, late-payment / NSF rate, and stable-employment percentage? A property-management company in the area should have these aggregated.
- How much new for-sale + rental construction is in the pipeline within 1–3 miles? Heavy new supply typically softens prices + rents 12–24 months out; constrained supply supports both.
Investment metrics
- 1% rule
- 2.26% ✓
- Cap rate
- 17.96%
- Cash-on-cash
- 41.66%
- DSCR
- 2.85
- GRM
- 3.7
CMA / ARV
No comps found within radius.
Projected returns pro-forma
-3.0% appreciation · 0.0% rent growth · sell at horizon
- IRR
- 12.9%
- Equity multiple
- 1.49×
- Total profit
- $14,403
- Equity at exit
- $15,718
- IRR
- 18.2%
- Equity multiple
- 2.22×
- Total profit
- $36,112
- Equity at exit
- $9,115
Cash invested: $29,518 (down + closing). Projections, not guarantees.
Landlord ↔ Tenant lean methodology
- Overall (STATE)
- 90 Strongly Landlord-Friendly
- State Georgia
- 90 Strongly Landlord-Friendly · R+3
- County
- — inherits STATE
- City
- — inherits STATE
ZIP-level market 31302
- Home prices YoY
- -18.5%
- Rents YoY
- -5.5%
- Active inventory
- 262
- Price-to-rent
- 3.7×
Monthly cashflow live
- Estimated rent
- $2,387 high interval (Pro) →
- Mortgage (P&I)
- −$553
- Tax from tax record
- −$264 /mo · $3,168/yr
- Insurance
- −$44
- Flood insurance flood zone
- −$427 /mo · $5,118/yr
- HOA
- −$0
- Vacancy / Maint / Mgmt
- −$501
- Net cashflow
- $598
Break-even live
Sensitivity live
| Price | -10% $658 | -5% $628 | +0% $598 | +5% $568 | +10% $539 |
|---|---|---|---|---|---|
| Rent | -10% $410 | -5% $504 | +0% $598 | +5% $692 | +10% $787 |
| Rate | -1.0pp $651 | -0.5pp $625 | base $598 | +0.5pp $571 | +1.0pp $543 |
UW: 25.0% down · 7.5% · 30yr · 1.5% tax · 5.0% vac · 8.0% maint · 8.0% mgmt
Financing live
Cash to close
- Down payment
- $26,355
- Closing costs
- $3,163
- Reserves months
- —
- Total cash needed
- —
Loan-product check · same deal, 3 products live
Conventional
25% down · 7.5% · 30yr
- Down + closing
- —
- Monthly P&I
- —
- Monthly cashflow
- —
- DSCR
- —
- Eligible?
- —
Personal DTI + credit; lowest rate.
DSCR
20% down · 8.5% · 30yr
- Down + closing
- —
- Monthly P&I
- —
- Monthly cashflow
- —
- DSCR
- —
- Eligible?
- —
No personal income docs; deal must DSCR.
Hard money
10% down · 12.0% · 12mo
- Down + closing
- —
- Monthly P&I
- —
- Monthly cashflow
- —
- DSCR
- —
- Eligible?
- —
Short-term bridge; refi at stabilization.
Rent comps 17 comps
| Address | Beds | Baths | Sqft | Rent | $/sqft | DOM | Units | Dist |
|---|---|---|---|---|---|---|---|---|
| 248 Justify Ave Savannah, GA | 4.0 | 2.5 | 2005 | $2,295 | $1.14 | 44d | 1 | 0.64mi |
| 231 Justify Ave Savannah, GA | 4.0 | 2.5 | 2005 | $2,295 | $1.14 | 44d | 1 | 0.64mi |
| 244 Justify Ave Savannah, GA | 4.0 | 2.5 | 2005 | $2,295 | $1.14 | 44d | 1 | 0.65mi |
| 227 Justify Ave Savannah, GA | 4.0 | 2.5 | 2005 | $2,295 | $1.14 | 44d | 1 | 0.66mi |
| 238 Justify Ave Savannah, GA | 4.0 | 2.5 | 2005 | $2,295 | $1.14 | 44d | 1 | 0.67mi |
| 232 Justify Ave Savannah, GA | 4.0 | 2.5 | 2005 | $2,295 | $1.14 | 44d | 1 | 0.69mi |
| 209 Justify Ave Savannah, GA | 4.0 | 2.5 | 2005 | $2,295 | $1.14 | 44d | 1 | 0.69mi |
| 200 Justify Ave Savannah, GA | 4.0 | 2.5 | 2005 | $2,295 | $1.14 | 44d | 1 | 0.70mi |
| 228 Justify Ave Savannah, GA | 4.0 | 2.5 | 2005 | $2,295 | $1.14 | 44d | 1 | 0.71mi |
| 206 Justify Ave Savannah, GA | 4.0 | 2.5 | 2005 | $2,295 | $1.14 | 44d | 1 | 0.71mi |
| 404 Turpentine Trl Bloomingdale, GA | 4.0 | 2.0 | 1775 | $2,350 | $1.32 | 14d | 1 | 0.72mi |
| 212 Justify Ave Savannah, GA | 4.0 | 2.5 | 2005 | $2,295 | $1.14 | 44d | 1 | 0.73mi |
| 214 Justify Ave Savannah, GA | 4.0 | 2.5 | 2005 | $2,295 | $1.14 | 44d | 1 | 0.73mi |
| 218 Justify Ave Savannah, GA | 4.0 | 2.5 | 2005 | $2,295 | $1.14 | 44d | 1 | 0.74mi |
| 214 Coneflower Rd Bloomingdale, GA | 3.0 | 2.5 | 1418 | $2,300 | $1.62 | 44d | 1 | 1.18mi |
| 154 Guana Ln Bloomingdale, GA | 4.0 | 3.5 | 1920 | $2,700 | $1.41 | 44d | 1 | 1.31mi |
| 455 Coconut Dr Bloomingdale, GA | 4.0 | 2.5 | 2174 | $2,350 | $1.08 | 44d | 1 | 1.35mi |
Listing history 10 events
-
2026-02-10status Under Contract
-
2026-02-09price $105,420
-
2026-02-04soldstatus $174,200
-
2026-01-19$35,000 New
-
2024-06-12soldstatus $190,000
-
2024-06-11soldstatus $190,000 326-char remark
Show marketing remark (326 chars)
Come see this 4 Bedroom, 2 bathroom home located on . 65 acre homesite. Features include an additional space off the master bedroom could be used as an office or a nursery, a large screened entry porch, a detached 2-car garage, fenced yard and a large deck for entertaining! Sold As???????????????????????????????????????? is.
-
2024-03-25$180,000 326-char remark
Show marketing remark (326 chars)
Come see this 4 Bedroom, 2 bathroom home located on . 65 acre homesite. Features include an additional space off the master bedroom could be used as an office or a nursery, a large screened entry porch, a detached 2-car garage, fenced yard and a large deck for entertaining! Sold As???????????????????????????????????????? is.
-
2004-07-01soldstatus $86,000
-
2003-04-14soldstatus $83,000
-
2002-09-17soldstatus $25,000
ⓘ Source: listings_history table (triggers on properties + properties_extension) + one-shot
backfill from property_details.listing_events for pre-trigger history.
Tax reassessment forecast GA · Resets to sale price
- Current annual tax
- $3,168 · $264/mo
- Projected year-2 tax
- $3,168 · $264/mo
- Expected delta
- $0/yr ($0/mo · 0.0%)
ⓘ Screening estimate from a state-policy table — verify with the county assessor before closing.
Climate risk First Street
- Flood 1/10 Low FEMA zone AE · 0% chance over 30 yrs
- Wildfire 6/10 Major
- Heat 9/10 Extreme 7 d/yr ≥108°F today · 19 d/yr by 30 yrs out
- Wind 8/10 Severe 98% chance of damaging wind over 30 yrs
- Air quality 2/10 Low 1 unhealthy d/yr today · 2 by 30 yrs out
Nearby sold comps map
Loading sold comps map…
Walkable amenities ~0.75 mi
Loading nearby amenities…
Taxation est. · year 1
- Rental income
- $28,641
- − Mortgage interest
- −$5,905
- − Property taxes
- −$3,168
- − Insurance
- −$5,646
- − Repairs & maintenance
- −$2,291
- − Management
- −$2,291
- − Depreciation
- −$3,067
- Taxable income
- $6,273
- Est. tax owed @ 24.0%
- −$1,505
- After-tax cash flow
- $5,673/yr
For passive investors: Depreciation is non-cash, so a rental often shows a tax loss while cash-flowing — sheltering income. Rental losses are passive: they offset passive income freely, and up to $25,000/yr can offset ordinary (W-2) income if you actively participate and your MAGI is under $100k (phasing out to $0 by $150k); unused losses carry forward. On sale, claimed depreciation is recaptured at up to 25%, and gains may owe capital-gains tax (a 1031 exchange can defer both). Figures are a year-1 estimate at your 24.0% rate — not tax advice; consult a CPA.
Schools (NCES district)
- District
- Savannah-Chatham County
- NCES district ID
- 1301020
- Math proficiency
- 20% ▼ -11.00%
- Reading proficiency
- 26% ▼ -5.00%
- Median HH income
- $47,443
- Composite
- 20.14/100
- National rank
- #8639
- State rank
- #134 of 174 in GA
Livability — Savannah
- Score
- 86/100
- State rank
- #1
- US rank
- #397
Category grades
Schools grade is shown separately in the Schools card above.
Census & demographics
- County
- Effingham County · 68,439 people
- City population
- 216,564
- Metro
- Savannah, GA
- Population (ZIP)
- 8,899
- Household income
- $68,998
- Rent vs Own
- Severe rent burden
- 188.0
Population outlook (Chatham County) Hauer SSP2
- Today (2025)
- 332,584 people
- By 2030
- 355,508 · +6.9%
- By 2040
- 400,030 · +20.3%
- By 2050
- 443,019 · +33.2%
- By 2075
- 534,579 · +60.7%
- By 2100
- 583,863 · +75.6%
Race, ethnicity, and origin ACS 2023
- Neighborhood character
- Predominantly White (79%)
- Race & ethnicity
- White 79% Black 8% Two or more races 8% Hispanic / Latino 6%
- Hispanic origin (detail)
- Mexican 1%
- Common ancestry
- Serbian 2% Lithuanian 2% Italian 2%
- Foreign-born
- 3% · Canada, Dominican Republic
- Languages at home
- 96% English-only · Spanish 2% German/W. Germanic 1% Other Indo-European 1%
Political lean MEDSL · Chatham
- 2024 margin
- D (+18.0) · D 58.6% · R 40.6%
- 2008→2024 swing
- +3.6pp toward D · 2008: 14.4pp · 2024: 18.0pp
- All cycles
- 2024: D+18.0 2020: D+18.8 2016: D+14.5 2012: D+12.0 2008: D+14.4
Not yet ingested
- Civics
- —
Market trends
- HPI YoY
- ▼ -66.89%
- Current HPI
- 293.9427
- Rent YoY
- ▼ -5.51%
- Metro
- Savannah, GA
- State GDP YoY
- ▲ 2.66%
- F500 in state
- 28
Industry mix (Fortune 500 HQ in GA)
| Industry | F500 HQs | Revenue |
|---|---|---|
| Paper / Packaging | 2 | $29B |
|
||
| Retail | 1 | $160B |
|
||
| Transportation / Logistics | 1 | $91B |
|
||
| Airlines | 1 | $62B |
|
||
| Consumer Goods | 1 | $47B |
|
||
| Utilities | 1 | $25B |
|
||
Price history
+321.7% since first listed10 events — show timeline
- 2026-02-10 Pending — GAMLS
- 2026-02-09 Price Changed $105,420 GAMLS
- 2026-02-04 Sold (Public Records) $174,200 Public Records
- 2026-01-19 Listed $35,000 GAMLS
- 2024-06-12 Sold (Public Records) $190,000 Public Records
- 2024-06-11 Sold (MLS) $190,000 Hive MLS
- 2024-03-25 Listed $180,000 Hive MLS
- 2004-07-01 Sold (Public Records) $86,000 Public Records
- 2003-04-14 Sold (Public Records) $83,000 Public Records
- 2002-09-17 Sold (Public Records) $25,000 Public Records
Property tax history
+13.6%/yrLatest (2025): $3,168 · +166.2% YoY. Source: county tax records.
Cash-flow waterfall
monthlySold comps — $/sqft
last 12 mo · ≤1 miLoading sold comps…