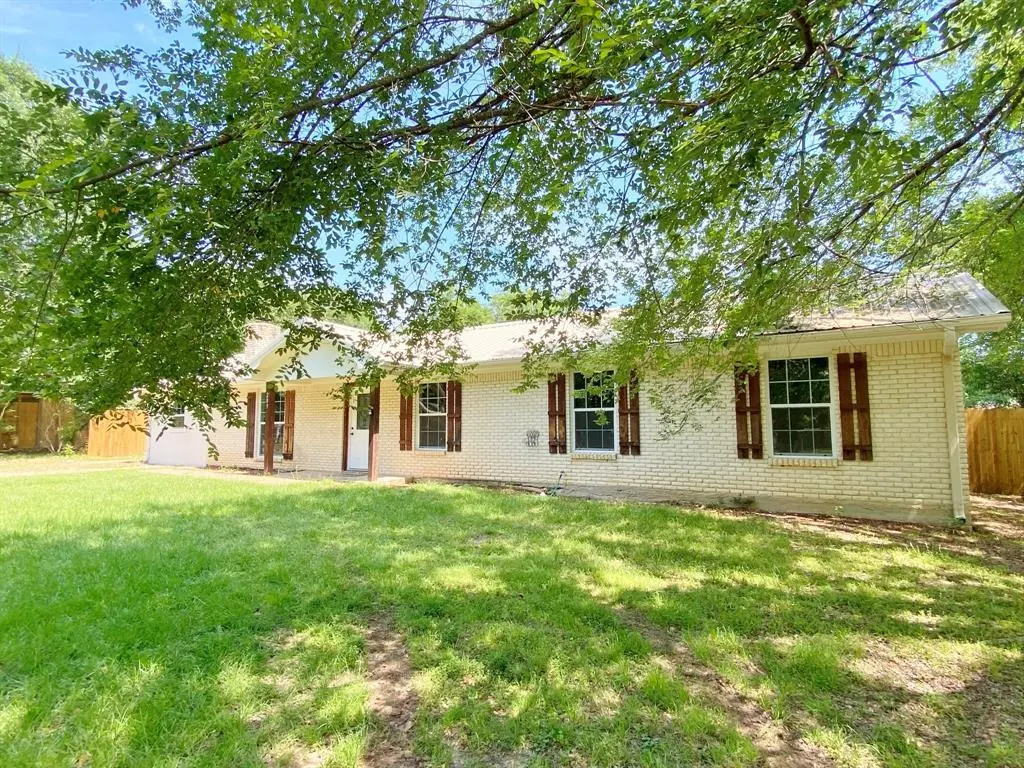
209 Lajodepa St · Grand Saline, TX
Flood risk 1/10 · Minimal
- FEMA flood zone
- X (unshaded)
- Chance of flooding over 30 yrs
- 0.0%
- Est. flood insurance / yr
- $507 – $1,088
Fire risk 4/10 · Minor
- Est. fire insurance / yr
- $1,222 – $2,270
Heat risk 7/10 · Major
- Hot days now (above 110°F)
- 7 days/yr
- Hot days in 30 yrs
- 25 days/yr
Wind risk 6/10 · Moderate
- Chance of severe wind over 30 yrs
- 27.0%
Air-quality risk 2/10 · Minimal
- Unhealthy air days now
- 1 days/yr
- Unhealthy air days in 30 yrs
- 1 days/yr
Risk factors via First Street. Map © Google.
Why this score? — see what drove the D grade
The composite is a weighted blend of 9 inputs, each scored 0–100. Each bar is that input's sub-score; the figure is the points it added to the 100-point composite (weight × sub-score).
- Cash flow +10.8/30.0
- ARV discount +7.7/15.0
- Appreciation +6.3/10.0
- Condition / age +4.0/5.0
- 1% rule +3.2/10.0
- Livability +3.2/5.0
- DSCR +3.1/10.0
- Schools +3.0/10.0
- Rent growth +2.5/5.0
$175,000
🖨 Deal sheet (PDF) 📄 Offer letter ✓ Due diligence
Listing remarks MLS
family friendly 3 bedroom 2 bath brick home located on a nice quiet street. Features include a metal roof, central heat and air, galley style kitchen, large living area with brick wood burning fireplace, carport and HUGE backyard complete with wood privacy fence. Plenty of room for the kids and pets to play and run! Perfect starter home. HOME HAS A LIFETIME FULLY TRANSFERABLE WARRANTY FOR THE FOUNDATION. SALE EXCLUDES REFRIGERATOR.
Key facts
- Durable metal roof
- Fresh paint
- Flexible bonus room
Tags
Property features AI
Finance
- Other: Listing broker: Buchanan Realty; Listing agent: Brad Buchanan
- Financial info: Treat as clear loan type; No second mortgage
- HOA & community: No homeowners association
Exterior
- Parking: Concrete parking area
- Utilities: Electricity connected; Not in a municipal utility district
- Home design: Single-family residence; One story; Residential property
- Construction: Brick construction; Metal roof; Slab foundation; Built in 1973 (preowned)
- Exterior features: Lot under half an acre (approximately 0.32 acre); Subdivision: Richland Heights
Interior
- Kitchen: Dishwasher; Electric range
- Bedrooms: 3 bedrooms (primary bedroom on main level)
- Bathrooms: 2 full bathrooms
- Heating & cooling: Central heating; Central air conditioning; Ceiling fans
- Interior features: Built-in features; Two living areas; One dining area; Room count of 3; Fireplace (wood burning) in living room
Neighborhood map
What this means for you Summary
Snapshot
- This is a 3-bed/2.0-bath single-family listed at $175k. Condition is rated good.
Deal economics
- At list price, monthly cash flow is $-80 ($-957/yr) — negative.
- To cash-flow at today's rent, offer at most $163k (6.6% below list).
- To meet the 1% rule (rent ≥ 1% of price), the offer needs to be $143k (18.3% below list).
- Recommended offer: $143k (18.3% below list) — sets the bar for 1% rule.
- Cap rate 5.7% vs local median 3.0% in Grand Saline — top-decile yield for the area; either an underpriced asset or a hidden risk that comps aren't pricing in. Stress-test before assuming the spread holds.
Location & tenants
- Location reads 64/100 on livability (#800 in TX) — a middle-class / working-renter tenant base. Strengths: cost of living A+, housing A+, health & safety A; Watch: amenities F, commute F, employment F.
- Grand Saline ISD (town): math 38% / reading 33% proficiency, ranked #520 of 826 in TX (top 63%) — families likely to look elsewhere, expect single-tenant / working-renter base with shorter leases.
- Zoned schools: Grand Saline El (308 students, 68% FRL); Grand Saline Middle (math 37% / reading 32%, grade F, #858 of 1,662 statewide, top 54%, 273 students, 59% FRL); Grand Saline H S (math 37% / reading 37%, grade F, #897 of 1,632 statewide, top 57%, 341 students, 51% FRL).
- Market conditions: 147 active listings in the ZIP; 4 comparable units currently listed for rent nearby; rentals lingering (median 46d on market — plan ~5-8 weeks vacancy on turnover, expect pricing pressure); 50% of comp listings sitting > 30 days — soft ceiling on asking rent; 54 units permitted in Van Zandt County in 2024 (0 in 5+ unit buildings).
Forward outlook
- In year one you build about $6k of equity ($1k loan paydown + $5k appreciation (2.7% local appreciation)).
- Van Zandt County population projected at +4% by 2050 — modest demand growth; plan on rents tracking national, not racing it.
- At projected returns (2.7% appreciation + 3.0% rent growth), your $49k cash investment doubles in ~8 years — after that, you're playing with house money.
- By year 6, paydown + projected appreciation supports a ~$31k cash-out refi (75% LTV) — recoverable capital for the next deal without selling this one.
Negotiation context
- It's been on market 29 days — a 2% lower offer ($172k) is reasonable based on typical stale-listing flexibility.
- 3 sale attempts since 11y ago with the ask held roughly flat each time — persistent listings suggest the price (not the market) is what's stuck; bring a comps-based counter.
Risks & watch-outs
- Climate carrying-cost: major wind risk, 27% chance of damaging wind over 30y; extreme-heat days projected 7→25/yr by 2055 (HVAC capex compounding) — expect insurance premiums to compound above CPI over the hold.
Questions for the listing agent
- What do current leases actually rent for vs. the listed asking? Can we see a recent rent roll and the last 12 months of T-12 income?
- Built in 1973 — when were the roof, HVAC, electrical panel, plumbing, and water heater last replaced?
- Is there a deadline driving the sale (1031 exchange, divorce, estate, relocation)? That informs how much negotiation room exists.
- Schools are D-rated, which usually means shorter tenancies and higher turnover. Who's the typical renter profile here, and what's been the actual vacancy rate?
- The area grade is low — what's the realistic commute time and amenity access for the typical tenant pool here? Any planned neighborhood developments (good or bad) we should know about?
- What's the average days-on-market for RENTAL listings here right now (not sales)? A rising rental-DOM trend means longer vacancies and softer asking-rent achievability than the comps imply.
- What's the recent tenant-quality profile in this submarket — average credit score on applications, eviction rate, late-payment / NSF rate, and stable-employment percentage? A property-management company in the area should have these aggregated.
- How much new for-sale + rental construction is in the pipeline within 1–3 miles? Heavy new supply typically softens prices + rents 12–24 months out; constrained supply supports both.
Investment metrics
- 1% rule
- 0.82% ✗
- Cap rate
- 5.75%
- Cash-on-cash
- -1.95%
- DSCR
- 0.91
- GRM
- 10.2
CMA / ARV
- ARV (on-the-fly)
- $175,938
- Comps found
- 9
Show comp detail 9 sales within ~0.75 mi
| Address | Dist | Beds/Ba | Sqft | Sold | Price | $/sf | Match |
|---|---|---|---|---|---|---|---|
| 215 N Oaks Dr | 0.06mi | 3/2.0 | 1,269 (+2%) | 1mo | $168,000 | $132 | 92 |
| 1209 Lakeside Dr | 0.19mi | 3/2.0 | 1,269 (+2%) | 2mo | $199,900 | $158 | 85 |
| 208 De Gail St | 0.04mi | 3/2.0 | 1,330 (+7%) | 11mo | $199,000 | $150 | 77 |
| 119 E High St | 0.46mi | 2/1.0 (-1) | 1,189 (-4%) | 13mo | $199,999 | $168 | 52 |
| 523 Clearwater Rd | 0.53mi | 3/2.0 | 1,392 (+12%) | 4mo | $169,900 | $122 | 51 |
| 1273 Vz County Road 1803 | 0.49mi | 3/1.0 | 1,125 (-9%) | 14mo | $159,900 | $142 | 47 |
| 800 N Main St | 0.49mi | 2/2.0 (-1) | 1,328 (+7%) | 17mo | $169,000 | $127 | 46 |
| 219 E Jordan St | 0.53mi | 3/1.0 | 1,418 (+14%) | 2mo | $59,900 | $42 | 45 |
| 409 N Spring St | 0.72mi | 3/1.0 | 1,100 (-11%) | 12mo | $165,000 | $150 | 33 |
Match score weights: distance 35% · size 25% · config 20% · recency 20%. Top-matched comps best support the ARV.
Projected returns pro-forma
2.69% appreciation · 3.0% rent growth · sell at horizon
- IRR
- 4.8%
- Equity multiple
- 1.27×
- Total profit
- $13,186
- Equity at exit
- $75,668
- IRR
- 8.0%
- Equity multiple
- 2.18×
- Total profit
- $57,688
- Equity at exit
- $114,317
Cash invested: $49,000 (down + closing). Projections, not guarantees.
Landlord ↔ Tenant lean methodology
- Overall (STATE)
- 87 Strongly Landlord-Friendly
- State Texas
- 87 Strongly Landlord-Friendly · R+5
- County
- — inherits STATE
- City
- — inherits STATE
ZIP-level market 75140
- Home prices YoY
- 1.3%
- Active inventory
- 147
- Price-to-rent
- 10.2×
Monthly cashflow live
- Estimated rent
- $1,430 medium interval (Pro) →
- Mortgage (P&I)
- −$918
- Tax est. 1.5%
- −$219 /mo · $2,625/yr
- Insurance
- −$73
- HOA
- −$0
- Lot rent
- −$0
- Vacancy / Maint / Mgmt
- −$300
- Net cashflow
- $-80
Break-even live
Sensitivity live
| Price | -10% $41 | -5% $-19 | +0% $-80 | +5% $-140 | +10% $-201 |
|---|---|---|---|---|---|
| Rent | -10% $-193 | -5% $-136 | +0% $-80 | +5% $-23 | +10% $33 |
| Rate | -1.0pp $8 | -0.5pp $-35 | base $-80 | +0.5pp $-125 | +1.0pp $-171 |
UW: 25.0% down · 7.5% · 30yr · 1.5% tax · 5.0% vac · 8.0% maint · 8.0% mgmt
Financing live
Cash to close
- Down payment
- $43,750
- Closing costs
- $5,250
- Reserves months
- —
- Total cash needed
- —
Loan-product check · same deal, 3 products live
Conventional
25% down · 7.5% · 30yr
- Down + closing
- —
- Monthly P&I
- —
- Monthly cashflow
- —
- DSCR
- —
- Eligible?
- —
Personal DTI + credit; lowest rate.
DSCR
20% down · 8.5% · 30yr
- Down + closing
- —
- Monthly P&I
- —
- Monthly cashflow
- —
- DSCR
- —
- Eligible?
- —
No personal income docs; deal must DSCR.
Hard money
10% down · 12.0% · 12mo
- Down + closing
- —
- Monthly P&I
- —
- Monthly cashflow
- —
- DSCR
- —
- Eligible?
- —
Short-term bridge; refi at stabilization.
Rent comps 4 comps
| Address | Beds | Baths | Sqft | Rent | $/sqft | DOM | Units | Dist |
|---|---|---|---|---|---|---|---|---|
| 543 Bradburn Rd Unit 101 Grand Saline, TX | 2.0 | 1.0 | 1169 | $1,500 | $1.28 | 16d | 1 | 0.47mi |
| 1024 N Spring St Grand Saline, TX | 3.0 | 2.0 | 1453 | $1,500 | $1.03 | 46d | 1 | 0.50mi |
| 605 W Hill St Grand Saline, TX | 3.0 | 1.5 | 1032 | $1,275 | $1.24 | 16d | 1 | 1.02mi |
| 1260 Vz County Road 1810 Unit 1810 Grand Saline, TX | 2.0 | 1.0 | 864 | $1,195 | $1.38 | 46d | 1 | 1.21mi |
Listing history 15 events
-
2026-06-17status $175,000 Pending 29 DOM
-
2026-06-16days on market $175,000 Active Option Contract 29 DOM
-
2026-06-15days on market $175,000 Active Option Contract 28 DOM
-
2026-06-13days on market $175,000 Active Option Contract 26 DOM
-
2026-06-12statusdays on market $175,000 Active Option Contract 25 DOM
-
2026-06-09days on market $175,000 Active 22 DOM
-
2026-06-08days on market $175,000 Active 21 DOM
-
2026-06-08days on market $175,000 Active 20 DOM
-
2026-06-07days on market $175,000 Active 19 DOM
-
2026-06-03days on market $175,000 Active 16 DOM
-
2026-06-02days on market $175,000 Active 15 DOM
-
2026-06-01days on market $175,000 Active 14 DOM
-
2026-05-31days on market $175,000 Active 13 DOM
-
2026-05-31status $175,000 Active 12 DOM
-
2026-05-16$175,000 Active
ⓘ Source: listings_history table (triggers on properties + properties_extension) + one-shot
backfill from property_details.listing_events for pre-trigger history.
Climate risk First Street
- Flood 1/10 Low FEMA zone X (unshaded) · 0% chance over 30 yrs
- Wildfire 4/10 Moderate
- Heat 7/10 Severe 7 d/yr ≥110°F today · 25 d/yr by 30 yrs out
- Wind 6/10 Major 27% chance of damaging wind over 30 yrs
- Air quality 2/10 Low 1 unhealthy d/yr today · 1 by 30 yrs out
Nearby sold comps map
Loading sold comps map…
Walkable amenities ~0.75 mi
Loading nearby amenities…
Taxation est. · year 1
- Rental income
- $17,159
- − Mortgage interest
- −$9,803
- − Property taxes
- −$2,625
- − Insurance
- −$875
- − Repairs & maintenance
- −$1,373
- − Management
- −$1,373
- − Depreciation
- −$5,091
- Taxable loss
- −$3,980
- Est. tax savings @ 24.0%
- +$955
- After-tax cash flow
- $-2/yr
For passive investors: Depreciation is non-cash, so a rental often shows a tax loss while cash-flowing — sheltering income. Rental losses are passive: they offset passive income freely, and up to $25,000/yr can offset ordinary (W-2) income if you actively participate and your MAGI is under $100k (phasing out to $0 by $150k); unused losses carry forward. On sale, claimed depreciation is recaptured at up to 25%, and gains may owe capital-gains tax (a 1031 exchange can defer both). Figures are a year-1 estimate at your 24.0% rate — not tax advice; consult a CPA.
Condition & rehab AI · 16 photos
This renovated 3-bedroom, 2-bath home with a spacious backyard and storage shed is in good condition and ready for move-in.
Value-add opportunities
- Both Painting exterior and interior — Enhances curb appeal and interior aesthetics.
- Both Landscaping and yard maintenance — Improves curb appeal and adds value to the property.
Renovation cost estimate screening
Value-add ROI direction
- Both Painting exterior and interior — Enhances curb appeal and interior aesthetics. ↑
- Both Landscaping and yard maintenance — Improves curb appeal and adds value to the property. ↑
ⓘ Cost ranges are severity-bucket heuristics (US national rule-of-thumb). Get contractor quotes + a written scope before underwriting a rehab budget.
Schools (NCES district)
- District
- Grand Saline ISD
- NCES district ID
- 4821450
- Math proficiency
- 38% ▼ -2.00%
- Reading proficiency
- 33% ▼ -7.00%
- Median HH income
- $41,621
- Composite
- 29.99/100
- National rank
- #6365
- State rank
- #520 of 826 in TX
Livability — Grand Saline
- Score
- 64/100
- State rank
- #800
- US rank
- #14580
Category grades
Schools grade is shown separately in the Schools card above.
Census & demographics
- Census place
- Grand Saline, TX
- Population (ZIP)
- 8,596
Population outlook (Van Zandt County) Hauer SSP2
- Today (2025)
- 55,634 people
- By 2030
- 56,479 · +1.5%
- By 2040
- 57,672 · +3.7%
- By 2050
- 57,913 · +4.1%
- By 2075
- 57,544 · +3.4%
- By 2100
- 52,659 · -5.3%
Race, ethnicity, and origin ACS 2023
- Neighborhood character
- Predominantly White (70%)
- Race & ethnicity
- White 70% Hispanic / Latino 28% Two or more races 9%
- Hispanic origin (detail)
- Mexican 27%
- Common ancestry
- Slovak 2% Serbian 1% Italian 1%
- Foreign-born
- 13% · Canada
- Languages at home
- 75% English-only · Spanish 25%
Political lean MEDSL · Van Zandt
- 2024 margin
- Solid R (+74.8) · D 12.3% · R 87.2%
- 2008→2024 swing
- -19.8pp toward R · 2008: -55.1pp · 2024: -74.8pp
- All cycles
- 2024: R+74.8 2020: R+72.1 2016: R+72.1 2012: R+66.6 2008: R+55.1
Not yet ingested
- Civics
- —
Market trends
- HPI YoY
- ▲ 2.69%
- Current HPI
- 215.5979
- Rent YoY
- —
- Metro
- —
- State GDP YoY
- ▲ 3.95%
- F500 in state
- 110
Industry mix (Fortune 500 HQ in TX)
| Industry | F500 HQs | Revenue |
|---|---|---|
| Energy | 16 | $1,198B |
|
||
| Technology | 5 | $198B |
|
||
| Engineering / Construction | 4 | $72B |
|
||
| Energy Services | 3 | $60B |
|
||
| Utilities | 3 | $41B |
|
||
| Healthcare | 2 | $330B |
|
||
Price history
+151.8% since first listed7 events — show timeline
- 2026-06-16 Pending — NTREIS
- 2026-06-10 Contingent — NTREIS
- 2026-05-30 Relisted — NTREIS
- 2026-05-26 Contingent — NTREIS
- 2026-05-16 Listed $175,000 NTREIS
- 2015-03-31 Sold (MLS) — GTAR
- 2015-01-09 Listed $69,500 GTAR
Cash-flow waterfall
monthlySold comps — $/sqft
last 12 mo · ≤1 miLoading sold comps…