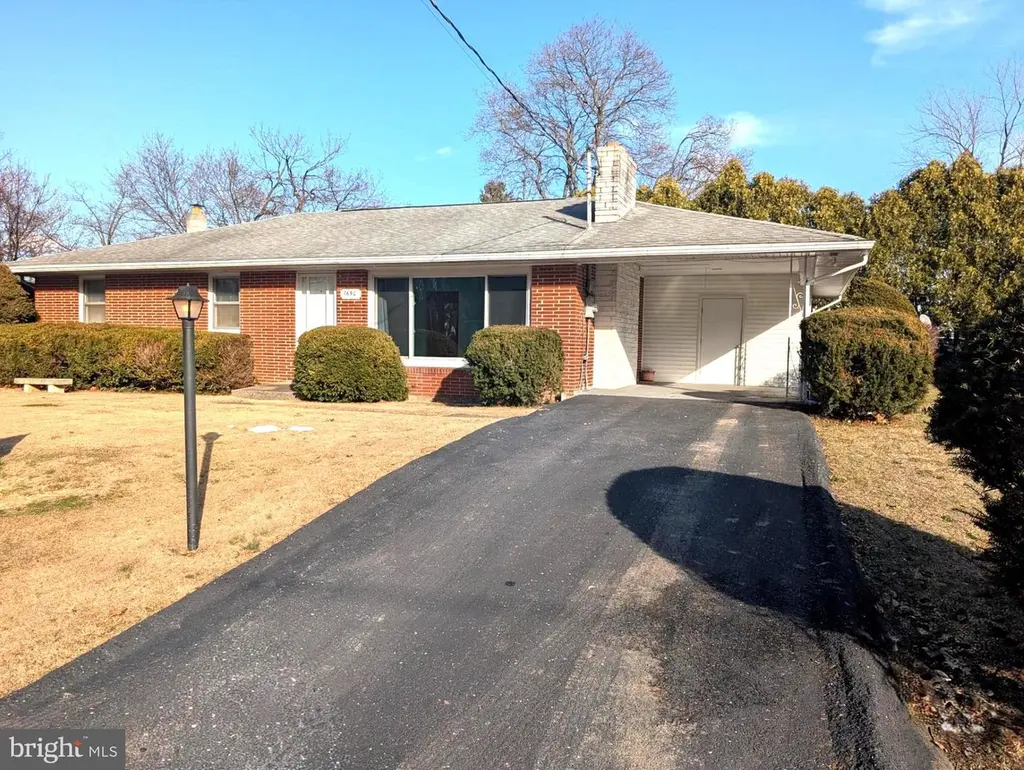
7690 Daniel Dr · West Hanover, PA
Flood risk 1/10 · Minimal
- FEMA flood zone
- X (unshaded)
- Chance of flooding over 30 yrs
- 0.0%
- Est. flood insurance / yr
- $473 – $860
Fire risk 2/10 · Minimal
- Est. fire insurance / yr
- $511 – $949
Heat risk 4/10 · Minor
- Hot days now (above 100°F)
- 7 days/yr
- Hot days in 30 yrs
- 14 days/yr
Wind risk 3/10 · Minor
- Chance of severe wind over 30 yrs
- 7.0%
Air-quality risk 3/10 · Minor
- Unhealthy air days now
- 3 days/yr
- Unhealthy air days in 30 yrs
- 4 days/yr
Risk factors via First Street. Map © Google.
Why this score? — see what drove the D grade
The composite is a weighted blend of 9 inputs, each scored 0–100. Each bar is that input's sub-score; the figure is the points it added to the 100-point composite (weight × sub-score).
- ARV discount +12.4/15.0
- Cash flow +11.8/30.0
- Schools +3.6/10.0
- DSCR +3.5/10.0
- 1% rule +3.1/10.0
- Rent growth +2.9/5.0
- Livability +2.5/5.0
- Condition / age +2.5/5.0
- Appreciation +0.0/10.0
$255,000
🖨 Deal sheet (PDF) 📄 Offer letter ✓ Due diligence
Listing remarks
Welcome home to this well-maintained brick ranch situated on a spacious corner lot! This charming home offers comfortable one-level living with timeless appeal. Step inside to find a bright and inviting front living room featuring a stone wood stove, ceiling fan, large windows and cozy carpeting. The adjoining eat-in kitchen offers ample functionality with a pantry, built-in wall cabinetry, and a sunny breakfast area perfect for everyday dining. Down the hall, you'll find three bedrooms, including a spacious primary suite complete with built-in wall shelving, carpeting, and a private attached half bath. An additional full bathroom serves the remaining bedrooms. Main-level laundry adds conve
Key facts
- Pantry
- Stone wood stove
- Spacious corner lot
Tags
Property features AI
Exterior
- Parking: Attached carport (1 space); Asphalt driveway with 2 spaces; Total of 3 garage/parking spaces
- Utilities: Public sewer; Well water; Electric hot water
- Home design: Detached property; Not in a federal flood zone
- Construction: Brick construction; Shingle roof; Permanent concrete perimeter foundation; Full unfinished basement
- Exterior features: Partially fenced rear yard; Shed
Interior
- Kitchen: Built-in microwave; Refrigerator; Electric range/oven; Dishwasher
- Bedrooms: 3 bedrooms on main level
- Flooring: Carpet
- Bathrooms: 1 full bathroom on main level; 1 half bathroom on main level
- Heating & cooling: Forced air heating (oil); Window unit(s) for cooling; Ceiling fan(s) for cooling
- Interior features: Breakfast area; Built-ins; Ceiling fan(s); Combination kitchen/dining; Dining area; Entry-level bedroom; Pantry; Master bath(s); Wood stove; Window treatments
- Laundry & utility: Laundry on main floor; Electric hot water
Neighborhood map
What this means for you Summary
Snapshot
- This is a 3-bed/1.5-bath single-family listed at $255k.
Deal economics
- At list price, monthly cash flow is $-68 ($-820/yr) — negative.
- To cash-flow at today's rent, offer at most $243k (4.7% below list).
- To meet the 1% rule (rent ≥ 1% of price), the offer needs to be $207k (18.8% below list).
- Recommended offer: $207k (18.8% below list) — sets the bar for 1% rule.
Location & tenants
- Location reads: area grade D — affects rentability + tenant quality, not the cash-flow math above.
- Central Dauphin SD (suburban): math 30% / reading 52% proficiency, ranked #305 of 539 in PA (top 57%) — families likely to look elsewhere, expect single-tenant / working-renter base with shorter leases.
- Zoned schools: West Hanover El Sch (math 57% / reading 76%, grade B+, #235 of 1,518 statewide, top 16%, 574 students, 32% FRL); Central Dauphin Ms (math 27% / reading 66%, grade D+, #172 of 512 statewide, top 35%, 848 students, 33% FRL); Central Dauphin Shs (math 71% / reading 24%, grade D, #164 of 437 statewide, top 38%, 1,975 students, 33% FRL) — zoned schools at 33% FRL track the district average.
- Zoned-school proficiency averages 54% at this address vs 41% district-wide (+13 pts) — the actual schools serving this property are materially stronger than the Central Dauphin SD average implies; a family-tenant draw the district grade alone would hide.
- Market conditions: Rents rising (+1.6%/yr); 314 active listings in the ZIP; 7 comparable units currently listed for rent nearby; rentals at typical pace (median 16d on market — plan ~3-4 weeks tenant-placement turnaround); solid renter incomes; 540 units permitted in Dauphin County in 2024 (194 in 5+ unit buildings).
Forward outlook
- Local home prices are declining (-3.0%/yr); year-one equity from $2k of loan paydown is wiped out by about $8k of value loss. Plan a longer hold.
Negotiation context
- It's been on market 16 days — a 2% lower offer ($251k) is reasonable based on typical stale-listing flexibility.
- 4 sale attempts; this cycle's ask has dropped $15k (6%) from the opening price — seller is motivated, your offer sets the floor, not the list.
Questions for the listing agent
- What do current leases actually rent for vs. the listed asking? Can we see a recent rent roll and the last 12 months of T-12 income?
- Built in 1960 — when were the roof, HVAC, electrical panel, plumbing, and water heater last replaced?
- Is there a deadline driving the sale (1031 exchange, divorce, estate, relocation)? That informs how much negotiation room exists.
- The area grade is low — what's the realistic commute time and amenity access for the typical tenant pool here? Any planned neighborhood developments (good or bad) we should know about?
- What's the average days-on-market for RENTAL listings here right now (not sales)? A rising rental-DOM trend means longer vacancies and softer asking-rent achievability than the comps imply.
- What's the recent tenant-quality profile in this submarket — average credit score on applications, eviction rate, late-payment / NSF rate, and stable-employment percentage? A property-management company in the area should have these aggregated.
- How much new for-sale + rental construction is in the pipeline within 1–3 miles? Heavy new supply typically softens prices + rents 12–24 months out; constrained supply supports both.
Investment metrics
- 1% rule
- 0.81% ✗
- Cap rate
- 5.97%
- Cash-on-cash
- -1.15%
- DSCR
- 0.95
- GRM
- 10.3
CMA / ARV
- ARV (median comp)
- $286,415
- List price
- $255,000
- Delta
- 8.23%
- Verdict
- FAIR
- Comps
- 20 within 1.0 mi
Show comp detail 12 sales within ~0.75 mi
| Address | Dist | Beds/Ba | Sqft | Sold | Price | $/sf | Match |
|---|---|---|---|---|---|---|---|
| 7612 Woodside Ave | 0.29mi | 3/2.0 | 1,609 (-3%) | 9mo | $370,000 | $230 | 72 |
| 179 Florence Dr | 0.35mi | 3/1.5 | 1,695 (+2%) | 10mo | $315,000 | $186 | 72 |
| 7609 Woodside Ave | 0.32mi | 3/2.0 | 1,672 (+1%) | 12mo | $308,000 | $184 | 72 |
| 123 Florence Dr | 0.36mi | 4/2.0 (+1) | 1,609 (-3%) | 3mo | $340,000 | $211 | 69 |
| 162 N Fairville Ave | 0.06mi | 3/1.0 | 1,537 (-7%) | 17mo | $242,500 | $158 | 69 |
| 7804 Dewey Dr | 0.55mi | 4/2.0 (+1) | 1,640 (-1%) | 7mo | $284,900 | $174 | 60 |
| 7700 Valleyview Ave | 0.57mi | 3/1.0 | 1,595 (-4%) | 8mo | $280,000 | $176 | 58 |
| 7622 Woodside Ave | 0.29mi | 3/2.0 | 1,536 (-7%) | 22mo | $270,000 | $176 | 54 |
| 7710 Valleyview Ave | 0.59mi | 3/1.0 | 1,800 (+8%) | 5mo | $245,000 | $136 | 52 |
| 227 Myrtle Dr | 0.59mi | 4/1.5 (+1) | 1,640 (-1%) | 20mo | $305,000 | $186 | 49 |
| 7847 Skyline Dr | 0.74mi | 3/1.5 | 1,731 (+4%) | 12mo | $299,900 | $173 | 48 |
| 7832 Dewey Dr | 0.65mi | 3/1.0 | 1,905 (+15%) | 9mo | $292,000 | $153 | 35 |
Match score weights: distance 35% · size 25% · config 20% · recency 20%. Top-matched comps best support the ARV.
Projected returns pro-forma
-3.0% appreciation · 1.64% rent growth · sell at horizon
- IRR
- -19.7%
- Equity multiple
- 0.32×
- Total profit
- $-48,475
- Equity at exit
- $38,021
- IRR
- -15.5%
- Equity multiple
- 0.17×
- Total profit
- $-58,999
- Equity at exit
- $22,048
Cash invested: $71,400 (down + closing). Projections, not guarantees.
Landlord ↔ Tenant lean methodology
- Overall (STATE)
- 62 Landlord-Friendly
- State Pennsylvania
- 62 Landlord-Friendly · EVEN
- County
- — inherits STATE
- City
- — inherits STATE
ZIP-level market 17112
- Rents YoY
- 1.6%
- Active inventory
- 314
- Price-to-rent
- 10.3×
Monthly cashflow live
- Estimated rent
- $2,071 high interval (Pro) →
- Mortgage (P&I)
- −$1,337
- Tax from tax record
- −$261 /mo · $3,132/yr
- Insurance
- −$106
- HOA
- −$0
- Vacancy / Maint / Mgmt
- −$435
- Net cashflow
- $-68
Break-even live
Sensitivity live
| Price | -10% $76 | -5% $4 | +0% $-68 | +5% $-141 | +10% $-213 |
|---|---|---|---|---|---|
| Rent | -10% $-232 | -5% $-150 | +0% $-68 | +5% $13 | +10% $95 |
| Rate | -1.0pp $60 | -0.5pp $-4 | base $-68 | +0.5pp $-134 | +1.0pp $-202 |
UW: 25.0% down · 7.5% · 30yr · 1.5% tax · 5.0% vac · 8.0% maint · 8.0% mgmt
Financing live
Cash to close
- Down payment
- $63,750
- Closing costs
- $7,650
- Reserves months
- —
- Total cash needed
- —
Loan-product check · same deal, 3 products live
Conventional
25% down · 7.5% · 30yr
- Down + closing
- —
- Monthly P&I
- —
- Monthly cashflow
- —
- DSCR
- —
- Eligible?
- —
Personal DTI + credit; lowest rate.
DSCR
20% down · 8.5% · 30yr
- Down + closing
- —
- Monthly P&I
- —
- Monthly cashflow
- —
- DSCR
- —
- Eligible?
- —
No personal income docs; deal must DSCR.
Hard money
10% down · 12.0% · 12mo
- Down + closing
- —
- Monthly P&I
- —
- Monthly cashflow
- —
- DSCR
- —
- Eligible?
- —
Short-term bridge; refi at stabilization.
Rent comps 7 comps
| Address | Beds | Baths | Sqft | Rent | $/sqft | DOM | Units | Dist |
|---|---|---|---|---|---|---|---|---|
| 162 N Fairville Ave Harrisburg, PA | 3.0 | 1.0 | 1537 | $2,000 | $1.30 | 15d | 1 | 0.06mi |
| 7867 Oak Brook Dr Harrisburg, PA | 3.0 | 2.5 | 1730 | $1,990 | $1.15 | 45d | 1 | 0.65mi |
| 7884 Oak Brook Dr Harrisburg, PA | 3.0 | 2.5 | 1955 | $2,275 | $1.16 | 15d | 1 | 0.69mi |
| 7874 Manada Ct Unit 28 West Hanover Township, PA | 3.0 | 3.0 | 1612 | $1,750 | $1.09 | 15d | 1 | 0.69mi |
| 8170 Haley Ct Harrisburg, PA | 3.0 | 2.5 | 1868 | $2,300 | $1.23 | 23d | 1 | 1.17mi |
| 8177 Lenker Dr #2604 West Hanover Township, PA | 3.0 | 2.5 | 1852 | $2,250 | $1.21 | 45d | 1 | 1.20mi |
| 500 Northstar Dr Harrisburg, PA | 2.0 | 2.5 | 1440 | $2,149 | $1.49 | 15d | 1 | 1.28mi |
Listing history 20 events
-
2026-06-21pricedays on market $255,000 Active 16 DOM
-
2026-06-18days on market $270,000 Active 13 DOM
-
2026-06-17days on market $270,000 Active 12 DOM
-
2026-06-16days on market $270,000 Active 11 DOM
-
2026-06-15days on market $270,000 Active 10 DOM
-
2026-06-14days on market $270,000 Active 8 DOM
-
2026-06-13days on market $270,000 Active 7 DOM
-
2026-06-10days on market $270,000 Active 5 DOM
-
2026-06-09days on market $270,000 Active 4 DOM
-
2026-06-08days on market $270,000 Active 3 DOM
-
2026-06-07remarks 699-char remark
-
2026-06-07pricedays on market $270,000 Active 2 DOM
-
2026-05-31days on market $310,000 Active 88 DOM
-
2026-05-31days on market $310,000 Active 87 DOM
-
2026-04-27status Active 767-char remark
-
2026-04-18status Active Under Contract 767-char remark
-
2026-04-17historical 767-char remark
-
2026-04-11price $310,000 767-char remark
-
2026-02-23$339,900 Active 767-char remark
-
2026-02-09historical $339,900 767-char remark
ⓘ Source: listings_history table (triggers on properties + properties_extension) + one-shot
backfill from property_details.listing_events for pre-trigger history.
Tax reassessment forecast PA · Partial reset (capped growth)
- Current annual tax
- $3,132 · $261/mo
- Projected year-2 tax
- $3,580 · $298/mo
- Expected delta
- +$449/yr (+$37/mo · 14.3%)
ⓘ Screening estimate from a state-policy table — verify with the county assessor before closing.
Climate risk First Street
- Flood 1/10 Low FEMA zone X (unshaded) · 0% chance over 30 yrs
- Wildfire 2/10 Low
- Heat 4/10 Moderate 7 d/yr ≥100°F today · 14 d/yr by 30 yrs out
- Wind 3/10 Moderate 7% chance of damaging wind over 30 yrs
- Air quality 3/10 Moderate 3 unhealthy d/yr today · 4 by 30 yrs out
Nearby sold comps map
Loading sold comps map…
Walkable amenities ~0.75 mi
Loading nearby amenities…
Taxation est. · year 1
- Rental income
- $24,852
- − Mortgage interest
- −$14,284
- − Property taxes
- −$3,132
- − Insurance
- −$1,275
- − Repairs & maintenance
- −$1,988
- − Management
- −$1,988
- − Depreciation
- −$7,418
- Taxable loss
- −$5,233
- Est. tax savings @ 24.0%
- +$1,256
- After-tax cash flow
- $436/yr
For passive investors: Depreciation is non-cash, so a rental often shows a tax loss while cash-flowing — sheltering income. Rental losses are passive: they offset passive income freely, and up to $25,000/yr can offset ordinary (W-2) income if you actively participate and your MAGI is under $100k (phasing out to $0 by $150k); unused losses carry forward. On sale, claimed depreciation is recaptured at up to 25%, and gains may owe capital-gains tax (a 1031 exchange can defer both). Figures are a year-1 estimate at your 24.0% rate — not tax advice; consult a CPA.
Schools (NCES district)
- District
- Central Dauphin SD
- NCES district ID
- 4205400
- Math proficiency
- 30% ▼ -12.00%
- Reading proficiency
- 52% ▼ -7.00%
- Median HH income
- $62,792
- Composite
- 36.46/100
- National rank
- #4664
- State rank
- #305 of 539 in PA
Livability — West Hanover
No livability data for this city. (Only ~50 U.S. cities are tracked.)
Census & demographics
- Census place
- Skyline View, PA
- County
- Dauphin County · 247,857 people
- Metro
- Harrisburg-Carlisle, PA
- Population (ZIP)
- 38,502
- Household income
- $103,876
- Rent vs Own
- Severe rent burden
- 412.0
Population outlook (Dauphin County) Hauer SSP2
- Today (2025)
- 281,628 people
- By 2030
- 283,549 · +0.7%
- By 2040
- 285,385 · +1.3%
- By 2050
- 286,188 · +1.6%
- By 2075
- 291,053 · +3.3%
- By 2100
- 282,374 · +0.3%
Race, ethnicity, and origin ACS 2023
- Neighborhood character
- Predominantly White (78%)
- Race & ethnicity
- White 78% Black 8% Asian 7% Hispanic / Latino 4% Two or more races 3%
- Common ancestry
- Romanian 3% Iranian 2% Lithuanian 2%
- Foreign-born
- 9% · India, Canada, China
- Languages at home
- 90% English-only · Other Indo-European 3% Spanish 1% Other Asian/Pacific 1%
Political lean MEDSL · Dauphin
- 2024 margin
- Lean D (+5.9) · D 52.4% · R 46.5% · Other 1.1%
- 2008→2024 swing
- -3.1pp toward R · 2008: 9.1pp · 2024: 5.9pp
- All cycles
- 2024: D+5.9 2020: D+8.5 2016: D+2.8 2012: D+6.0 2008: D+9.1
Not yet ingested
- Civics
- —
Market trends
- HPI YoY
- ▼ -207.10%
- Current HPI
- 244.5366
- Rent YoY
- ▲ 1.64%
- Metro
- Harrisburg-Carlisle, PA
- State GDP YoY
- ▲ 1.68%
- F500 in state
- 34
Industry mix (Fortune 500 HQ in PA)
| Industry | F500 HQs | Revenue |
|---|---|---|
| Healthcare | 2 | $309B |
|
||
| Insurance | 2 | $27B |
|
||
| Telecommunications / Media | 1 | $124B |
|
||
| Industrial Distribution | 1 | $22B |
|
||
| Financial Services | 1 | $20B |
|
||
| Chemicals / Materials | 1 | $18B |
|
||
Price history
-25.0% since first listed9 events — show timeline
- 2026-06-19 Price Changed $255,000 BRIGHT MLS
- 2026-06-05 Listed $270,000 BRIGHT MLS
- 2026-05-31 Listing Removed — BRIGHT MLS
- 2026-04-27 Relisted — BRIGHT MLS
- 2026-04-18 Relisted — BRIGHT MLS
- 2026-04-17 Listing Removed — BRIGHT MLS
- 2026-04-11 Price Changed $310,000 BRIGHT MLS
- 2026-02-23 Listed $339,900 BRIGHT MLS
- 2026-02-09 Coming Soon — BRIGHT MLS
Property tax history
+2.2%/yrLatest (2026): $3,132 · +5.9% YoY. Source: county tax records.
Cash-flow waterfall
monthlySold comps — $/sqft
last 12 mo · ≤1 miLoading sold comps…