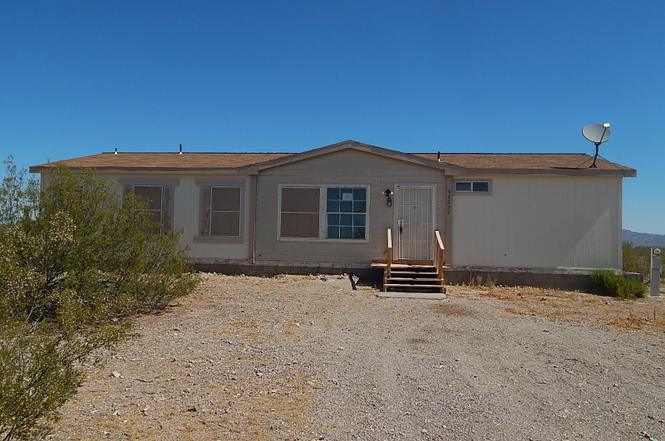
42632 W Colter St · Tonopah, AZ
Flood risk 1/10 · Minimal
- FEMA flood zone
- X (shaded)
- Chance of flooding over 30 yrs
- 0.0%
- Est. flood insurance / yr
- $507 – $1,088
Fire risk 5/10 · Moderate
- Est. fire insurance / yr
- $610 – $1,132
Heat risk 9/10 · Severe
- Hot days now (above 114°F)
- 7 days/yr
- Hot days in 30 yrs
- 17 days/yr
Wind risk 1/10 · Minimal
- Chance of severe wind over 30 yrs
- —
Air-quality risk 1/10 · Minimal
- Unhealthy air days now
- 0 days/yr
- Unhealthy air days in 30 yrs
- 0 days/yr
Risk factors via First Street. Map © Google.
Why this score? — see what drove the B grade
The composite is a weighted blend of 9 inputs, each scored 0–100. Each bar is that input's sub-score; the figure is the points it added to the 100-point composite (weight × sub-score).
- Cash flow +30.0/30.0
- DSCR +10.0/10.0
- Appreciation +10.0/10.0
- 1% rule +7.5/10.0
- ARV discount +7.5/15.0
- Rent growth +2.5/5.0
- Condition / age +2.5/5.0
- Schools +2.4/10.0
- Livability +2.0/5.0
$153,000
🖨 Deal sheet 📄 Offer letter ✓ Due diligence
Listing remarks MLS
Great modular home built with gorgeous 360 degree mountain views of Belmont, Saddle, Big Horn & White Tank Mountains! 2.5 acres of stunning land with plenty of room for all your toys and horses! Large open living/dining room with a recently updated kitchen featuring white cabinets, newer counters and plenty of cabinet & counter space. Newer interior neutral paint and carpet! Large master suite with spacious master bath with separate tub & shower and dual sink vanity. Large laundry room with additional storage! Move-in ready! Fenced in backyard with garden beds set up and ready for you. So much potential to customize this land to make your own! Fantastic private location while still being close enough to Phoenix.
Key facts
- 2.5 acre lot
- Built 2005
- Listed 16 days
Property features AI
Finance
- Other: Lot size recorded from assessor; Lot size value available (assessor)
- HOA & community: No association fees
Exterior
- Utilities: Private well for water; Septic tank sewer
- Home design: Manufactured/Mobile home; Fee simple ownership
- Construction: Wood frame construction; Painted exterior; Composition roof
- Exterior features: Dirt front yard; Dirt back yard; Horses allowed on the property
Interior
- Bedrooms: Up to 4 possible bedrooms
- Flooring: Other flooring
- Bathrooms: 2 full bathrooms
- Heating & cooling: Electric heating; Has cooling (type listed as Other)
- Interior features: Full bathroom in the master bedroom
- Laundry & utility: No laundry hookups inside (none specified)
Neighborhood map
What this means for you Summary
Snapshot
- This is a 4-bed/2.0-bath manufactured listed at $153k.
Deal economics
- At list price, monthly cash flow is $613 ($7k/yr) — positive.
- The deal already cash-flows at list — no discount required.
- Meets the 1% rule at list price ($2k rent vs $153k).
- Recommended offer: $151k (1.5% below list) — sets the bar for market timing.
- Cap rate 11.1% vs local median 3.4% in Tonopah — top-decile yield for the area; either an underpriced asset or a hidden risk that comps aren't pricing in. Stress-test before assuming the spread holds.
Location & tenants
- Location reads 40/100 on livability (#400 in AZ) — a working-class tenant base; expect higher turnover. Strengths: cost of living A+, crime A; Watch: amenities F, commute F, employment F.
- Saddle Mountain Unified School District (4254) (rural): math 26% / reading 27% proficiency, ranked #117 of 249 in AZ (top 47%) — low school quality limits family demand, transient renter base, plan for 1-2y turnover.
- Zoned schools: Tonopah Valley High School (math 27% / reading 32%, grade F, #120 of 381 statewide, top 34%, 865 students, 52% FRL) — zoned schools at 52% FRL track the district average.
- Market conditions: 785 active listings in the ZIP; 36,011 units permitted in Maricopa County in 2024 (12,801 in 5+ unit buildings).
Forward outlook
- In year one you build about $16k of equity ($1k loan paydown + $15k appreciation (10.0% local appreciation)).
- Maricopa County population projected at +38% by 2050 — long-run rental-demand tailwind backs the buy-and-hold thesis.
- At projected returns (10.0% appreciation + 3.0% rent growth), your $43k cash investment doubles in ~2 years — after that, you're playing with house money.
- By year 3, paydown + projected appreciation supports a ~$41k cash-out refi (75% LTV) — recoverable capital for the next deal without selling this one.
Negotiation context
- It's been on market 17 days — a 2% lower offer ($151k) is reasonable based on typical stale-listing flexibility.
- 9 sale attempts since 14y ago; this cycle's ask is 9% above the opening price — seller raised mid-cycle; expect resistance to lowballs.
Risks & watch-outs
- Climate carrying-cost: moderate wildfire risk; extreme-heat days projected 7→17/yr by 2055 (HVAC capex compounding) — expect insurance premiums to compound above CPI over the hold.
Questions for the listing agent
- Is there a deadline driving the sale (1031 exchange, divorce, estate, relocation)? That informs how much negotiation room exists.
- Schools are F-rated, which usually means shorter tenancies and higher turnover. Who's the typical renter profile here, and what's been the actual vacancy rate?
- What's the average days-on-market for RENTAL listings here right now (not sales)? A rising rental-DOM trend means longer vacancies and softer asking-rent achievability than the comps imply.
- What's the recent tenant-quality profile in this submarket — average credit score on applications, eviction rate, late-payment / NSF rate, and stable-employment percentage? A property-management company in the area should have these aggregated.
- How much new for-sale + rental construction is in the pipeline within 1–3 miles? Heavy new supply typically softens prices + rents 12–24 months out; constrained supply supports both.
Investment metrics
- 1% rule
- 1.25% ✓
- Cap rate
- 11.10%
- Cash-on-cash
- 17.18%
- DSCR
- 1.76
- GRM
- 6.7
CMA / ARV
No comps found within radius.
Projected returns pro-forma
10.0% appreciation · 3.0% rent growth · sell at horizon
- IRR
- 37.0%
- Equity multiple
- 3.86×
- Total profit
- $122,317
- Equity at exit
- $137,835
- IRR
- 31.8%
- Equity multiple
- 8.69×
- Total profit
- $329,356
- Equity at exit
- $297,245
Cash invested: $42,840 (down + closing). Projections, not guarantees.
Landlord ↔ Tenant lean methodology
- Overall (STATE)
- 87 Strongly Landlord-Friendly
- State Arizona
- 87 Strongly Landlord-Friendly · R+3
- County
- — inherits STATE
- City
- — inherits STATE
ZIP-level market 85354
- Home prices YoY
- 30.5%
- Active inventory
- 785
- Price-to-rent
- 6.7×
Monthly cashflow live
- Estimated rent
- $1,917 medium interval (Pro) →
- Mortgage (P&I)
- −$802
- Tax from tax record
- −$35 /mo · $423/yr
- Insurance
- −$64
- HOA
- −$0
- Vacancy / Maint / Mgmt
- −$403
- Net cashflow
- $613
Break-even live
UW: 25.0% down · 7.5% · 30yr · 1.5% tax · 5.0% vac · 8.0% maint · 8.0% mgmt
Financing live
Cash to close
- Down payment
- $38,250
- Closing costs
- $4,590
- Reserves months
- —
- Total cash needed
- —
Loan-product check · same deal, 3 products live
Conventional
25% down · 7.5% · 30yr
- Down + closing
- —
- Monthly P&I
- —
- Monthly cashflow
- —
- DSCR
- —
- Eligible?
- —
Personal DTI + credit; lowest rate.
DSCR
20% down · 8.5% · 30yr
- Down + closing
- —
- Monthly P&I
- —
- Monthly cashflow
- —
- DSCR
- —
- Eligible?
- —
No personal income docs; deal must DSCR.
Hard money
10% down · 12.0% · 12mo
- Down + closing
- —
- Monthly P&I
- —
- Monthly cashflow
- —
- DSCR
- —
- Eligible?
- —
Short-term bridge; refi at stabilization.
Listing history 14 events
-
2026-06-18days on market $153,000 Active 17 DOM
-
2026-06-17price $153,000 Active 16 DOM
-
2026-06-17days on market $163,000 Active 16 DOM
-
2026-06-16days on market $163,000 Active 15 DOM
-
2026-06-15days on market $163,000 Active 14 DOM
-
2026-06-13days on market $163,000 Active 12 DOM
-
2026-06-13days on market $163,000 Active 11 DOM
-
2026-06-09days on market $163,000 Active 8 DOM
-
2026-06-08days on market $163,000 Active 7 DOM
-
2026-06-07days on market $163,000 Active 6 DOM
-
2026-06-04pricedays on market $163,000 Active 3 DOM
-
2026-06-03days on market $173,000 Active 2 DOM
-
2026-06-02remarks 620-char remark
-
2026-06-02$173,000 Active 1 DOM
ⓘ Source: listings_history table (triggers on properties + properties_extension) + one-shot
backfill from property_details.listing_events for pre-trigger history.
Tax reassessment forecast AZ · Resets to sale price
- Current annual tax
- $423 · $35/mo
- Projected year-2 tax
- $1,010 · $84/mo
- Expected delta
- +$586/yr (+$49/mo · 138.5%)
ⓘ Screening estimate from a state-policy table — verify with the county assessor before closing.
Climate risk First Street
- Flood 1/10 Low FEMA zone X (shaded) · 0% chance over 30 yrs
- Wildfire 5/10 Major
- Heat 9/10 Extreme 7 d/yr ≥114°F today · 17 d/yr by 30 yrs out
- Wind 1/10 Low
- Air quality 1/10 Low 0 unhealthy d/yr today · 0 by 30 yrs out
Nearby sold comps map
Loading sold comps map…
Walkable amenities ~0.75 mi
Loading nearby amenities…
Taxation est. · year 1
- Rental income
- $23,007
- − Mortgage interest
- −$8,570
- − Property taxes
- −$423
- − Insurance
- −$765
- − Repairs & maintenance
- −$1,841
- − Management
- −$1,841
- − Depreciation
- −$4,451
- Taxable income
- $5,116
- Est. tax owed @ 24.0%
- −$1,228
- After-tax cash flow
- $6,131/yr
For passive investors: Depreciation is non-cash, so a rental often shows a tax loss while cash-flowing — sheltering income. Rental losses are passive: they offset passive income freely, and up to $25,000/yr can offset ordinary (W-2) income if you actively participate and your MAGI is under $100k (phasing out to $0 by $150k); unused losses carry forward. On sale, claimed depreciation is recaptured at up to 25%, and gains may owe capital-gains tax (a 1031 exchange can defer both). Figures are a year-1 estimate at your 24.0% rate — not tax advice; consult a CPA.
Schools (NCES district)
- District
- Saddle Mountain Unified School District (4254)
- NCES district ID
- 0407170
- Math proficiency
- 26% ▼ -17.00%
- Reading proficiency
- 27% ▼ -8.00%
- Median HH income
- $61,981
- Composite
- 24.45/100
- National rank
- #7666
- State rank
- #117 of 249 in AZ
Livability — Tonopah
- Score
- 40/100
- State rank
- #400
- US rank
- #27231
Category grades
Schools grade is shown separately in the Schools card above.
Census & demographics
- Population (ZIP)
- 7,731
Population outlook (Maricopa County) Hauer SSP2
- Today (2025)
- 4,979,203 people
- By 2030
- 5,378,229 · +8.0%
- By 2040
- 6,156,598 · +23.6%
- By 2050
- 6,872,376 · +38.0%
- By 2075
- 8,401,270 · +68.7%
- By 2100
- 9,247,439 · +85.7%
Race, ethnicity, and origin ACS 2023
- Neighborhood character
- Majority White (63%)
- Race & ethnicity
- White 63% Hispanic / Latino 35% Two or more races 18%
- Hispanic origin (detail)
- Mexican 31%
- Common ancestry
- Slovak 2% Italian 2% Portuguese 1%
- Foreign-born
- 11% · Canada
- Languages at home
- 76% English-only · Spanish 23%
Political lean MEDSL · Maricopa
- 2024 margin
- Toss-up / Even · D 47.7% · R 51.2% · Other 1.1%
- 2008→2024 swing
- +7.1pp toward D · 2008: -10.6pp · 2024: -3.5pp
- All cycles
- 2024: R+3.5 2020: D+2.2 2016: R+3.5 2012: R+12.0 2008: R+10.6
Not yet ingested
- Civics
- —
Market trends
- HPI YoY
- ▲ 117.45%
- Current HPI
- 502.8512
- Rent YoY
- —
- Metro
- —
- State GDP YoY
- ▲ 4.54%
- F500 in state
- 20
Industry mix (Fortune 500 HQ in AZ)
| Industry | F500 HQs | Revenue |
|---|---|---|
| Technology | 2 | $13B |
|
||
| Mining / Metals | 1 | $23B |
|
||
| Environmental Services | 1 | $16B |
|
||
| Metals / Steel | 1 | $14B |
|
||
| Technology Distribution | 1 | $9B |
|
||
| Homebuilding | 1 | $8B |
|
||
Price history
+15.3% since first listed31 events — show timeline
- 2026-06-01 Relisted — ARMLS
- 2026-01-31 Relisted — ARMLS
- 2026-01-31 Price Changed $173,000 ARMLS
- 2026-01-30 Listed $140,000 ARMLS
- 2026-01-30 Listing Removed — ARMLS
- 2026-01-30 Listing Removed — ARMLS
- 2025-11-25 Pending — ARMLS
- 2025-11-25 Listing Removed — ARMLS
- 2025-10-22 Price Changed $173,000 ARMLS
- 2025-09-23 Price Changed $183,000 ARMLS
- 2025-08-21 Listed $193,000 ARMLS
- 2019-03-26 Sold (Public Records) $150,000 Public Records
- 2019-03-26 Sold (MLS) $150,000 ARMLS
- 2019-01-26 Pending — ARMLS
- 2019-01-17 Listed $149,900 ARMLS
- 2018-12-11 Pending — ARMLS
- 2018-12-10 Listing Removed — ARMLS
- 2018-12-03 Price Changed $148,800 ARMLS
- 2018-10-14 Listed $149,500 ARMLS
- 2015-04-28 Sold (MLS) $43,000 ARMLS
- 2015-04-08 Pending — ARMLS
- 2015-04-08 Contingent — ARMLS
- 2015-03-04 Price Changed $43,000 ARMLS
- 2015-02-20 Listed $41,900 ARMLS
- 2012-10-31 Sold (MLS) $55,000 ARMLS
- 2012-08-07 Pending — ARMLS
- 2012-08-07 Listed $55,000 ARMLS
- 2012-07-31 Sold (MLS) $55,000 ARMLS
- 2012-06-27 Pending — ARMLS
- 2012-06-27 Listed $55,000 ARMLS
- 2009-02-06 Sold (Public Records) $150,000 Public Records
Property tax history
+7.2%/yrLatest (2025): $423 · +10.2% YoY. Source: county tax records.
Cash-flow waterfall
monthlySold comps — $/sqft
last 12 mo · ≤1 miLoading sold comps…