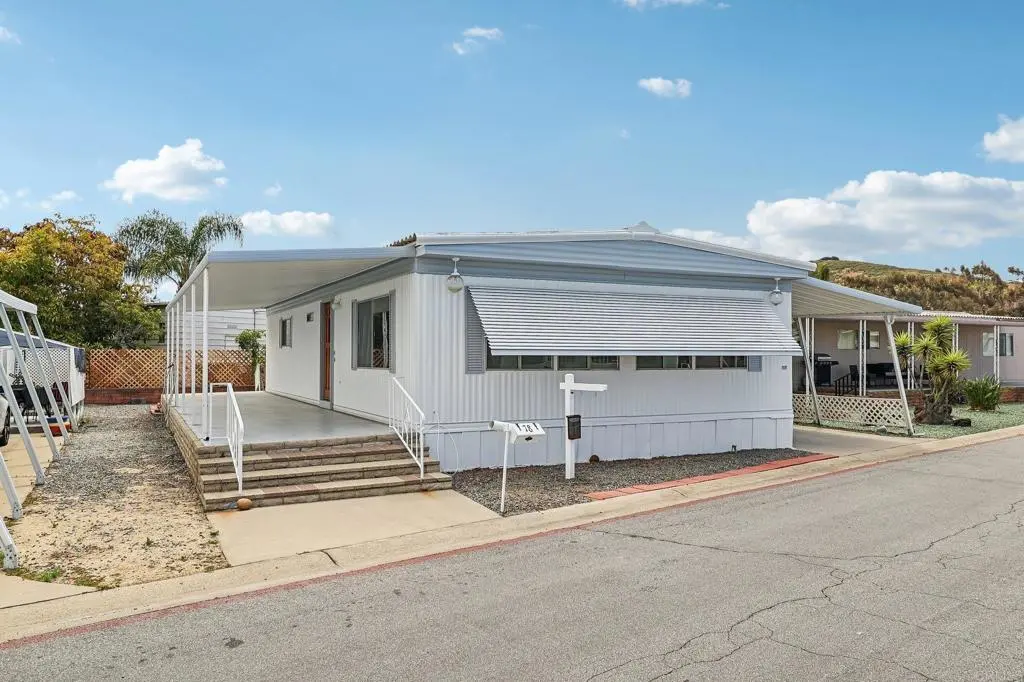
78 El Prado Ln · Oceanside, CA
Flood risk 4/10 · Minor
- FEMA flood zone
- A99
- Chance of flooding over 30 yrs
- 0.22%
- Est. flood insurance / yr
- $1,009 – $1,996
Fire risk 2/10 · Minimal
- Est. fire insurance / yr
- $659 – $1,223
Heat risk 5/10 · Moderate
- Hot days now (above 86°F)
- 7 days/yr
- Hot days in 30 yrs
- 23 days/yr
Wind risk 1/10 · Minimal
- Chance of severe wind over 30 yrs
- —
Air-quality risk 4/10 · Minor
- Unhealthy air days now
- 5 days/yr
- Unhealthy air days in 30 yrs
- 5 days/yr
Risk factors via First Street. Map © Google.
Why this score? — see what drove the C grade
The composite is a weighted blend of 9 inputs, each scored 0–100. Each bar is that input's sub-score; the figure is the points it added to the 100-point composite (weight × sub-score).
- Cash flow +23.4/30.0
- ARV discount +11.0/15.0
- DSCR +7.5/10.0
- 1% rule +6.1/10.0
- Schools +3.6/10.0
- Livability +3.2/5.0
- Rent growth +2.5/5.0
- Condition / age +2.5/5.0
- Appreciation +0.0/10.0
$249,000
🖨 Deal sheet 📄 Offer letter ✓ Due diligence
Listing remarks
Move-in ready 2-bedroom, 2-bath home located in a well-maintained 55+/18+ community with low space rent of only $592/month. This home has been thoughtfully improved with new flooring, fresh interior paint, and a renovated kitchen featuring modern finishes that enhance the overall feel of the space. The functional layout offers comfortable everyday living with bright, open living areas and natural light throughout. The kitchen and main living spaces flow easily, creating a practical and inviting environment for both relaxing and entertaining. Residents enjoy access to a community pool and peaceful surroundings, all within close proximity to shopping, dining, and a short drive to the beach. A
Key facts
- Move-in ready
- Recently remodeled
- Refreshed interior
Tags
Property features AI
Finance
- Other: Park name: Mission View West
- Financial info: Monthly land lease: $591
- HOA & community: Senior community; Land lease community
Exterior
- Parking: 2 carport spaces; 2 total parking spaces; Located in the Mission View West park
- Utilities: Assessor's data lists lot size
- Home design: Mobile home (12' x 48'); Single-story; Mobile home remains
- Construction: Mobile construction
- Exterior features: Community pool; Close to clubhouse; Curbs
Interior
- Kitchen: Kitchen (appliances not listed)
- Bedrooms: Primary bedroom; Primary suite
- Bathrooms: 2 full bathrooms
- Heating & cooling: Forced air heating
- Interior features: One-level home; Entry located at the carport; Has view
- Laundry & utility: Laundry inside; Washer included; Dryer included
Neighborhood map
What this means for you Summary
Snapshot
- This is a 2-bed/2.0-bath manufactured listed at $249k.
Deal economics
- At list price, monthly cash flow is $334 ($4k/yr) — positive.
- The deal already cash-flows at list — no discount required.
- Meets the 1% rule at list price ($3k rent vs $249k).
- Recommended offer: $242k (3.0% below list) — sets the bar for market timing.
- Cap rate 8.5% vs local median 2.5% in Oceanside — top-decile yield for the area; either an underpriced asset or a hidden risk that comps aren't pricing in. Stress-test before assuming the spread holds.
Location & tenants
- Location reads 64/100 on livability (#413 in CA) — a middle-class / working-renter tenant base. Strengths: amenities A+, commute A+, employment A; Watch: schools D+, crime D, cost of living F.
- Oceanside Unified (suburban): math 31% / reading 51% proficiency, ranked #221 of 517 in CA (top 43%) — families likely to look elsewhere, expect single-tenant / working-renter base with shorter leases.
- Market conditions: Rents soft (-0.1%/yr); 69 active listings in the ZIP; 40 comparable units currently listed for rent nearby; rentals at typical pace (median 24d on market — plan ~3-4 weeks tenant-placement turnaround); 11,759 units permitted in San Diego County in 2024 (7,244 in 5+ unit buildings).
- At $2,759/mo this rent would consume 47% of the median local household income ($70k/yr) (locally 4169% of renters already pay >50% of income on rent) — very limited rent-growth headroom before tenants either downsize or default.
Forward outlook
- Local home prices are declining (-3.0%/yr); year-one equity from $2k of loan paydown is wiped out by about $7k of value loss. Plan a longer hold.
- San Diego County population projected at +20% by 2050 — long-run rental-demand tailwind backs the buy-and-hold thesis.
Negotiation context
- It's been on market 50 days — a 3% lower offer ($242k) is reasonable based on typical stale-listing flexibility.
Risks & watch-outs
- Watch-outs: flood insurance adds $125/mo.
- Climate carrying-cost: in FEMA flood zone A99 (mandatory federal flood insurance); extreme-heat days projected 7→23/yr by 2055 (HVAC capex compounding) — expect insurance premiums to compound above CPI over the hold.
Questions for the listing agent
- It's been on market 50 days. Have you received any prior offers? Is the seller open to a 3% concession, seller financing, or rate buy-down credit?
- Built in 1968 — when were the roof, HVAC, electrical panel, plumbing, and water heater last replaced?
- What's the actual annual flood-insurance premium (NFIP or private), and is the property in a SFHA with mandatory coverage?
- Is there a deadline driving the sale (1031 exchange, divorce, estate, relocation)? That informs how much negotiation room exists.
- Schools are D-rated, which usually means shorter tenancies and higher turnover. Who's the typical renter profile here, and what's been the actual vacancy rate?
- Crime grade is D in this area — have there been break-ins, vandalism, or insurance claims at this property in the last 3 years? What carrier currently insures it and at what premium?
- What's the average days-on-market for RENTAL listings here right now (not sales)? A rising rental-DOM trend means longer vacancies and softer asking-rent achievability than the comps imply.
- What's the recent tenant-quality profile in this submarket — average credit score on applications, eviction rate, late-payment / NSF rate, and stable-employment percentage? A property-management company in the area should have these aggregated.
- How much new for-sale + rental construction is in the pipeline within 1–3 miles? Heavy new supply typically softens prices + rents 12–24 months out; constrained supply supports both.
Investment metrics
- 1% rule
- 1.11% ✓
- Cap rate
- 8.50%
- Cash-on-cash
- 7.90%
- DSCR
- 1.35
- GRM
- 7.5
CMA / ARV
- ARV (median comp)
- $270,000
- List price
- $249,000
- Delta
- -7.78%
- Verdict
- FAIR
- Comps
- 20 within 1.0 mi
Show comp detail 12 sales within ~0.75 mi
| Address | Dist | Beds/Ba | Sqft | Sold | Price | $/sf | Match |
|---|---|---|---|---|---|---|---|
| 88 Estrella Ln | 0.07mi | 2/2.0 | 1,168 (+1%) | 6mo | $249,000 | $213 | 90 |
| 221 N El Camino Real #67 | 0.13mi | 3/2.0 (+1) | 1,080 (-6%) | 3mo | $265,000 | $245 | 76 |
| 138 Steven Ln | 0.30mi | 2/2.0 | 1,136 (-1%) | 10mo | $255,500 | $225 | 75 |
| 41 Chico Ln | 0.09mi | 2/2.0 | 1,080 (-6%) | 16mo | $160,000 | $148 | 72 |
| 2 Bahia Ln | 0.10mi | 2/2.0 | 1,000 (-13%) | 2mo | $150,000 | $150 | 72 |
| 200 N El Camino Real #293 | 0.39mi | 2/2.0 | 1,152 (0%) | 14mo | $209,000 | $181 | 70 |
| 57 El Morro Ln | 0.07mi | 2/2.0 | 1,040 (-10%) | 14mo | $200,000 | $192 | 69 |
| 221 N El Camino Real #46 | 0.09mi | 2/2.0 | 1,296 (+12%) | 10mo | $268,500 | $207 | 67 |
| 200 N El Camino Real #67 | 0.32mi | 2/2.0 | 1,080 (-6%) | 9mo | $230,000 | $213 | 67 |
| 221 N El Camino Real Real #57 | 0.09mi | 2/2.0 | 1,008 (-12%) | 14mo | $262,000 | $260 | 63 |
| 276 N El Camino Real #120 | 0.32mi | 2/2.0 | 1,248 (+8%) | 12mo | $365,500 | $293 | 61 |
| 276 N El Camino Real #59 | 0.32mi | 2/2.0 | 1,296 (+12%) | 7mo | $285,000 | $220 | 58 |
Match score weights: distance 35% · size 25% · config 20% · recency 20%. Top-matched comps best support the ARV.
Projected returns pro-forma
-3.0% appreciation · 0.0% rent growth · sell at horizon
- IRR
- -11.0%
- Equity multiple
- 0.61×
- Total profit
- $-27,058
- Equity at exit
- $37,127
- IRR
- -7.1%
- Equity multiple
- 0.61×
- Total profit
- $-26,956
- Equity at exit
- $21,529
Cash invested: $69,720 (down + closing). Projections, not guarantees.
Landlord ↔ Tenant lean methodology
- Overall (STATE)
- 18 Strongly Tenant-Friendly
- State California
- 18 Strongly Tenant-Friendly · D+13
- County
- — inherits STATE
- City
- — inherits STATE
ZIP-level market 92058
- Home prices YoY
- -34.9%
- Rents YoY
- -0.1%
- Active inventory
- 69
- Price-to-rent
- 7.5×
Monthly cashflow live
- Estimated rent
- $2,759 high interval (Pro) →
- Mortgage (P&I)
- −$1,306
- Tax est. 1.5%
- −$311 /mo · $3,735/yr
- Insurance
- −$104
- Flood insurance flood zone
- −$125 /mo · $1,502/yr
- HOA
- −$0
- Vacancy / Maint / Mgmt
- −$579
- Net cashflow
- $334
Break-even live
UW: 25.0% down · 7.5% · 30yr · 1.5% tax · 5.0% vac · 8.0% maint · 8.0% mgmt
Financing live
Cash to close
- Down payment
- $62,250
- Closing costs
- $7,470
- Reserves months
- —
- Total cash needed
- —
Loan-product check · same deal, 3 products live
Conventional
25% down · 7.5% · 30yr
- Down + closing
- —
- Monthly P&I
- —
- Monthly cashflow
- —
- DSCR
- —
- Eligible?
- —
Personal DTI + credit; lowest rate.
DSCR
20% down · 8.5% · 30yr
- Down + closing
- —
- Monthly P&I
- —
- Monthly cashflow
- —
- DSCR
- —
- Eligible?
- —
No personal income docs; deal must DSCR.
Hard money
10% down · 12.0% · 12mo
- Down + closing
- —
- Monthly P&I
- —
- Monthly cashflow
- —
- DSCR
- —
- Eligible?
- —
Short-term bridge; refi at stabilization.
Rent comps 40 comps
| Address | Beds | Baths | Sqft | Rent | $/sqft | DOM | Units | Dist |
|---|---|---|---|---|---|---|---|---|
| 141 Douglas Dr Unit 75 Oceanside, CA | 2.0 | 2.0 | 1298 | $2,375 | $1.83 | 4d | 1 | 0.03mi |
| 266 N El Camino Real Oceanside, CA | 2.0 | 1.0 | 865 | $2,500 | $2.89 | 11d | 4 | 0.12mi |
| 200 N El Camino Real #263 Oceanside, CA | 2.0 | 2.0 | 1440 | $2,475 | $1.72 | 4d | 1 | 0.30mi |
| 200 N El Camino Real #52 Oceanside, CA | 2.0 | 2.0 | 1500 | $2,750 | $1.83 | 4d | 1 | 0.30mi |
| 200 N El Camino Real #291 Oceanside, CA | 2.0 | 1.0 | 756 | $2,055 | $2.72 | 24d | 1 | 0.30mi |
| 283 Douglas Dr Oceanside, CA | 2.0–3.0 | 2.0 | 1017 | $2,439 | $2.40 | 1d | 7 | 0.35mi |
| 550 Los Arbolitos Blvd Oceanside, CA | 1.0–3.0 | 1.0–2.0 | 933 | $2,634 | $2.82 | 1d | 19 | 0.50mi |
| 615 Fredricks Ave #166 Oceanside, CA | 2.0 | 2.0 | 1000 | $2,650 | $2.65 | 43d | 1 | 0.51mi |
| 615 Fredricks Ave Unit 2nd floor Oceanside, CA | 2.0 | 2.0 | 1000 | $2,650 | $2.65 | 24d | 1 | 0.51mi |
| 263 San Dimas Ave Oceanside, CA | 2.0 | 2.0 | 908 | $3,850 | $4.24 | 43d | 1 | 0.52mi |
| 3891 San Ramon Dr Oceanside, CA | 1.0–2.0 | 1.0–2.0 | 814 | $2,908 | $3.57 | 1d | 20 | 0.59mi |
| 264 Rancho Del Oro Dr Oceanside, CA | 2.0 | 1.0–2.0 | 988 | $2,774 | $2.81 | 1d | 17 | 0.65mi |
| 359 San Dimas Ave Oceanside, CA | 2.0 | 1.0 | 820 | $3,000 | $3.66 | 20d | 1 | 0.71mi |
| 4110 Sitio Flor Oceanside, CA | 3.0 | 2.0 | 1366 | $3,595 | $2.63 | 43d | 1 | 0.75mi |
| 3685 Vista Campana N #74 Oceanside, CA | 2.0 | 2.0 | 1099 | $2,550 | $2.32 | 24d | 1 | 0.80mi |
| 4213 La Casita Way #4 Oceanside, CA | 2.0 | 2.5 | 1210 | $2,695 | $2.23 | 43d | 1 | 0.84mi |
| 4212 Vista del Rio Way #2 Oceanside, CA | 2.0 | 2.5 | 1224 | $2,800 | $2.29 | 43d | 1 | 0.84mi |
| 4203 Mission Ranch Way Oceanside, CA | 2.0 | 2.5 | 1284 | $3,400 | $2.65 | 43d | 1 | 0.85mi |
| 4398 Rainier Way Oceanside, CA | 1.0–2.0 | 1.0–2.0 | 827 | $2,750 | $3.32 | 1d | 6 | 0.93mi |
| 4233 Vista Panorama Way Oceanside, CA | 2.0 | 2.5 | 1250 | $1,500 | $1.20 | 43d | 1 | 0.94mi |
| 4479 Brisbane Way #6 Oceanside, CA | 2.0 | 2.0 | 1141 | $2,995 | $2.62 | 4d | 1 | 0.94mi |
| 3452 Las Vegas Dr Oceanside, CA | 3.0 | 2.0 | 1150 | $3,995 | $3.47 | 24d | 1 | 0.95mi |
| 4236 Vista del Rio Way #2 Oceanside, CA | 2.0 | 2.5 | 1500 | $2,695 | $1.80 | 20d | 1 | 0.95mi |
| 4483 Brisbane Way #1 Oceanside, CA | 2.0 | 2.0 | 1141 | $3,000 | $2.63 | 43d | 1 | 0.96mi |
| 4265 Mesa Vista Way #3 Oceanside, CA | 2.0 | 2.5 | 1210 | $2,900 | $2.40 | 43d | 1 | 0.98mi |
| 4243 Arroyo Vista Way #330 Oceanside, CA | 2.0 | 2.0 | 791 | $3,700 | $4.68 | 43d | 1 | 1.00mi |
| 4251 Arroyo Vista Way #344 Oceanside, CA | 3.0 | 2.0 | 1094 | $3,850 | $3.52 | 43d | 1 | 1.04mi |
| 634 Sumner Way #1 Oceanside, CA | 2.0 | 2.0 | 1141 | $2,895 | $2.54 | 4d | 1 | 1.05mi |
| 771 Iverson Point Way Oceanside, CA | 2.0 | 1.5 | 1104 | $3,050 | $2.76 | 14d | 1 | 1.12mi |
| 3625 Dearborn St Oceanside, CA | 2.0 | 1.5 | 1050 | $3,000 | $2.86 | 12d | 1 | 1.19mi |
| 3901 Mesa Dr Oceanside, CA | 1.0–3.0 | 1.0–2.0 | 846 | $2,755 | $3.26 | 1d | 19 | 1.21mi |
| 185 Avenida Las Brisas Apt A Oceanside, CA | 3.0 | 2.0 | 1350 | $3,100 | $2.30 | 43d | 1 | 1.25mi |
| 4269 Black Duck Way Oceanside, CA | 2.0 | 2.0 | 1056 | $2,800 | $2.65 | 10d | 1 | 1.30mi |
| 746 Point Arguello Oceanside, CA | 3.0 | 2.0 | 1260 | $3,495 | $2.77 | 24d | 1 | 1.36mi |
| 4504 Goldfinch Way Oceanside, CA | 3.0 | 2.5 | 1436 | $3,400 | $2.37 | 24d | 1 | 1.36mi |
| 4459 Anne Sladon St Oceanside, CA | 3.0 | 1.0 | 1161 | $2,950 | $2.54 | 24d | 1 | 1.37mi |
| 190 Avenida Descanso Oceanside, CA | 2.0 | 2.0 | 912 | $2,650 | $2.91 | 1d | 1 | 1.42mi |
| 4401 Mission Ave Oceanside, CA | 1.0–3.0 | 1.0–2.0 | 975 | $3,218 | $3.30 | 1d | 12 | 1.42mi |
| 4560 Anne Sladon St Oceanside, CA | 2.0 | 1.0 | 837 | $3,000 | $3.58 | 43d | 1 | 1.47mi |
| 757 Sunningdale Dr Oceanside, CA | 3.0 | 2.0 | 1400 | $4,200 | $3.00 | 17d | 1 | 1.47mi |
Listing history 15 events
-
2026-06-18days on market $249,000 Active 50 DOM
-
2026-06-17days on market $249,000 Active 49 DOM
-
2026-06-16days on market $249,000 Active 48 DOM
-
2026-06-15days on market $249,000 Active 47 DOM
-
2026-06-13days on market $249,000 Active 45 DOM
-
2026-06-13days on market $249,000 Active 44 DOM
-
2026-06-09days on market $249,000 Active 41 DOM
-
2026-06-08days on market $249,000 Active 40 DOM
-
2026-06-07days on market $249,000 Active 39 DOM
-
2026-06-04days on market $249,000 Active 36 DOM
-
2026-06-03days on market $249,000 Active 35 DOM
-
2026-06-02days on market $249,000 Active 34 DOM
-
2026-06-01days on market $249,000 Active 33 DOM
-
2026-05-31days on market $249,000 Active 32 DOM
-
2026-04-03$249,000 Active 841-char remark
ⓘ Source: listings_history table (triggers on properties + properties_extension) + one-shot
backfill from property_details.listing_events for pre-trigger history.
Climate risk First Street
- Flood 4/10 Moderate FEMA zone A99 · 22% chance over 30 yrs
- Wildfire 2/10 Low
- Heat 5/10 Major 7 d/yr ≥86°F today · 23 d/yr by 30 yrs out
- Wind 1/10 Low
- Air quality 4/10 Moderate 5 unhealthy d/yr today · 5 by 30 yrs out
Nearby sold comps map
Loading sold comps map…
Walkable amenities ~0.75 mi
Loading nearby amenities…
Taxation est. · year 1
- Rental income
- $33,110
- − Mortgage interest
- −$13,948
- − Property taxes
- −$3,735
- − Insurance
- −$2,748
- − Repairs & maintenance
- −$2,649
- − Management
- −$2,649
- − Depreciation
- −$7,244
- Taxable income
- $139
- Est. tax owed @ 24.0%
- −$33
- After-tax cash flow
- $3,972/yr
For passive investors: Depreciation is non-cash, so a rental often shows a tax loss while cash-flowing — sheltering income. Rental losses are passive: they offset passive income freely, and up to $25,000/yr can offset ordinary (W-2) income if you actively participate and your MAGI is under $100k (phasing out to $0 by $150k); unused losses carry forward. On sale, claimed depreciation is recaptured at up to 25%, and gains may owe capital-gains tax (a 1031 exchange can defer both). Figures are a year-1 estimate at your 24.0% rate — not tax advice; consult a CPA.
Schools (NCES district)
- District
- Oceanside Unified
- NCES district ID
- 0628250
- Math proficiency
- 31% ▼ -5.00%
- Reading proficiency
- 51% ▲ 6.00%
- Median HH income
- $55,158
- Composite
- 35.74/100
- National rank
- #4853
- State rank
- #221 of 517 in CA
Livability — Oceanside
- Score
- 64/100
- State rank
- #413
- US rank
- #14081
Category grades
Schools grade is shown separately in the Schools card above.
Census & demographics
- Census place
- Oceanside, CA
- County
- San Diego County · 3,178,799 people
- City population
- 198,702
- Metro
- San Diego-Chula Vista-Carlsbad, CA
- Population (ZIP)
- 49,834
- Household income
- $69,970
- Rent vs Own
- Severe rent burden
- 4169.0
Population outlook (San Diego County) Hauer SSP2
- Today (2025)
- 3,678,185 people
- By 2030
- 3,856,546 · +4.8%
- By 2040
- 4,171,407 · +13.4%
- By 2050
- 4,421,607 · +20.2%
- By 2075
- 4,831,599 · +31.4%
- By 2100
- 4,832,502 · +31.4%
Race, ethnicity, and origin ACS 2023
- Neighborhood character
- Diverse neighborhood (Simpson 0.66)
- Race & ethnicity
- Hispanic / Latino 43% White 38% Two or more races 25% Black 6% Asian 5% Native American 1%
- Hispanic origin (detail)
- Mexican 34% Puerto Rican 2%
- Common ancestry
- Italian 4% Lithuanian 1% Romanian 1%
- Foreign-born
- 15% · Canada, Vietnam, Jamaica
- Languages at home
- 68% English-only · Spanish 26% Tagalog/Filipino 2% Other Asian/Pacific 1%
Political lean MEDSL · San Diego
- 2024 margin
- D (+16.8) · D 56.9% · R 40.1% · Other 2.9%
- 2008→2024 swing
- +6.6pp toward D · 2008: 10.2pp · 2024: 16.8pp
- All cycles
- 2024: D+16.8 2020: D+22.8 2016: D+17.8 2012: D+5.1 2008: D+10.2
Not yet ingested
- Civics
- —
Market trends
- HPI YoY
- ▼ -223.54%
- Current HPI
- 417.6464
- Rent YoY
- ▼ -0.11%
- Metro
- San Diego-Chula Vista-Carlsbad, CA
- State GDP YoY
- ▲ 3.21%
- F500 in state
- 116
Industry mix (Fortune 500 HQ in CA)
| Industry | F500 HQs | Revenue |
|---|---|---|
| Technology | 27 | $1,492B |
|
||
| Financial Services | 3 | $174B |
|
||
| Retail | 3 | $44B |
|
||
| Insurance | 3 | $26B |
|
||
| Media / Entertainment | 2 | $115B |
|
||
| Pharmaceuticals / Biotech | 2 | $62B |
|
||
Price history
1 event — show timeline
- 2026-04-03 Listed $249,000 CRMLS
Cash-flow waterfall
monthlySold comps — $/sqft
last 12 mo · ≤1 miLoading sold comps…