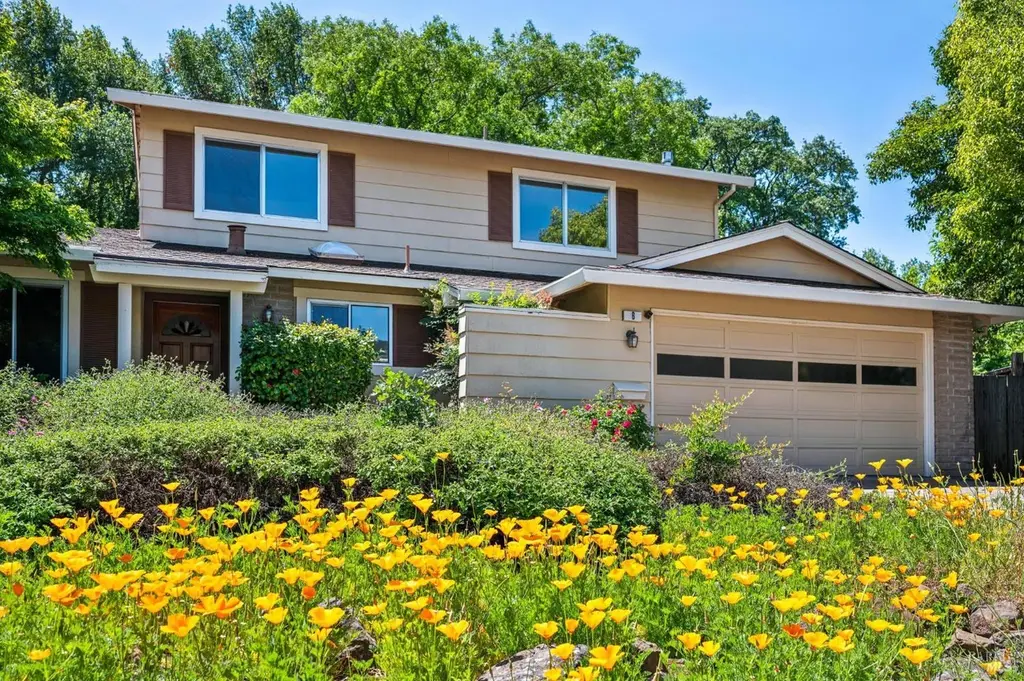
6 La Noche Ct · Novato, CA
Flood risk 9/10 · Severe
- FEMA flood zone
- AO
- Chance of flooding over 30 yrs
- 0.99%
- Est. flood insurance / yr
- $848 – $2,087
Fire risk 5/10 · Moderate
- Est. fire insurance / yr
- $659 – $1,223
Heat risk 3/10 · Minor
- Hot days now (above 91°F)
- 8 days/yr
- Hot days in 30 yrs
- 18 days/yr
Wind risk 1/10 · Minimal
- Chance of severe wind over 30 yrs
- —
Air-quality risk 7/10 · Major
- Unhealthy air days now
- 12 days/yr
- Unhealthy air days in 30 yrs
- 12 days/yr
Risk factors via First Street. Map © Google.
Why this score? — see what drove the D grade
The composite is a weighted blend of 9 inputs, each scored 0–100. Each bar is that input's sub-score; the figure is the points it added to the 100-point composite (weight × sub-score).
- ARV discount +15.0/15.0
- Cash flow +10.6/30.0
- Schools +4.1/10.0
- Livability +3.6/5.0
- DSCR +3.1/10.0
- Rent growth +2.5/5.0
- Condition / age +2.5/5.0
- 1% rule +2.0/10.0
- Appreciation +0.0/10.0
$999,000
🖨 Deal sheet (PDF) 📄 Offer letter ✓ Due diligence
Listing remarks
Offered for the first time in over 50 years, 6 La Noche Court presents a rare opportunity to own a spacious, well-loved cul-de-sac home in the highly sought-after San Marin area of Novato. Built in 1969, this two-story residence offers 2,300+ sq ft of living space on an expansive 8,800 sq ft lot. With 5 bedrooms, 3 baths, and a versatile office/flex room, the layout is ideal for comfortable living. The main level features four bedrooms including one with an en-suite bath alongside a bright, open family room with abundant natural light and a cozy gas fireplace. A separate living room provides additional space to relax or entertain. The light and bright kitchen offers generous cabinet storage
Key facts
- 8,799 sq ft lot
- 2 garage spots
- Pool
Property features AI
Finance
- HOA & community: No homeowners association
Exterior
- Parking: 2-car garage with interior access; Garage faces front; Total parking for 4 vehicles
- Utilities: Public sewer
- Home design: Single family residence; Residential property; 2 stories
- Construction: No basement
- Exterior features: Wood fencing; Cul-de-sac lot; Private built-in pool with gas heat, fenced and pool sweep; Built-in spa / hot tub
Interior
- Kitchen: Built-in electric oven; Built-in refrigerator; Electric cooktop; Dishwasher; Microwave; Laminate countertops
- Bedrooms: 5 bedrooms (main level includes bedrooms)
- Flooring: Carpet; Tile
- Bathrooms: 3 full bathrooms; Shower stalls and tub/shower combinations
- Heating & cooling: Central heating; Central cooling
- Interior features: Office; Family room with skylight; Kitchen and family room combined; Skylights in kitchen; One fireplace with gas log
- Laundry & utility: Washer and dryer included; Laundry located in garage
Neighborhood map
What this means for you Summary
Snapshot
- This is a 5-bed/3.0-bath single-family listed at $999k.
Deal economics
- At list price, monthly cash flow is $-619 ($-7k/yr) — negative.
- To cash-flow at today's rent, offer at most $890k (10.9% below list).
- To meet the 1% rule (rent ≥ 1% of price), the offer needs to be $696k (30.3% below list).
- Recommended offer: $696k (30.3% below list) — sets the bar for 1% rule.
- Cap rate 5.7% vs local median 2.4% in Novato — top-decile yield for the area; either an underpriced asset or a hidden risk that comps aren't pricing in. Stress-test before assuming the spread holds.
Location & tenants
- Location reads 71/100 on livability (#211 in CA) — a middle-class / working-renter tenant base. Strengths: commute A+, employment A+; Watch: amenities D, cost of living F, health & safety F.
- Novato Unified (suburban): math 38% / reading 50% proficiency, ranked #160 of 517 in CA (top 31%) — families likely to look elsewhere, expect single-tenant / working-renter base with shorter leases.
- Zoned schools: San Ramon Elementary (math 48% / reading 50%, grade D, #443 of 1,571 statewide, top 28%, 429 students, 17% FRL); Sinaloa Middle (math 43% / reading 58%, grade C, #95 of 498 statewide, top 19%, 745 students, 24% FRL); San Marin High (math 41% / reading 63%, grade D+, #296 of 1,170 statewide, top 27%, 1,144 students, 20% FRL).
- Market conditions: 61 active listings in the ZIP; 4 comparable units currently listed for rent nearby; rentals at typical pace (median 15d on market — plan ~3-4 weeks tenant-placement turnaround); solid renter incomes; 149 units permitted in Marin County in 2024 (5 in 5+ unit buildings).
- At $6,960/mo this rent would consume 77% of the median local household income ($108k/yr) (locally 357% of renters already pay >50% of income on rent) — very limited rent-growth headroom before tenants either downsize or default.
Forward outlook
- Local home prices are declining (-3.0%/yr); year-one equity from $7k of loan paydown is wiped out by about $30k of value loss. Plan a longer hold.
- Marin County population projected at +9% by 2050 — modest demand growth; plan on rents tracking national, not racing it.
Negotiation context
- It's been on market 31 days — a 3% lower offer ($969k) is reasonable based on typical stale-listing flexibility.
Risks & watch-outs
- Watch-outs: flood insurance adds $122/mo.
- Climate carrying-cost: in FEMA flood zone AO (mandatory federal flood insurance); moderate wildfire risk — expect insurance premiums to compound above CPI over the hold.
Questions for the listing agent
- What do current leases actually rent for vs. the listed asking? Can we see a recent rent roll and the last 12 months of T-12 income?
- It's been on market 31 days. Have you received any prior offers? Is the seller open to a 30% concession, seller financing, or rate buy-down credit?
- Built in 1969 — when were the roof, HVAC, electrical panel, plumbing, and water heater last replaced?
- What's the actual annual flood-insurance premium (NFIP or private), and is the property in a SFHA with mandatory coverage?
- Is there a deadline driving the sale (1031 exchange, divorce, estate, relocation)? That informs how much negotiation room exists.
- The area grade is low — what's the realistic commute time and amenity access for the typical tenant pool here? Any planned neighborhood developments (good or bad) we should know about?
- What's the average days-on-market for RENTAL listings here right now (not sales)? A rising rental-DOM trend means longer vacancies and softer asking-rent achievability than the comps imply.
- What's the recent tenant-quality profile in this submarket — average credit score on applications, eviction rate, late-payment / NSF rate, and stable-employment percentage? A property-management company in the area should have these aggregated.
- How much new for-sale + rental construction is in the pipeline within 1–3 miles? Heavy new supply typically softens prices + rents 12–24 months out; constrained supply supports both.
Investment metrics
- 1% rule
- 0.70% ✗
- Cap rate
- 5.70%
- Cash-on-cash
- -2.13%
- DSCR
- 0.91
- GRM
- 12.0
CMA / ARV
- ARV (median comp)
- $1,290,356
- List price
- $999,000
- Delta
- -22.58%
- Verdict
- UNDERPRICED
- Comps
- 20 within 1.0 mi
Show comp detail 12 sales within ~0.75 mi
| Address | Dist | Beds/Ba | Sqft | Sold | Price | $/sf | Match |
|---|---|---|---|---|---|---|---|
| 6 La Noche Ct | 0.00mi | 5/3.0 | 2,332 (0%) | 0mo | $1,110,000 | $476 | 100 |
| 6 Katlas Ct | 0.16mi | 4/3.0 (-1) | 2,386 (+2%) | 0mo | $1,520,000 | $637 | 84 |
| 99 San Benito Way | 0.50mi | 5/3.0 | 2,343 (+0%) | 4mo | $1,375,000 | $587 | 73 |
| 2094 Center Rd | 0.49mi | 4/2.0 (-1) | 2,337 (+0%) | 4mo | $975,000 | $417 | 64 |
| 508 San Marin Dr | 0.70mi | 4/2.5 (-1) | 2,342 (+0%) | 0mo | $1,167,800 | $499 | 59 |
| 15 Arbor Cir | 0.71mi | 5/3.0 | 2,342 (+0%) | 10mo | $1,210,000 | $517 | 58 |
| 2108 Feliz Dr | 0.16mi | 4/3.0 (-1) | 2,000 (-14%) | 7mo | $1,300,000 | $650 | 58 |
| 340 San Carlos Way | 0.50mi | 4/2.5 (-1) | 2,430 (+4%) | 9mo | $1,275,000 | $525 | 55 |
| 36 Andreas Ct | 0.54mi | 4/2.5 (-1) | 2,472 (+6%) | 7mo | $1,400,000 | $566 | 52 |
| 90 San Benito Way | 0.51mi | 4/3.0 (-1) | 2,140 (-8%) | 8mo | $975,000 | $456 | 51 |
| 29 Andreas Cir | 0.66mi | 4/3.0 (-1) | 2,559 (+10%) | 1mo | $1,365,000 | $533 | 47 |
| 26 Sotelo Way | 0.73mi | 4/2.5 (-1) | 2,196 (-6%) | 8mo | $1,377,500 | $627 | 42 |
Match score weights: distance 35% · size 25% · config 20% · recency 20%. Top-matched comps best support the ARV.
Projected returns pro-forma
-3.0% appreciation · 3.0% rent growth · sell at horizon
- IRR
- -20.8%
- Equity multiple
- 0.28×
- Total profit
- $-201,681
- Equity at exit
- $148,954
- IRR
- -14.2%
- Equity multiple
- 0.19×
- Total profit
- $-227,918
- Equity at exit
- $86,375
Cash invested: $279,720 (down + closing). Projections, not guarantees.
Landlord ↔ Tenant lean methodology
- Overall (STATE)
- 18 Strongly Tenant-Friendly
- State California
- 18 Strongly Tenant-Friendly · D+13
- County
- — inherits STATE
- City
- — inherits STATE
ZIP-level market 94945
- Active inventory
- 61
- Price-to-rent
- 12.0×
Monthly cashflow live
- Estimated rent
- $6,960 medium interval (Pro) →
- Mortgage (P&I)
- −$5,239
- Tax from tax record
- −$340 /mo · $4,078/yr
- Insurance
- −$416
- Flood insurance flood zone
- −$122 /mo · $1,468/yr
- HOA
- −$0
- Vacancy / Maint / Mgmt
- −$1,462
- Net cashflow
- $-619
Break-even live
Sensitivity live
| Price | -10% $-53 | -5% $-336 | +0% $-619 | +5% $-902 | +10% $-1,184 |
|---|---|---|---|---|---|
| Rent | -10% $-1,169 | -5% $-894 | +0% $-619 | +5% $-344 | +10% $-69 |
| Rate | -1.0pp $-116 | -0.5pp $-365 | base $-619 | +0.5pp $-878 | +1.0pp $-1,141 |
UW: 25.0% down · 7.5% · 30yr · 1.5% tax · 5.0% vac · 8.0% maint · 8.0% mgmt
Financing live
Cash to close
- Down payment
- $249,750
- Closing costs
- $29,970
- Reserves months
- —
- Total cash needed
- —
Loan-product check · same deal, 3 products live
Conventional
25% down · 7.5% · 30yr
- Down + closing
- —
- Monthly P&I
- —
- Monthly cashflow
- —
- DSCR
- —
- Eligible?
- —
Personal DTI + credit; lowest rate.
DSCR
20% down · 8.5% · 30yr
- Down + closing
- —
- Monthly P&I
- —
- Monthly cashflow
- —
- DSCR
- —
- Eligible?
- —
No personal income docs; deal must DSCR.
Hard money
10% down · 12.0% · 12mo
- Down + closing
- —
- Monthly P&I
- —
- Monthly cashflow
- —
- DSCR
- —
- Eligible?
- —
Short-term bridge; refi at stabilization.
Rent comps 4 comps
| Address | Beds | Baths | Sqft | Rent | $/sqft | DOM | Units | Dist |
|---|---|---|---|---|---|---|---|---|
| 2 Estrella Ct Novato, CA | 4.0 | 3.0 | 2152 | $5,750 | $2.67 | 14d | 1 | 0.51mi |
| 752 Eucalyptus Ave Novato, CA | 5.0 | 3.0 | 3256 | $9,900 | $3.04 | 0d | 1 | 0.71mi |
| 742 McClay Rd Novato, CA | 5.0 | 3.5 | 3033 | $6,500 | $2.14 | 1d | 1 | 0.86mi |
| 13 Black Oak Ln Novato, CA | 4.0 | 3.5 | 2952 | $6,200 | $2.10 | 23d | 1 | 1.40mi |
Listing history 7 events
-
2026-06-07statusdays on market $999,000 Pending 31 DOM
-
2026-06-04days on market $999,000 Contingent (Show) 30 DOM
-
2026-06-03days on market $999,000 Contingent (Show) 29 DOM
-
2026-06-02days on market $999,000 Contingent (Show) 28 DOM
-
2026-06-01days on market $999,000 Contingent (Show) 27 DOM
-
2026-05-31days on market $999,000 Contingent (Show) 26 DOM
-
2026-05-05$999,000 Active 1671-char remark
ⓘ Source: listings_history table (triggers on properties + properties_extension) + one-shot
backfill from property_details.listing_events for pre-trigger history.
Tax reassessment forecast CA · Resets to sale price
- Current annual tax
- $4,078 · $340/mo
- Projected year-2 tax
- $7,592 · $633/mo
- Expected delta
- +$3,514/yr (+$293/mo · 86.2%)
ⓘ Screening estimate from a state-policy table — verify with the county assessor before closing.
Climate risk First Street
- Flood 9/10 Extreme FEMA zone AO · 99% chance over 30 yrs
- Wildfire 5/10 Major
- Heat 3/10 Moderate 8 d/yr ≥91°F today · 18 d/yr by 30 yrs out
- Wind 1/10 Low
- Air quality 7/10 Severe 12 unhealthy d/yr today · 12 by 30 yrs out
Nearby sold comps map
Loading sold comps map…
Walkable amenities ~0.75 mi
Loading nearby amenities…
Taxation est. · year 1
- Rental income
- $83,518
- − Mortgage interest
- −$55,960
- − Property taxes
- −$4,078
- − Insurance
- −$6,462
- − Repairs & maintenance
- −$6,681
- − Management
- −$6,681
- − Depreciation
- −$29,062
- Taxable loss
- −$25,406
- Est. tax savings @ 24.0%
- +$6,098
- After-tax cash flow
- $-1,330/yr
For passive investors: Depreciation is non-cash, so a rental often shows a tax loss while cash-flowing — sheltering income. Rental losses are passive: they offset passive income freely, and up to $25,000/yr can offset ordinary (W-2) income if you actively participate and your MAGI is under $100k (phasing out to $0 by $150k); unused losses carry forward. On sale, claimed depreciation is recaptured at up to 25%, and gains may owe capital-gains tax (a 1031 exchange can defer both). Figures are a year-1 estimate at your 24.0% rate — not tax advice; consult a CPA.
Schools (NCES district)
- District
- Novato Unified
- NCES district ID
- 0627720
- Math proficiency
- 38% ▼ -11.00%
- Reading proficiency
- 50% ▼ -5.00%
- Median HH income
- $84,396
- Composite
- 41.06/100
- National rank
- #3576
- State rank
- #160 of 517 in CA
Livability — Novato
- Score
- 71/100
- State rank
- #211
- US rank
- #6675
Category grades
Schools grade is shown separately in the Schools card above.
Census & demographics
- Census place
- Novato, CA
- County
- Marin County · 243,328 people
- City population
- 59,522
- Metro
- San Francisco-Oakland-Berkeley, CA
- Population (ZIP)
- 17,635
- Household income
- $107,790
- Rent vs Own
- Severe rent burden
- 357.0
Population outlook (Marin County) Hauer SSP2
- Today (2025)
- 276,379 people
- By 2030
- 282,942 · +2.4%
- By 2040
- 292,937 · +6.0%
- By 2050
- 300,449 · +8.7%
- By 2075
- 316,946 · +14.7%
- By 2100
- 303,948 · +10.0%
Race, ethnicity, and origin ACS 2023
- Neighborhood character
- Diverse neighborhood (Simpson 0.59)
- Race & ethnicity
- White 59% Hispanic / Latino 23% Two or more races 9% Asian 8% Black 3%
- Hispanic origin (detail)
- Mexican 7%
- Common ancestry
- Slovak 3% Scotch-Irish 3% Lithuanian 3%
- Foreign-born
- 22% · Canada, China, Vietnam
- Languages at home
- 72% English-only · Spanish 16% Other Indo-European 3% Chinese 2%
Political lean MEDSL · Marin
- 2024 margin
- Solid D (+63.9) · D 80.6% · R 16.7% · Other 2.7%
- 2008→2024 swing
- +6.2pp toward D · 2008: 57.7pp · 2024: 63.9pp
- All cycles
- 2024: D+63.9 2020: D+66.5 2016: D+62.9 2012: D+50.5 2008: D+57.7
Not yet ingested
- Civics
- —
Market trends
- HPI YoY
- ▼ -725.83%
- Current HPI
- 266.2049
- Rent YoY
- —
- Metro
- San Francisco-Oakland-Berkeley, CA
- State GDP YoY
- ▲ 3.21%
- F500 in state
- 116
Industry mix (Fortune 500 HQ in CA)
| Industry | F500 HQs | Revenue |
|---|---|---|
| Technology | 27 | $1,492B |
|
||
| Financial Services | 3 | $174B |
|
||
| Retail | 3 | $44B |
|
||
| Insurance | 3 | $26B |
|
||
| Media / Entertainment | 2 | $115B |
|
||
| Pharmaceuticals / Biotech | 2 | $62B |
|
||
Price history
+11.1% since first listed4 events — show timeline
- 2026-06-16 Sold (MLS) $1,110,000 BAREIS
- 2026-06-05 Pending — BAREIS
- 2026-05-27 Contingent — BAREIS
- 2026-05-05 Listed $999,000 BAREIS
Property tax history
+3.3%/yrLatest (2025): $4,078 · +9.0% YoY. Source: county tax records.
Cash-flow waterfall
monthlySold comps — $/sqft
last 12 mo · ≤1 miLoading sold comps…