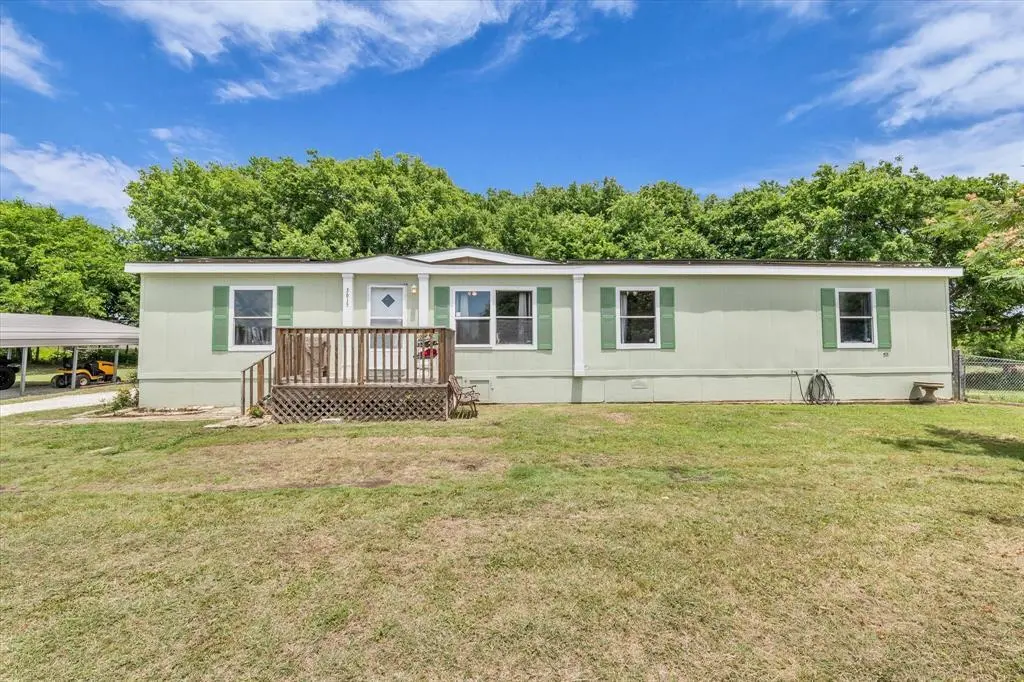
3615 Spring Valley Rd · Lorena, TX
Flood risk 5/10 · Moderate
- FEMA flood zone
- X (unshaded)
- Chance of flooding over 30 yrs
- 0.67%
- Est. flood insurance / yr
- $507 – $1,088
Fire risk 5/10 · Moderate
- Est. fire insurance / yr
- $1,222 – $2,270
Heat risk 7/10 · Major
- Hot days now (above 109°F)
- 7 days/yr
- Hot days in 30 yrs
- 24 days/yr
Wind risk 6/10 · Moderate
- Chance of severe wind over 30 yrs
- 70.0%
Air-quality risk 1/10 · Minimal
- Unhealthy air days now
- 0 days/yr
- Unhealthy air days in 30 yrs
- 0 days/yr
Risk factors via First Street. Map © Google.
Why this score? — see what drove the C- grade
The composite is a weighted blend of 9 inputs, each scored 0–100. Each bar is that input's sub-score; the figure is the points it added to the 100-point composite (weight × sub-score).
- Cash flow +20.9/30.0
- ARV discount +7.5/15.0
- DSCR +6.6/10.0
- Schools +5.4/10.0
- 1% rule +4.6/10.0
- Livability +3.6/5.0
- Rent growth +2.5/5.0
- Condition / age +2.5/5.0
- Appreciation +0.0/10.0
$225,000
🖨 Deal sheet 📄 Offer letter ✓ Due diligence
Listing remarks
Lorena beauty situated on approximately 1 beautiful acre, this inviting 3-bedroom, 2-bath home offers 1,848 square feet of comfortable living space with the perfect blend of room, functionality, and peaceful country charm. With wide open outdoor space and a fully fenced chain-link yard, there’s plenty of room for pets, gatherings, gardening, or simply enjoying the outdoors. Inside, you’ll find a spacious living area perfect for relaxing or entertaining, along with a generously sized kitchen featuring abundant cabinetry, ample counter space, and a layout designed for everyday living. The split-bedroom floor plan offers added privacy, with a spacious primary suite complete with it
Key facts
- Spacious living area
- Private bath
- Solar panels
Tags
Property features AI
Finance
- Other: Lot approximately 1 acre; Will not subdivide; Unknown encumbrance(s) noted
- Financial info: Listing accepts Cash, Conventional, FHA, and VA loan
- HOA & community: No association
Exterior
- Parking: Detached carport with 2 covered spaces; Direct access; Electric gate; Gravel parking; No garage
- Security: Smoke detector(s)
- Utilities: Aerobic septic / Septic; Rural water district; Electricity available; Phone available; Outside city limits; Gravel/rock access; Solar energy generation
- Home design: Mobile home (residential); One level; Shingle roof; Entry level on first floor
- Construction: Built in 2005; Siding exterior; Pillar/post/pier foundation
- Exterior features: Deck; Front porch; Rear porch; Chain link fence in back yard; Shed(s)
Interior
- Kitchen: Electric range; Dishwasher; Refrigerator; Kitchen island; Pantry; Vented exhaust fan; Water line to refrigerator
- Bedrooms: 3 bedrooms; Primary bedroom on level 1 with ensuite bath (garden tub, separate shower, dual sinks, separate vanities, walk-in closet); Primary bathroom on level 1 with built-in cabinets, garden tub and separate shower
- Flooring: Luxury vinyl plank
- Bathrooms: 2 full bathrooms
- Heating & cooling: Central heating; Central electric air conditioning; Ceiling fan(s)
- Interior features: Open floorplan; Kitchen island; Pantry; Double vanity; Built-in cabinets; Walk-in closet(s); Linen closet; Cable TV available; Room for freezer; Water line to refrigerator
- Laundry & utility: Full-size washer/dryer area; Washer hookup; Electric dryer hookup; Utility room; Electric water heater
Neighborhood map
What this means for you Summary
Snapshot
- This is a 3-bed/2.0-bath manufactured listed at $225k.
Deal economics
- At list price, monthly cash flow is $313 ($4k/yr) — positive.
- The deal already cash-flows at list — no discount required.
- To meet the 1% rule (rent ≥ 1% of price), the offer needs to be $217k (3.6% below list).
- Recommended offer: $217k (3.6% below list) — sets the bar for 1% rule.
- Cap rate 8.0% vs local median 2.9% in Lorena — top-decile yield for the area; either an underpriced asset or a hidden risk that comps aren't pricing in. Stress-test before assuming the spread holds.
Location & tenants
- Location reads 71/100 on livability (#325 in TX) — a middle-class / working-renter tenant base. Strengths: employment A+, cost of living A+, housing A+; Watch: amenities F, commute F, health & safety F.
- Lorena ISD (rural): math 57% / reading 63% proficiency, ranked #46 of 826 in TX (top 6%) — acceptable for families but not a draw, mixed tenant base, ~2y average lease; only 16% free/reduced lunch — higher-income household profile.
- Zoned schools: Lorena El (math 60% / reading 60%, grade B-, #398 of 4,322 statewide, top 9%, 415 students, 31% FRL) — zoned schools average 31% FRL vs 16% district-wide (15 pts higher); higher-poverty schools than district average — tighter screening recommended.
- Market conditions: 265 active listings in the ZIP; solid renter incomes; 1,014 units permitted in McLennan County in 2024 (200 in 5+ unit buildings).
Forward outlook
- Local home prices are declining (-3.0%/yr); year-one equity from $2k of loan paydown is wiped out by about $7k of value loss. Plan a longer hold.
- McLennan County population projected at +17% by 2050 — long-run rental-demand tailwind backs the buy-and-hold thesis.
Negotiation context
- It's been on market 21 days — a 2% lower offer ($222k) is reasonable based on typical stale-listing flexibility.
Risks & watch-outs
- Climate carrying-cost: moderate flood risk; major wind risk, 70% chance of damaging wind over 30y; moderate wildfire risk; extreme-heat days projected 7→24/yr by 2055 (HVAC capex compounding) — expect insurance premiums to compound above CPI over the hold.
Questions for the listing agent
- Is there a deadline driving the sale (1031 exchange, divorce, estate, relocation)? That informs how much negotiation room exists.
- Schools are B-rated — typically a magnet for longer-tenancy family renters. What's the average tenant stay here, and is there a school-zone premium baked into asking?
- What's the average days-on-market for RENTAL listings here right now (not sales)? A rising rental-DOM trend means longer vacancies and softer asking-rent achievability than the comps imply.
- What's the recent tenant-quality profile in this submarket — average credit score on applications, eviction rate, late-payment / NSF rate, and stable-employment percentage? A property-management company in the area should have these aggregated.
- How much new for-sale + rental construction is in the pipeline within 1–3 miles? Heavy new supply typically softens prices + rents 12–24 months out; constrained supply supports both.
Investment metrics
- 1% rule
- 0.96% ✗
- Cap rate
- 7.96%
- Cash-on-cash
- 5.96%
- DSCR
- 1.26
- GRM
- 8.6
CMA / ARV
No comps found within radius.
Projected returns pro-forma
-3.0% appreciation · 3.0% rent growth · sell at horizon
- IRR
- -7.1%
- Equity multiple
- 0.74×
- Total profit
- $-16,607
- Equity at exit
- $33,548
- IRR
- 2.4%
- Equity multiple
- 1.17×
- Total profit
- $10,932
- Equity at exit
- $19,454
Cash invested: $63,000 (down + closing). Projections, not guarantees.
Landlord ↔ Tenant lean methodology
- Overall (STATE)
- 87 Strongly Landlord-Friendly
- State Texas
- 87 Strongly Landlord-Friendly · R+5
- County
- — inherits STATE
- City
- — inherits STATE
ZIP-level market 76655
- Home prices YoY
- -31.3%
- Active inventory
- 265
- Price-to-rent
- 8.6×
Monthly cashflow live
- Estimated rent
- $2,170 medium interval (Pro) →
- Mortgage (P&I)
- −$1,180
- Tax from tax record
- −$128 /mo · $1,536/yr
- Insurance
- −$94
- HOA
- −$0
- Vacancy / Maint / Mgmt
- −$456
- Net cashflow
- $313
Break-even live
UW: 25.0% down · 7.5% · 30yr · 1.5% tax · 5.0% vac · 8.0% maint · 8.0% mgmt
Financing live
Cash to close
- Down payment
- $56,250
- Closing costs
- $6,750
- Reserves months
- —
- Total cash needed
- —
Loan-product check · same deal, 3 products live
Conventional
25% down · 7.5% · 30yr
- Down + closing
- —
- Monthly P&I
- —
- Monthly cashflow
- —
- DSCR
- —
- Eligible?
- —
Personal DTI + credit; lowest rate.
DSCR
20% down · 8.5% · 30yr
- Down + closing
- —
- Monthly P&I
- —
- Monthly cashflow
- —
- DSCR
- —
- Eligible?
- —
No personal income docs; deal must DSCR.
Hard money
10% down · 12.0% · 12mo
- Down + closing
- —
- Monthly P&I
- —
- Monthly cashflow
- —
- DSCR
- —
- Eligible?
- —
Short-term bridge; refi at stabilization.
Listing history 17 events
-
2026-06-18days on market $225,000 Active 21 DOM
-
2026-06-17days on market $225,000 Active 20 DOM
-
2026-06-16days on market $225,000 Active 19 DOM
-
2026-06-15price $225,000 Active 18 DOM
-
2026-06-15days on market $235,000 Active 18 DOM
-
2026-06-14days on market $235,000 Active 16 DOM
-
2026-06-13days on market $235,000 Active 15 DOM
-
2026-06-10days on market $235,000 Active 13 DOM
-
2026-06-09days on market $235,000 Active 12 DOM
-
2026-06-08days on market $235,000 Active 11 DOM
-
2026-06-07days on market $235,000 Active 10 DOM
-
2026-06-05days on market $235,000 Active 7 DOM
-
2026-06-02days on market $235,000 Active 5 DOM
-
2026-06-01days on market $235,000 Active 4 DOM
-
2026-05-31days on market $235,000 Active 3 DOM
-
2026-05-30days on market $235,000 Active 2 DOM
-
2026-05-28$235,000 Active
ⓘ Source: listings_history table (triggers on properties + properties_extension) + one-shot
backfill from property_details.listing_events for pre-trigger history.
Tax reassessment forecast TX · Resets to sale price
- Current annual tax
- $1,536 · $128/mo
- Projected year-2 tax
- $4,118 · $343/mo
- Expected delta
- +$2,582/yr (+$215/mo · 168.1%)
ⓘ Screening estimate from a state-policy table — verify with the county assessor before closing.
Climate risk First Street
- Flood 5/10 Major FEMA zone X (unshaded) · 67% chance over 30 yrs
- Wildfire 5/10 Major
- Heat 7/10 Severe 7 d/yr ≥109°F today · 24 d/yr by 30 yrs out
- Wind 6/10 Major 70% chance of damaging wind over 30 yrs
- Air quality 1/10 Low 0 unhealthy d/yr today · 0 by 30 yrs out
Nearby sold comps map
Loading sold comps map…
Walkable amenities ~0.75 mi
Loading nearby amenities…
Taxation est. · year 1
- Rental income
- $26,040
- − Mortgage interest
- −$12,603
- − Property taxes
- −$1,536
- − Insurance
- −$1,125
- − Repairs & maintenance
- −$2,083
- − Management
- −$2,083
- − Depreciation
- −$6,545
- Taxable income
- $64
- Est. tax owed @ 24.0%
- −$15
- After-tax cash flow
- $3,737/yr
For passive investors: Depreciation is non-cash, so a rental often shows a tax loss while cash-flowing — sheltering income. Rental losses are passive: they offset passive income freely, and up to $25,000/yr can offset ordinary (W-2) income if you actively participate and your MAGI is under $100k (phasing out to $0 by $150k); unused losses carry forward. On sale, claimed depreciation is recaptured at up to 25%, and gains may owe capital-gains tax (a 1031 exchange can defer both). Figures are a year-1 estimate at your 24.0% rate — not tax advice; consult a CPA.
Schools (NCES district)
- District
- Lorena ISD
- NCES district ID
- 4828200
- Math proficiency
- 57% ▼ -3.00%
- Reading proficiency
- 63% ▲ 2.00%
- Median HH income
- $79,086
- Composite
- 53.84/100
- National rank
- #1412
- State rank
- #46 of 826 in TX
Livability — Lorena
- Score
- 71/100
- State rank
- #325
- US rank
- #7155
Category grades
Schools grade is shown separately in the Schools card above.
Census & demographics
- County
- McLennan County · 213,088 people
- City population
- 10,603
- Metro
- Waco, TX
- Population (ZIP)
- 10,603
- Household income
- $99,917
- Rent vs Own
- Severe rent burden
- 62.0
Population outlook (McLennan County) Hauer SSP2
- Today (2025)
- 264,191 people
- By 2030
- 273,578 · +3.6%
- By 2040
- 291,506 · +10.3%
- By 2050
- 308,044 · +16.6%
- By 2075
- 349,648 · +32.3%
- By 2100
- 364,779 · +38.1%
Race, ethnicity, and origin ACS 2023
- Neighborhood character
- Predominantly White (76%)
- Race & ethnicity
- White 76% Hispanic / Latino 17% Two or more races 12% Black 3%
- Hispanic origin (detail)
- Mexican 14%
- Common ancestry
- Lithuanian 3% Slovak 3% Serbian 2%
- Foreign-born
- 2% · Canada
- Languages at home
- 93% English-only · Spanish 5% Arabic 2%
Political lean MEDSL · McLennan
- 2024 margin
- Solid R (+30.9) · D 34.0% · R 64.9% · Other 1.0%
- 2008→2024 swing
- -7.0pp toward R · 2008: -23.9pp · 2024: -30.9pp
- All cycles
- 2024: R+30.9 2020: R+23.4 2016: R+27.1 2012: R+29.8 2008: R+23.9
Not yet ingested
- Civics
- —
Market trends
- HPI YoY
- ▼ -105.10%
- Current HPI
- 230.4333
- Rent YoY
- —
- Metro
- Waco, TX
- State GDP YoY
- ▲ 3.95%
- F500 in state
- 110
Industry mix (Fortune 500 HQ in TX)
| Industry | F500 HQs | Revenue |
|---|---|---|
| Energy | 16 | $1,198B |
|
||
| Technology | 5 | $198B |
|
||
| Engineering / Construction | 4 | $72B |
|
||
| Energy Services | 3 | $60B |
|
||
| Utilities | 3 | $41B |
|
||
| Healthcare | 2 | $330B |
|
||
Price history
1 event — show timeline
- 2026-05-28 Listed $235,000 NTREIS
Property tax history
-3.1%/yrLatest (2025): $1,536 · +15.2% YoY. Source: county tax records.
Cash-flow waterfall
monthlySold comps — $/sqft
last 12 mo · ≤1 miLoading sold comps…