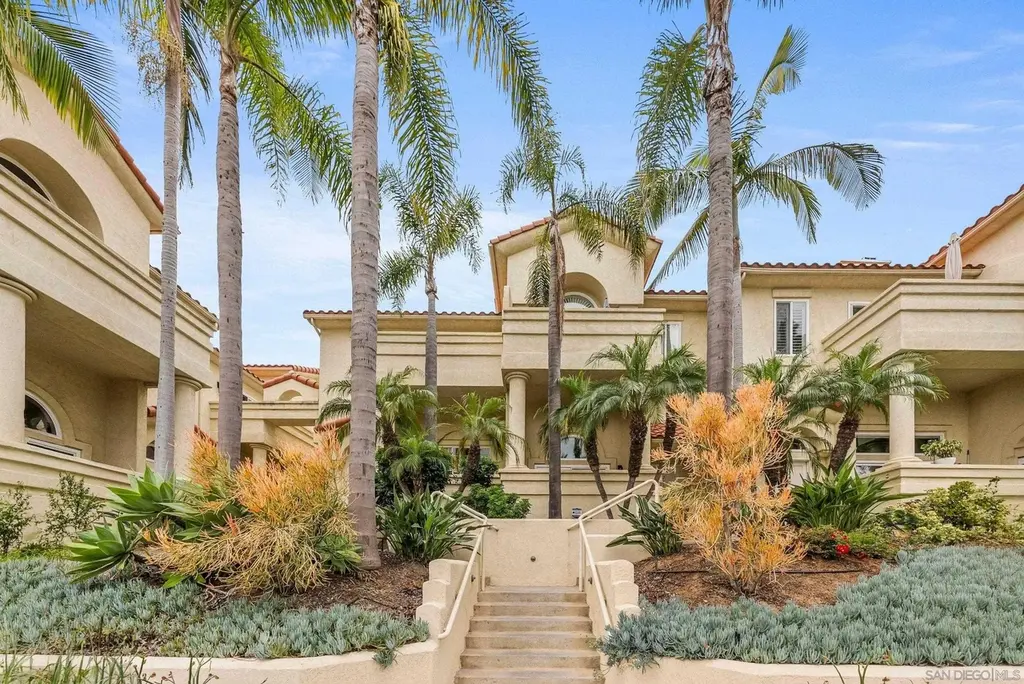
243 S Sierra Ave · Solana Beach, CA
Flood risk 4/10 · Minor
- FEMA flood zone
- X (unshaded)
- Chance of flooding over 30 yrs
- 0.22%
- Est. flood insurance / yr
- $507 – $1,088
Fire risk 1/10 · Minimal
- Est. fire insurance / yr
- $659 – $1,223
Heat risk 4/10 · Minor
- Hot days now (above 83°F)
- 7 days/yr
- Hot days in 30 yrs
- 20 days/yr
Wind risk 1/10 · Minimal
- Chance of severe wind over 30 yrs
- —
Air-quality risk 4/10 · Minor
- Unhealthy air days now
- 4 days/yr
- Unhealthy air days in 30 yrs
- 4 days/yr
Risk factors via First Street. Map © Google.
Why this score? — see what drove the D+ grade
The composite is a weighted blend of 9 inputs, each scored 0–100. Each bar is that input's sub-score; the figure is the points it added to the 100-point composite (weight × sub-score).
- ARV discount +15.0/15.0
- Schools +7.8/10.0
- Appreciation +6.5/10.0
- Cash flow +5.6/30.0
- Rent growth +4.9/5.0
- Livability +3.9/5.0
- Condition / age +2.5/5.0
- 1% rule +0.4/10.0
- DSCR +0.0/10.0
$1,699,900
🖨 Deal sheet 📄 Offer letter ✓ Due diligence
Listing remarks MLS
Steps to the Pacific Ocean from this well maintained Solana Skybluff townhome. It is move-in ready with newly painted walls, and new flooring. There is a 2 car attached garage along with 3 bedrooms and 3 full baths! all of there bedrooms enjoy an attached balcony to enjoy the sun and ocean air. The neighborhood is walkable to some of the best dining and shopping in all of the county. You can also walk to the train station! What a wonderful home to live and play in! Get your surfboard and beach chairs ready!
Key facts
- Updated cabinets
- Private balcony
- Spacious kitchen
Tags
Property features AI
Finance
- Other: Common-interest lot (community ownership), 0.57 acre lot area (community-wide)
- HOA & community: Homeowners association with monthly fee of $325; HOA includes sewer, water, grounds maintenance, and structure maintenance; Association amenities: Storage, Trash
Exterior
- Parking: Attached 2-car garage; 2 total parking spaces
- Security: Fire sprinkler system
- Utilities: Sewer connected
- Home design: Townhouse (townhome); Updated / Remodeled condition; Entry level: 2; 3 total stories
- Construction: Stucco construction
- Exterior features: Balcony; Covered patio; Deck; Enclosed patio; Patio; Partial fencing
Interior
- Kitchen: Dishwasher; Disposal; Microwave; Refrigerator; Freezer; Gas oven; Gas range / cooktop; Range; Oven; Warming drawer; Tankless water heater
- Bedrooms: Possible 3 bedrooms
- Flooring: Tile; Vinyl
- Bathrooms: 3 full bathrooms
- Heating & cooling: Forced air heating; Natural gas heating; Fireplace heating
- Interior features: Ceiling fans; Storage; Living room fireplace (1)
- Laundry & utility: Washer hookup; Washer; Dryer
Neighborhood map
What this means for you Summary
Snapshot
- This is a 3-bed/3.0-bath townhouse listed at $1.70M.
Deal economics
- At list price, monthly cash flow is $-4k ($-43k/yr) — negative.
- To cash-flow at today's rent, offer at most $1.07M (37.1% below list).
- To meet the 1% rule (rent ≥ 1% of price), the offer needs to be $910k (46.5% below list).
- Recommended offer: $910k (46.5% below list) — sets the bar for 1% rule.
- Cap rate 3.8% vs local median 1.6% in Solana Beach — top-decile yield for the area; either an underpriced asset or a hidden risk that comps aren't pricing in. Stress-test before assuming the spread holds.
Location & tenants
- Location reads 77/100 on livability (#81 in CA, #3,100 nationally) — a middle-class / working-renter tenant base. Strengths: schools A+, crime A+, commute A+; Watch: amenities D+, health & safety D, cost of living F.
- Solana Beach Elementary (urban): math 82% / reading 86% proficiency, ranked #23 of 1,400 in CA (top 2%) — strong family-tenant draw, lease renewals of 3-5y typical; only 6% free/reduced lunch — higher-income household profile.
- Market conditions: Rents rising fast (+9.7%/yr); 67 active listings in the ZIP; 27 comparable units currently listed for rent nearby; rentals leasing fast (median 2d on market — plan ~1-2 weeks tenant-placement turnaround); high-income renter base; 11,759 units permitted in San Diego County in 2024 (7,244 in 5+ unit buildings).
- At $9,103/mo this rent would consume 73% of the median local household income ($149k/yr) (locally 543% of renters already pay >50% of income on rent) — very limited rent-growth headroom before tenants either downsize or default.
Forward outlook
- In year one you build about $63k of equity ($12k loan paydown + $51k appreciation (3.0% local appreciation)).
- San Diego County population projected at +20% by 2050 — long-run rental-demand tailwind backs the buy-and-hold thesis.
- By year 2, paydown + projected appreciation supports a ~$102k cash-out refi (75% LTV) — recoverable capital for the next deal without selling this one.
Negotiation context
- It's been on market 18 days — a 2% lower offer ($1.67M) is reasonable based on typical stale-listing flexibility.
- 8 sale attempts since 29y ago with the ask held roughly flat each time — persistent listings suggest the price (not the market) is what's stuck; bring a comps-based counter.
Questions for the listing agent
- What do current leases actually rent for vs. the listed asking? Can we see a recent rent roll and the last 12 months of T-12 income?
- What does the HOA fee cover, when was the last increase, and are there any pending special assessments or reserve-fund shortfalls?
- Is there a deadline driving the sale (1031 exchange, divorce, estate, relocation)? That informs how much negotiation room exists.
- Schools are A-rated — typically a magnet for longer-tenancy family renters. What's the average tenant stay here, and is there a school-zone premium baked into asking?
- The area grade is low — what's the realistic commute time and amenity access for the typical tenant pool here? Any planned neighborhood developments (good or bad) we should know about?
- What's the average days-on-market for RENTAL listings here right now (not sales)? A rising rental-DOM trend means longer vacancies and softer asking-rent achievability than the comps imply.
- What's the recent tenant-quality profile in this submarket — average credit score on applications, eviction rate, late-payment / NSF rate, and stable-employment percentage? A property-management company in the area should have these aggregated.
- How much new for-sale + rental construction is in the pipeline within 1–3 miles? Heavy new supply typically softens prices + rents 12–24 months out; constrained supply supports both.
Investment metrics
- 1% rule
- 0.54% ✗
- Cap rate
- 3.77%
- Cash-on-cash
- -9.00%
- DSCR
- 0.60
- GRM
- 15.6
CMA / ARV
- ARV (on-the-fly)
- $2,169,990
- Comps found
- 12
Show comp detail 12 sales within ~0.75 mi
| Address | Dist | Beds/Ba | Sqft | Sold | Price | $/sf | Match |
|---|---|---|---|---|---|---|---|
| 241 S Sierra Ave | 0.00mi | 3/3.0 | 1,710 (0%) | 4mo | $1,700,000 | $994 | 97 |
| 211 S Helix #53 | 0.09mi | 2/2.5 (-1) | 1,833 (+7%) | 1mo | $3,100,000 | $1,691 | 76 |
| 205 S Helix Ave #61 | 0.10mi | 3/3.0 | 1,936 (+13%) | 3mo | $4,900,000 | $2,531 | 71 |
| 503 S Sierra #162 | 0.26mi | 3/3.0 | 1,608 (-6%) | 10mo | $1,585,000 | $986 | 70 |
| 515 S Sierra Ave | 0.25mi | 3/2.5 | 1,586 (-7%) | 7mo | $1,900,000 | $1,198 | 69 |
| 135 S Sierra Ave #6 | 0.14mi | 2/2.0 (-1) | 1,852 (+8%) | 3mo | $2,350,000 | $1,269 | 68 |
| 135 S Sierra Ave #33 | 0.14mi | 2/2.5 (-1) | 1,842 (+8%) | 8mo | $3,090,000 | $1,678 | 67 |
| 135 S Sierra Ave #23 | 0.14mi | 2/2.5 (-1) | 1,842 (+8%) | 10mo | $2,300,000 | $1,249 | 65 |
| 515 S Sierra Ave #124 | 0.25mi | 2/2.5 (-1) | 1,519 (-11%) | 8mo | $2,532,000 | $1,667 | 56 |
| 573 S Sierra Ave #10 | 0.32mi | 2/2.5 (-1) | 1,519 (-11%) | 9mo | $1,337,000 | $880 | 52 |
| 597 S Sierra Ave #67 | 0.36mi | 2/2.5 (-1) | 1,540 (-10%) | 10mo | $2,310,000 | $1,500 | 51 |
| 142 N Shore Dr | 0.52mi | 2/2.5 (-1) | 1,564 (-8%) | 14mo | $1,500,000 | $959 | 43 |
Match score weights: distance 35% · size 25% · config 20% · recency 20%. Top-matched comps best support the ARV.
Projected returns pro-forma
2.99% appreciation · 8.0% rent growth · sell at horizon
- IRR
- 0.9%
- Equity multiple
- 1.05×
- Total profit
- $23,777
- Equity at exit
- $763,077
- IRR
- 6.4%
- Equity multiple
- 2.04×
- Total profit
- $494,091
- Equity at exit
- $1,175,004
Cash invested: $475,972 (down + closing). Projections, not guarantees.
Landlord ↔ Tenant lean methodology
- Overall (STATE)
- 18 Strongly Tenant-Friendly
- State California
- 18 Strongly Tenant-Friendly · D+13
- County
- — inherits STATE
- City
- — inherits STATE
ZIP-level market 92075
- Home prices YoY
- 0.6%
- Rents YoY
- 9.7%
- Active inventory
- 67
- Price-to-rent
- 15.6×
Monthly cashflow live
- Estimated rent
- $9,103 high interval (Pro) →
- Mortgage (P&I)
- −$8,914
- Tax from tax record
- −$814 /mo · $9,774/yr
- Insurance
- −$708
- HOA
- −$325
- Vacancy / Maint / Mgmt
- −$1,912
- Net cashflow
- $-3,571
Break-even live
UW: 25.0% down · 7.5% · 30yr · 1.5% tax · 5.0% vac · 8.0% maint · 8.0% mgmt
Financing live
Cash to close
- Down payment
- $424,975
- Closing costs
- $50,997
- Reserves months
- —
- Total cash needed
- —
Loan-product check · same deal, 3 products live
Conventional
25% down · 7.5% · 30yr
- Down + closing
- —
- Monthly P&I
- —
- Monthly cashflow
- —
- DSCR
- —
- Eligible?
- —
Personal DTI + credit; lowest rate.
DSCR
20% down · 8.5% · 30yr
- Down + closing
- —
- Monthly P&I
- —
- Monthly cashflow
- —
- DSCR
- —
- Eligible?
- —
No personal income docs; deal must DSCR.
Hard money
10% down · 12.0% · 12mo
- Down + closing
- —
- Monthly P&I
- —
- Monthly cashflow
- —
- DSCR
- —
- Eligible?
- —
Short-term bridge; refi at stabilization.
Rent comps 27 comps
| Address | Beds | Baths | Sqft | Rent | $/sqft | DOM | Units | Dist |
|---|---|---|---|---|---|---|---|---|
| 241 S Sierra Ave Solana Beach, CA | 3.0 | 3.0 | 1710 | $7,500 | $4.39 | 1d | 1 | 0.03mi |
| 233 S Helix Ave Unit K Solana Beach, CA | 2.0 | 2.0 | 1425 | $15,000 | $10.53 | 1d | 1 | 0.04mi |
| 239 S Helix Ave #25 Solana Beach, CA | 2.0 | 2.0 | 1425 | $13,000 | $9.12 | 1d | 1 | 0.06mi |
| 135 S Sierra Ave Solana Beach, CA | 2.0 | 2.5 | 1896 | $10,974 | $5.79 | 1d | 3 | 0.11mi |
| 135 S Sierra Ave #32 Solana Beach, CA | 2.0 | 2.5 | 1850 | $15,999 | $8.65 | 24d | 1 | 0.12mi |
| 120 Dahlia Dr Solana Beach, CA | 1.0–2.0 | 1.0–2.0 | 976 | $7,500 | $7.68 | 1d | 2 | 0.14mi |
| 429 S Sierra Ave #331 Solana Beach, CA | 2.0 | 2.5 | 1422 | $12,500 | $8.79 | 10d | 1 | 0.15mi |
| 429 S Sierra Ave Solana Beach, CA | 2.0 | 2.0–2.5 | 1294 | $10,650 | $8.23 | 1d | 2 | 0.15mi |
| 509 S Sierra Ave Unit 1 Solana Beach, CA | 2.0 | 2.5 | 1606 | $6,800 | $4.23 | 1d | 1 | 0.27mi |
| 521 S Sierra Ave #166 Solana Beach, CA | 2.0 | 2.5 | 1608 | $9,500 | $5.91 | 1d | 1 | 0.28mi |
| 675 S Sierra Ave #29 Solana Beach, CA | 2.0 | 2.5 | 1210 | $5,990 | $4.95 | 1d | 1 | 0.40mi |
| 341 N Sierra Ave Solana Beach, CA | 3.0 | 2.0 | 1676 | $7,200 | $4.30 | 1d | 1 | 0.46mi |
| 420 Bell Ranch Rd Solana Beach, CA | 3.0 | 2.0 | 2067 | $11,500 | $5.56 | 1d | 1 | 0.52mi |
| 806 S Sierra Ave Solana Beach, CA | 3.0 | 2.0 | 1382 | $5,950 | $4.31 | 16d | 1 | 0.57mi |
| 880 S Sierra Ave Solana Beach, CA | 3.0 | 3.0 | 1382 | $6,500 | $4.70 | 2d | 1 | 0.57mi |
| 806 S Sierra Ave Unit 1 Solana Beach, CA | 3.0 | 2.5 | 1382 | $5,950 | $4.31 | 21d | 1 | 0.57mi |
| 152 S Shore Dr Solana Beach, CA | 2.0 | 2.0 | 1210 | $5,400 | $4.46 | 1d | 1 | 0.59mi |
| 823 Sea Turf Cir Solana Beach, CA | 2.0 | 2.0 | 1218 | $4,995 | $4.10 | 3d | 1 | 0.70mi |
| 328 Shoemaker Ct Solana Beach, CA | 3.0 | 2.5 | 1675 | $10,500 | $6.27 | 1d | 1 | 0.71mi |
| 701 S Nardo Ave Solana Beach, CA | 1.0–2.0 | 1.0–2.0 | 963 | $7,620 | $7.91 | 1d | 23 | 0.72mi |
| 608 N Rios Ave Solana Beach, CA | 3.0 | 2.0 | 1900 | $7,995 | $4.21 | 1d | 1 | 0.75mi |
| 851 Del Mar Downs Rd Unit E Solana Beach, CA | 2.0 | 1.5 | 1116 | $4,700 | $4.21 | 7d | 1 | 0.82mi |
| 873 Stevens Ave Solana Beach, CA | 2.0 | 1.0–2.0 | 945 | $3,180 | $3.37 | 1d | 1 | 0.92mi |
| 2929 Sandy Pointe #19 Del Mar, CA | 2.0 | 2.5 | 1583 | $9,500 | $6.00 | 7d | 1 | 1.15mi |
| 930 Via Mil Cumbres Solana Beach, CA | 2.0 | 2.0 | 1263 | $3,595 | $2.85 | 19d | 1 | 1.21mi |
| 930 Via Mil Cumbres #185 Solana Beach, CA | 2.0 | 2.0 | 1300 | $3,995 | $3.07 | 1d | 1 | 1.26mi |
| 2435 Camino del Mar Del Mar, CA | 4.0 | 3.0 | 1464 | $10,900 | $7.45 | 1d | 1 | 1.37mi |
HOA detail
- Monthly dues
- $325 · $3,900/yr
Listing history 31 events
-
2026-06-07status $1,699,900 Pending 18 DOM
-
2026-06-04days on market $1,699,900 Active 18 DOM
-
2026-06-03days on market $1,699,900 Active 17 DOM
-
2026-06-02days on market $1,699,900 Active 16 DOM
-
2026-06-01days on market $1,699,900 Active 15 DOM
-
2026-05-31days on market $1,699,900 Active 14 DOM
-
2026-05-17$1,699,900 Active
-
2025-01-17soldstatus $1,650,000 Closed Sale 517-char remark
Show marketing remark (517 chars)
Steps to the Pacific Ocean from this well maintained Solana Skybluff townhome. It is move-in ready with newly painted walls, and new flooring. There is a 2 car attached garage along with 3 bedrooms and 3 full baths! all of there bedrooms enjoy an attached balcony to enjoy the sun and ocean air. The neighborhood is walkable to some of the best dining and shopping in all of the county. You can also walk to the train station! What a wonderful home to live and play in! Get your surfboard and beach chairs ready!
-
2025-01-17soldstatus $1,650,000
Show marketing remark (517 chars)
Steps to the Pacific Ocean from this well maintained Solana Skybluff townhome. It is move-in ready with newly painted walls, and new flooring. There is a 2 car attached garage along with 3 bedrooms and 3 full baths! all of there bedrooms enjoy an attached balcony to enjoy the sun and ocean air. The neighborhood is walkable to some of the best dining and shopping in all of the county. You can also walk to the train station! What a wonderful home to live and play in! Get your surfboard and beach chairs ready!
-
2024-12-30historical Active Under Contract 517-char remark
Show marketing remark (517 chars)
Steps to the Pacific Ocean from this well maintained Solana Skybluff townhome. It is move-in ready with newly painted walls, and new flooring. There is a 2 car attached garage along with 3 bedrooms and 3 full baths! all of there bedrooms enjoy an attached balcony to enjoy the sun and ocean air. The neighborhood is walkable to some of the best dining and shopping in all of the county. You can also walk to the train station! What a wonderful home to live and play in! Get your surfboard and beach chairs ready!
-
2024-11-20$1,800,000 Active 517-char remark
Show marketing remark (517 chars)
Steps to the Pacific Ocean from this well maintained Solana Skybluff townhome. It is move-in ready with newly painted walls, and new flooring. There is a 2 car attached garage along with 3 bedrooms and 3 full baths! all of there bedrooms enjoy an attached balcony to enjoy the sun and ocean air. The neighborhood is walkable to some of the best dining and shopping in all of the county. You can also walk to the train station! What a wonderful home to live and play in! Get your surfboard and beach chairs ready!
-
2024-11-17historical $6,000
-
2024-11-15historical $1,800,000 517-char remark
Show marketing remark (517 chars)
Steps to the Pacific Ocean from this well maintained Solana Skybluff townhome. It is move-in ready with newly painted walls, and new flooring. There is a 2 car attached garage along with 3 bedrooms and 3 full baths! all of there bedrooms enjoy an attached balcony to enjoy the sun and ocean air. The neighborhood is walkable to some of the best dining and shopping in all of the county. You can also walk to the train station! What a wonderful home to live and play in! Get your surfboard and beach chairs ready!
-
2024-10-20price $6,000
-
2024-10-09$6,300
-
2024-09-21historical $6,900
-
2024-07-25price $6,900
-
2024-06-18price $7,000
-
2024-05-23$7,400
-
2006-04-17soldstatus $745,000 312-char remark
Show marketing remark (312 chars)
LEAST EXPENSIVE COASTAL 3Bd/3Ba in S. B. Over 1700 sq. ft, 2 Master Suites, Attached 2 Car Garage, 4 private Balconies, New Paint/Carpet. Lowest HOA in S. B Only $125/mo. End Unit, Tons of light, multiple Beach Aceess points, Walk to Cedros, Train, Farmers Market, Restaurants. Incredible OPP!Rental or End User.
-
2006-04-17soldstatus $745,000
Show marketing remark (312 chars)
LEAST EXPENSIVE COASTAL 3Bd/3Ba in S. B. Over 1700 sq. ft, 2 Master Suites, Attached 2 Car Garage, 4 private Balconies, New Paint/Carpet. Lowest HOA in S. B Only $125/mo. End Unit, Tons of light, multiple Beach Aceess points, Walk to Cedros, Train, Farmers Market, Restaurants. Incredible OPP!Rental or End User.
-
2006-03-09$769,000 312-char remark
Show marketing remark (312 chars)
LEAST EXPENSIVE COASTAL 3Bd/3Ba in S. B. Over 1700 sq. ft, 2 Master Suites, Attached 2 Car Garage, 4 private Balconies, New Paint/Carpet. Lowest HOA in S. B Only $125/mo. End Unit, Tons of light, multiple Beach Aceess points, Walk to Cedros, Train, Farmers Market, Restaurants. Incredible OPP!Rental or End User.
-
2006-03-08historical
-
2006-03-08historical
-
2005-10-17$769,000
-
2005-10-17$769,000
-
2000-05-01soldstatus $369,000
-
1999-05-17soldstatus $319,000
-
1997-08-07soldstatus $223,000
-
1997-08-07soldstatus $228,000
-
1997-06-25$229,900
ⓘ Source: listings_history table (triggers on properties + properties_extension) + one-shot
backfill from property_details.listing_events for pre-trigger history.
Tax reassessment forecast CA · Resets to sale price
- Current annual tax
- $9,774 · $814/mo
- Projected year-2 tax
- $12,919 · $1,077/mo
- Expected delta
- +$3,145/yr (+$262/mo · 32.2%)
ⓘ Screening estimate from a state-policy table — verify with the county assessor before closing.
Climate risk First Street
- Flood 4/10 Moderate FEMA zone X (unshaded) · 22% chance over 30 yrs
- Wildfire 1/10 Low
- Heat 4/10 Moderate 7 d/yr ≥83°F today · 20 d/yr by 30 yrs out
- Wind 1/10 Low
- Air quality 4/10 Moderate 4 unhealthy d/yr today · 4 by 30 yrs out
Nearby sold comps map
Loading sold comps map…
Walkable amenities ~0.75 mi
Loading nearby amenities…
Taxation est. · year 1
- Rental income
- $109,233
- − Mortgage interest
- −$95,221
- − Property taxes
- −$9,774
- − Insurance
- −$8,500
- − Repairs & maintenance
- −$8,739
- − Management
- −$8,739
- − HOA
- −$3,900
- − Depreciation
- −$49,452
- Taxable loss
- −$75,090
- Est. tax savings @ 24.0%
- +$18,022
- After-tax cash flow
- $-24,831/yr
For passive investors: Depreciation is non-cash, so a rental often shows a tax loss while cash-flowing — sheltering income. Rental losses are passive: they offset passive income freely, and up to $25,000/yr can offset ordinary (W-2) income if you actively participate and your MAGI is under $100k (phasing out to $0 by $150k); unused losses carry forward. On sale, claimed depreciation is recaptured at up to 25%, and gains may owe capital-gains tax (a 1031 exchange can defer both). Figures are a year-1 estimate at your 24.0% rate — not tax advice; consult a CPA.
Schools (NCES district)
- District
- Solana Beach Elementary
- NCES district ID
- 0636990
- Math proficiency
- 82% ▲ 1.00%
- Reading proficiency
- 86% ▲ 1.00%
- Median HH income
- $113,696
- Composite
- 77.67/100
- National rank
- #152
- State rank
- #23 of 1400 in CA
Livability — Solana Beach
- Score
- 77/100
- State rank
- #81
- US rank
- #3100
Category grades
Schools grade is shown separately in the Schools card above.
Census & demographics
- Census place
- Solana Beach, CA
- County
- San Diego County · 3,178,799 people
- City population
- 11,944
- Metro
- San Diego-Chula Vista-Carlsbad, CA
- Population (ZIP)
- 11,944
- Household income
- $149,327
- Rent vs Own
- Severe rent burden
- 543.0
Population outlook (San Diego County) Hauer SSP2
- Today (2025)
- 3,678,185 people
- By 2030
- 3,856,546 · +4.8%
- By 2040
- 4,171,407 · +13.4%
- By 2050
- 4,421,607 · +20.2%
- By 2075
- 4,831,599 · +31.4%
- By 2100
- 4,832,502 · +31.4%
Race, ethnicity, and origin ACS 2023
- Neighborhood character
- Predominantly White (74%)
- Race & ethnicity
- White 74% Hispanic / Latino 12% Two or more races 10% Asian 5%
- Hispanic origin (detail)
- Mexican 8%
- Common ancestry
- Italian 5% Slovak 4% Portuguese 3%
- Foreign-born
- 12% · Canada, China, South Korea
- Languages at home
- 83% English-only · Spanish 10% Other Indo-European 3% French/Haitian/Cajun 1%
Political lean MEDSL · San Diego
- 2024 margin
- D (+16.8) · D 56.9% · R 40.1% · Other 2.9%
- 2008→2024 swing
- +6.6pp toward D · 2008: 10.2pp · 2024: 16.8pp
- All cycles
- 2024: D+16.8 2020: D+22.8 2016: D+17.8 2012: D+5.1 2008: D+10.2
Not yet ingested
- Civics
- —
Market trends
- HPI YoY
- ▲ 2.99%
- Current HPI
- 470.0274
- Rent YoY
- ▲ 9.71%
- Metro
- San Diego-Chula Vista-Carlsbad, CA
- State GDP YoY
- ▲ 3.21%
- F500 in state
- 116
Industry mix (Fortune 500 HQ in CA)
| Industry | F500 HQs | Revenue |
|---|---|---|
| Technology | 27 | $1,492B |
|
||
| Financial Services | 3 | $174B |
|
||
| Retail | 3 | $44B |
|
||
| Insurance | 3 | $26B |
|
||
| Media / Entertainment | 2 | $115B |
|
||
| Pharmaceuticals / Biotech | 2 | $62B |
|
||
Price history
+639.4% since first listed25 events — show timeline
- 2026-05-17 Listed $1,699,900 SDMLS
- 2025-01-17 Sold (Public Records) $1,650,000 Public Records
- 2025-01-17 Sold (MLS) $1,650,000 CRMLS
- 2024-12-30 Contingent — CRMLS
- 2024-11-20 Listed $1,800,000 CRMLS
- 2024-11-17 Rental Removed $6,000 CRMLS
- 2024-11-15 Coming Soon $1,800,000 CRMLS
- 2024-10-20 Price Changed $6,000 CRMLS
- 2024-10-09 Listed for Rent $6,300 CRMLS
- 2024-09-21 Rental Removed $6,900 CRMLS
- 2024-07-25 Price Changed $6,900 CRMLS
- 2024-06-18 Price Changed $7,000 CRMLS
- 2024-05-23 Listed for Rent $7,400 CRMLS
- 2006-04-17 Sold (Public Records) $745,000 Public Records
- 2006-04-17 Sold (MLS) $745,000 CRMLS
- 2006-03-09 Listed $769,000 CRMLS
- 2006-03-08 Listing Removed — SDMLS
- 2006-03-08 Listing Removed — CRMLS
- 2005-10-17 Listed $769,000 SDMLS
- 2005-10-17 Listed $769,000 CRMLS
- 2000-05-01 Sold (Public Records) $369,000 Public Records
- 1999-05-17 Sold (Public Records) $319,000 Public Records
- 1997-08-07 Sold (Public Records) $228,000 Public Records
- 1997-08-07 Sold (MLS) $223,000 CRMLS
- 1997-06-25 Listed $229,900 CRMLS
Property tax history
+0.9%/yrLatest (2025): $9,774 · -13.4% YoY. Source: county tax records.
Cash-flow waterfall
monthlySold comps — $/sqft
last 12 mo · ≤1 miLoading sold comps…