1128 W Court Plz · Anson, TX
Flood risk 1/10 · Minimal
- FEMA flood zone
- X (unshaded)
- Chance of flooding over 30 yrs
- 0.0%
- Est. flood insurance / yr
- $507 – $1,088
Fire risk 8/10 · Major
- Est. fire insurance / yr
- $1,222 – $2,270
Heat risk 7/10 · Major
- Hot days now (above 106°F)
- 6 days/yr
- Hot days in 30 yrs
- 19 days/yr
Wind risk 4/10 · Minor
- Chance of severe wind over 30 yrs
- 9.0%
Air-quality risk 1/10 · Minimal
- Unhealthy air days now
- 0 days/yr
- Unhealthy air days in 30 yrs
- 0 days/yr
Risk factors via First Street. Map © Google.
Why this score? — see what drove the D grade
The composite is a weighted blend of 9 inputs, each scored 0–100. Each bar is that input's sub-score; the figure is the points it added to the 100-point composite (weight × sub-score).
- Cash flow +12.0/30.0
- ARV discount +7.5/15.0
- Appreciation +7.1/10.0
- DSCR +3.5/10.0
- Livability +3.5/5.0
- Schools +2.8/10.0
- 1% rule +2.7/10.0
- Rent growth +2.5/5.0
- Condition / age +2.5/5.0
$375,000
🖨 Deal sheet (PDF) 📄 Offer letter ✓ Due diligence
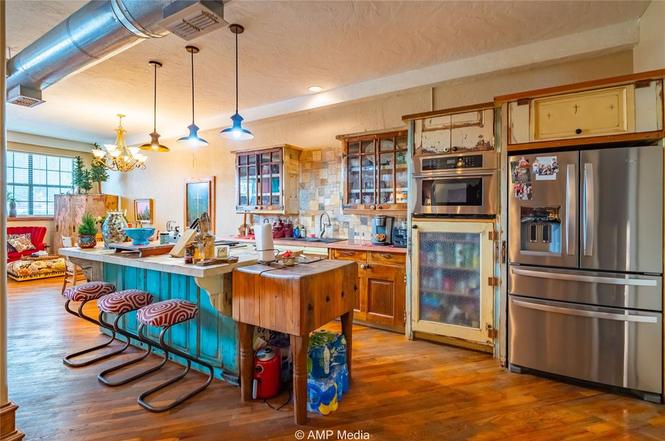
Listing remarks
Introducing a truly one-of-a-kind property that blends exceptional craftsmanship with a unique architectural style. This stunning 4,800-square-foot home, nestled in the heart of Jones County, offers an unparalleled living experience. Boasting two impeccably designed stories, this property features not one, but two fully equipped kitchens, allowing for versatile living arrangements that can cater to a variety of lifestyles. The layout enhances the property’s flexibility, allowing you to configure it into multiple bedrooms, making it ideal for multi-generational living or hosting guests. Step outside and discover the remarkable rooftop patio, where you can bask in the best views the cou
Key facts
- Rooftop patio
- Additional apartment
- Outdoor shower
Tags
Neighborhood map
What this means for you Summary
Snapshot
- This is a 3-bed/3.0-bath single-family listed at $375k.
Deal economics
- At list price, monthly cash flow is $-90 ($-1k/yr) — negative.
- To cash-flow at today's rent, offer at most $359k (4.2% below list).
- To meet the 1% rule (rent ≥ 1% of price), the offer needs to be $290k (22.7% below list).
- Recommended offer: $290k (22.7% below list) — sets the bar for 1% rule.
- Cap rate 6.0% vs local median 12.2% in Anson — below-typical yield; the buyer is paying a premium for something (appreciation thesis, condition, location) that the cap rate doesn't capture.
Location & tenants
- Location reads 70/100 on livability (#377 in TX) — a middle-class / working-renter tenant base. Strengths: crime A+, cost of living A+, housing A-; Watch: health & safety C-, employment D, amenities F.
- Anson ISD (rural): math 29% / reading 37% proficiency, ranked #565 of 826 in TX (top 68%) — families likely to look elsewhere, expect single-tenant / working-renter base with shorter leases.
- Zoned schools: Anson El (math 17% / reading 32%, grade F, #3,052 of 4,322 statewide, top 74%, 368 students, 68% FRL); Anson Middle (math 37% / reading 37%, grade F, #756 of 1,662 statewide, top 47%, 167 students, 65% FRL); Anson H S (math 47% / reading 44%, grade D-, #630 of 1,632 statewide, top 39%, 217 students, 51% FRL).
- Market conditions: 73 active listings in the ZIP; 1 units permitted in Jones County in 2024 (0 in 5+ unit buildings).
Forward outlook
- In year one you build about $18k of equity ($3k loan paydown + $15k appreciation (4.1% local appreciation)).
- Jones County population projected at +13% by 2050 — modest demand growth; plan on rents tracking national, not racing it.
- By year 3, paydown + projected appreciation supports a ~$45k cash-out refi (75% LTV) — recoverable capital for the next deal without selling this one.
Negotiation context
- It's been on market 195 days — a 12% lower offer ($330k) is reasonable based on typical stale-listing flexibility.
- 4 sale attempts since 2y ago with the ask held roughly flat each time — persistent listings suggest the price (not the market) is what's stuck; bring a comps-based counter.
Risks & watch-outs
- Watch-outs: built in 1910 — expect roof / HVAC / electrical / plumbing capex.
- Climate carrying-cost: severe wildfire risk; extreme-heat days projected 6→19/yr by 2055 (HVAC capex compounding) — expect insurance premiums to compound above CPI over the hold.
Questions for the listing agent
- What do current leases actually rent for vs. the listed asking? Can we see a recent rent roll and the last 12 months of T-12 income?
- It's been on market 195 days. Have you received any prior offers? Is the seller open to a 23% concession, seller financing, or rate buy-down credit?
- Built in 1910 — when were the roof, HVAC, electrical panel, plumbing, and water heater last replaced?
- Why hasn't it sold? Are there any deal-killer items the seller is aware of (foundation, flood, title, zoning, code violations)?
- Is there a deadline driving the sale (1031 exchange, divorce, estate, relocation)? That informs how much negotiation room exists.
- Schools are D-rated, which usually means shorter tenancies and higher turnover. Who's the typical renter profile here, and what's been the actual vacancy rate?
- The area grade is low — what's the realistic commute time and amenity access for the typical tenant pool here? Any planned neighborhood developments (good or bad) we should know about?
- What's the average days-on-market for RENTAL listings here right now (not sales)? A rising rental-DOM trend means longer vacancies and softer asking-rent achievability than the comps imply.
- What's the recent tenant-quality profile in this submarket — average credit score on applications, eviction rate, late-payment / NSF rate, and stable-employment percentage? A property-management company in the area should have these aggregated.
- How much new for-sale + rental construction is in the pipeline within 1–3 miles? Heavy new supply typically softens prices + rents 12–24 months out; constrained supply supports both.
Investment metrics
- 1% rule
- 0.77% ✗
- Cap rate
- 6.00%
- Cash-on-cash
- -1.03%
- DSCR
- 0.95
- GRM
- 10.8
CMA / ARV
- ARV (on-the-fly)
- $232,800
- Comps found
- 4
Show comp detail 4 sales within ~0.75 mi
| Address | Dist | Beds/Ba | Sqft | Sold | Price | $/sf | Match |
|---|---|---|---|---|---|---|---|
| 1502 11th St | 0.29mi | 4/3.0 (+1) | 2,280 (-5%) | 1mo | $235,000 | $103 | 72 |
| 1401 Avenue Ave N | 0.28mi | 3/1.5 | 2,339 (-2%) | 12mo | $127,500 | $55 | 67 |
| 202 Ave I | 0.69mi | 4/2.0 (+1) | 2,128 (-11%) | 5mo | $75,000 | $35 | 36 |
| 621 Avenue Q | 0.56mi | 4/2.0 (+1) | 2,050 (-15%) | 23mo | $199,000 | $97 | 22 |
Match score weights: distance 35% · size 25% · config 20% · recency 20%. Top-matched comps best support the ARV.
Projected returns pro-forma
4.13% appreciation · 3.0% rent growth · sell at horizon
- IRR
- 9.7%
- Equity multiple
- 1.59×
- Total profit
- $62,287
- Equity at exit
- $193,016
- IRR
- 11.5%
- Equity multiple
- 2.93×
- Total profit
- $202,735
- Equity at exit
- $318,018
Cash invested: $105,000 (down + closing). Projections, not guarantees.
Landlord ↔ Tenant lean methodology
- Overall (STATE)
- 87 Strongly Landlord-Friendly
- State Texas
- 87 Strongly Landlord-Friendly · R+5
- County
- — inherits STATE
- City
- — inherits STATE
ZIP-level market 79501
- Home prices YoY
- 2.9%
- Active inventory
- 73
- Price-to-rent
- 10.8×
Monthly cashflow live
- Estimated rent
- $2,897 medium interval (Pro) →
- Mortgage (P&I)
- −$1,967
- Tax from tax record
- −$256 /mo · $3,070/yr
- Insurance
- −$156
- HOA
- −$0
- Vacancy / Maint / Mgmt
- −$608
- Net cashflow
- $-90
Break-even live
Sensitivity live
| Price | -10% $122 | -5% $16 | +0% $-90 | +5% $-196 | +10% $-302 |
|---|---|---|---|---|---|
| Rent | -10% $-319 | -5% $-204 | +0% $-90 | +5% $24 | +10% $139 |
| Rate | -1.0pp $99 | -0.5pp $5 | base $-90 | +0.5pp $-187 | +1.0pp $-286 |
UW: 25.0% down · 7.5% · 30yr · 1.5% tax · 5.0% vac · 8.0% maint · 8.0% mgmt
Financing live
Cash to close
- Down payment
- $93,750
- Closing costs
- $11,250
- Reserves months
- —
- Total cash needed
- —
Loan-product check · same deal, 3 products live
Conventional
25% down · 7.5% · 30yr
- Down + closing
- —
- Monthly P&I
- —
- Monthly cashflow
- —
- DSCR
- —
- Eligible?
- —
Personal DTI + credit; lowest rate.
DSCR
20% down · 8.5% · 30yr
- Down + closing
- —
- Monthly P&I
- —
- Monthly cashflow
- —
- DSCR
- —
- Eligible?
- —
No personal income docs; deal must DSCR.
Hard money
10% down · 12.0% · 12mo
- Down + closing
- —
- Monthly P&I
- —
- Monthly cashflow
- —
- DSCR
- —
- Eligible?
- —
Short-term bridge; refi at stabilization.
Listing history 12 events
-
2026-02-17status Pending
-
2025-08-06$375,000 Active
-
2025-07-31historical
-
2025-03-20status Active
-
2024-12-02$375,000 Active
-
2024-11-22historical
-
2024-10-04price $375,000
-
2024-07-22price $395,000
-
2024-06-10$435,000 Active
-
2002-10-28soldstatus
-
2001-08-21soldstatus
-
1990-03-11soldstatus
ⓘ Source: listings_history table (triggers on properties + properties_extension) + one-shot
backfill from property_details.listing_events for pre-trigger history.
Tax reassessment forecast TX · Resets to sale price
- Current annual tax
- $3,070 · $256/mo
- Projected year-2 tax
- $6,862 · $572/mo
- Expected delta
- +$3,793/yr (+$316/mo · 123.5%)
ⓘ Screening estimate from a state-policy table — verify with the county assessor before closing.
Climate risk First Street
- Flood 1/10 Low FEMA zone X (unshaded) · 0% chance over 30 yrs
- Wildfire 8/10 Severe
- Heat 7/10 Severe 6 d/yr ≥106°F today · 19 d/yr by 30 yrs out
- Wind 4/10 Moderate 9% chance of damaging wind over 30 yrs
- Air quality 1/10 Low 0 unhealthy d/yr today · 0 by 30 yrs out
Nearby sold comps map
Loading sold comps map…
Walkable amenities ~0.75 mi
Loading nearby amenities…
Taxation est. · year 1
- Rental income
- $34,763
- − Mortgage interest
- −$21,006
- − Property taxes
- −$3,070
- − Insurance
- −$1,875
- − Repairs & maintenance
- −$2,781
- − Management
- −$2,781
- − Depreciation
- −$10,909
- Taxable loss
- −$7,659
- Est. tax savings @ 24.0%
- +$1,838
- After-tax cash flow
- $757/yr
For passive investors: Depreciation is non-cash, so a rental often shows a tax loss while cash-flowing — sheltering income. Rental losses are passive: they offset passive income freely, and up to $25,000/yr can offset ordinary (W-2) income if you actively participate and your MAGI is under $100k (phasing out to $0 by $150k); unused losses carry forward. On sale, claimed depreciation is recaptured at up to 25%, and gains may owe capital-gains tax (a 1031 exchange can defer both). Figures are a year-1 estimate at your 24.0% rate — not tax advice; consult a CPA.
Schools (NCES district)
- District
- Anson ISD
- NCES district ID
- 4808400
- Math proficiency
- 29% ▼ -9.00%
- Reading proficiency
- 37% ▼ -3.00%
- Median HH income
- $45,223
- Composite
- 28.21/100
- National rank
- #6805
- State rank
- #565 of 826 in TX
Livability — Anson
- Score
- 70/100
- State rank
- #377
- US rank
- #7976
Category grades
Schools grade is shown separately in the Schools card above.
Census & demographics
- Census place
- Anson, TX
- City population
- 2,635
- Population (ZIP)
- 2,635
Population outlook (Jones County) Hauer SSP2
- Today (2025)
- 19,845 people
- By 2030
- 20,213 · +1.9%
- By 2040
- 21,446 · +8.1%
- By 2050
- 22,499 · +13.4%
- By 2075
- 23,272 · +17.3%
- By 2100
- 20,420 · +2.9%
Race, ethnicity, and origin ACS 2023
- Neighborhood character
- Predominantly White (65%)
- Race & ethnicity
- White 65% Hispanic / Latino 31% Two or more races 12% Black 2%
- Hispanic origin (detail)
- Mexican 24%
- Common ancestry
- Slovak 4% Serbian 2% Scotch-Irish 1%
- Foreign-born
- 5% · Canada, Vietnam
- Languages at home
- 81% English-only · Spanish 19%
Political lean MEDSL · Jones
- 2024 margin
- Solid R (+73.2) · D 13.1% · R 86.2%
- 2008→2024 swing
- -27.1pp toward R · 2008: -46.1pp · 2024: -73.2pp
- All cycles
- 2024: R+73.2 2020: R+69.1 2016: R+65.4 2012: R+54.5 2008: R+46.1
Not yet ingested
- Civics
- —
Market trends
- HPI YoY
- ▲ 4.13%
- Current HPI
- 148.5884
- Rent YoY
- —
- Metro
- —
- State GDP YoY
- ▲ 3.95%
- F500 in state
- 110
Industry mix (Fortune 500 HQ in TX)
| Industry | F500 HQs | Revenue |
|---|---|---|
| Energy | 16 | $1,198B |
|
||
| Technology | 5 | $198B |
|
||
| Engineering / Construction | 4 | $72B |
|
||
| Energy Services | 3 | $60B |
|
||
| Utilities | 3 | $41B |
|
||
| Healthcare | 2 | $330B |
|
||
Price history
-13.8% since first listed12 events — show timeline
- 2026-02-17 Pending — NTREIS
- 2025-08-06 Listed $375,000 NTREIS
- 2025-07-31 Listing Removed — NTREIS
- 2025-03-20 Relisted — NTREIS
- 2024-12-02 Listed $375,000 NTREIS
- 2024-11-22 Listing Removed — NTREIS
- 2024-10-04 Price Changed $375,000 NTREIS
- 2024-07-22 Price Changed $395,000 NTREIS
- 2024-06-10 Listed $435,000 NTREIS
- 2002-10-28 Sold (Public Records) — Public Records
- 2001-08-21 Sold (Public Records) — Public Records
- 1990-03-11 Sold (Public Records) — Public Records
Property tax history
-1.8%/yrLatest (2025): $3,070 · +20.7% YoY. Source: county tax records.
Cash-flow waterfall
monthlySold comps — $/sqft
last 12 mo · ≤1 miLoading sold comps…