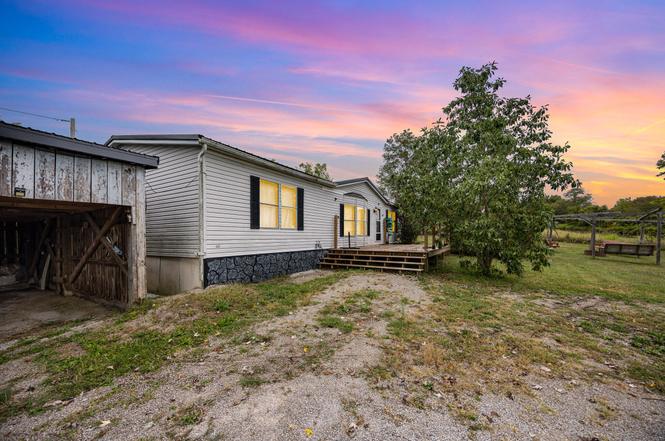
1672 Wagel Rd · Brooksville, KY
Flood risk 1/10 · Minimal
- FEMA flood zone
- X (unshaded)
- Chance of flooding over 30 yrs
- 0.0%
- Est. flood insurance / yr
- $473 – $860
Fire risk 3/10 · Minor
- Est. fire insurance / yr
- $839 – $1,559
Heat risk 4/10 · Minor
- Hot days now (above 101°F)
- 7 days/yr
- Hot days in 30 yrs
- 19 days/yr
Wind risk 2/10 · Minimal
- Chance of severe wind over 30 yrs
- 1.0%
Air-quality risk 2/10 · Minimal
- Unhealthy air days now
- 0 days/yr
- Unhealthy air days in 30 yrs
- 1 days/yr
Risk factors via First Street. Map © Google.
Why this score? — see what drove the B grade
The composite is a weighted blend of 9 inputs, each scored 0–100. Each bar is that input's sub-score; the figure is the points it added to the 100-point composite (weight × sub-score).
- Cash flow +28.8/30.0
- DSCR +10.0/10.0
- Appreciation +10.0/10.0
- ARV discount +7.5/15.0
- 1% rule +7.2/10.0
- Livability +3.2/5.0
- Schools +2.7/10.0
- Rent growth +2.5/5.0
- Condition / age +2.5/5.0
$99,000
🖨 Deal sheet 📄 Offer letter ✓ Due diligence
Listing remarks MLS
Nice 3 bedroom home set on quiet country road. Home is total electric and in great shape. Enjoy several fruit trees in the nice size yard. Newer roof and plumbing. Bring An Offer!
Key facts
- Large carport
- 3 year old roof
- Tornado shelter
Tags
Neighborhood map
What this means for you Summary
Snapshot
- This is a 3-bed/2.0-bath manufactured listed at $99k.
Deal economics
- At list price, monthly cash flow is $332 ($4k/yr) — positive.
- The deal already cash-flows at list — no discount required.
- Meets the 1% rule at list price ($1k rent vs $99k).
- Recommended offer: $96k (3.0% below list) — sets the bar for market timing.
Location & tenants
- Location reads 64/100 on livability (#293 in KY) — a middle-class / working-renter tenant base. Strengths: crime A+, cost of living A+; Watch: health & safety C-, amenities F, commute F.
- Bracken County (rural): math 27% / reading 38% proficiency, ranked #86 of 165 in KY (top 52%) — families likely to look elsewhere, expect single-tenant / working-renter base with shorter leases.
- Zoned schools: Taylor Elementary School (math 29% / reading 31%, grade F, #388 of 676 statewide, top 58%, 522 students, 53% FRL); Bracken County Middle School (math 28% / reading 47%, grade F, #73 of 217 statewide, top 36%, 259 students, 53% FRL); Bracken County High School (math 17% / reading 27%, grade F, #202 of 254 statewide, top 82%, 364 students, 54% FRL).
- Market conditions: 21 active listings in the ZIP.
Forward outlook
- In year one you build about $11k of equity ($684 loan paydown + $10k appreciation (10.0% local appreciation)).
- Bracken County population projected at -22% by 2050 — secular population decline; favor cash flow + early exit over multi-decade hold.
- At projected returns (10.0% appreciation + 3.0% rent growth), your $28k cash investment doubles in ~2 years — after that, you're playing with house money.
- By year 4, paydown + projected appreciation supports a ~$38k cash-out refi (75% LTV) — recoverable capital for the next deal without selling this one.
Negotiation context
- It's been on market 45 days — a 3% lower offer ($96k) is reasonable based on typical stale-listing flexibility.
- 3 sale attempts since 15y ago; this cycle's ask has dropped $29k (23%) from the opening price — seller is motivated, your offer sets the floor, not the list.
- Current owner paid $40k; list at $99k implies a 148% gain — meaningful room to come down on a strong offer.
Questions for the listing agent
- It's been on market 45 days. Have you received any prior offers? Is the seller open to a 3% concession, seller financing, or rate buy-down credit?
- Is there a deadline driving the sale (1031 exchange, divorce, estate, relocation)? That informs how much negotiation room exists.
- Schools are D-rated, which usually means shorter tenancies and higher turnover. Who's the typical renter profile here, and what's been the actual vacancy rate?
- What's the average days-on-market for RENTAL listings here right now (not sales)? A rising rental-DOM trend means longer vacancies and softer asking-rent achievability than the comps imply.
- What's the recent tenant-quality profile in this submarket — average credit score on applications, eviction rate, late-payment / NSF rate, and stable-employment percentage? A property-management company in the area should have these aggregated.
- How much new for-sale + rental construction is in the pipeline within 1–3 miles? Heavy new supply typically softens prices + rents 12–24 months out; constrained supply supports both.
Investment metrics
- 1% rule
- 1.22% ✓
- Cap rate
- 10.32%
- Cash-on-cash
- 14.38%
- DSCR
- 1.64
- GRM
- 6.8
CMA / ARV
No comps found within radius.
Projected returns pro-forma
10.0% appreciation · 3.0% rent growth · sell at horizon
- IRR
- 34.9%
- Equity multiple
- 3.71×
- Total profit
- $75,053
- Equity at exit
- $89,187
- IRR
- 30.0%
- Equity multiple
- 8.37×
- Total profit
- $204,345
- Equity at exit
- $192,335
Cash invested: $27,720 (down + closing). Projections, not guarantees.
Landlord ↔ Tenant lean methodology
- Overall (STATE)
- 83 Strongly Landlord-Friendly
- State Kentucky
- 83 Strongly Landlord-Friendly · R+16
- County
- — inherits STATE
- City
- — inherits STATE
ZIP-level market 41004
- Home prices YoY
- 3.6%
- Active inventory
- 21
- Price-to-rent
- 6.8×
Monthly cashflow live
- Estimated rent
- $1,209 medium interval (Pro) →
- Mortgage (P&I)
- −$519
- Tax from tax record
- −$62 /mo · $747/yr
- Insurance
- −$41
- HOA
- −$0
- Vacancy / Maint / Mgmt
- −$254
- Net cashflow
- $332
Break-even live
UW: 25.0% down · 7.5% · 30yr · 1.5% tax · 5.0% vac · 8.0% maint · 8.0% mgmt
Financing live
Cash to close
- Down payment
- $24,750
- Closing costs
- $2,970
- Reserves months
- —
- Total cash needed
- —
Loan-product check · same deal, 3 products live
Conventional
25% down · 7.5% · 30yr
- Down + closing
- —
- Monthly P&I
- —
- Monthly cashflow
- —
- DSCR
- —
- Eligible?
- —
Personal DTI + credit; lowest rate.
DSCR
20% down · 8.5% · 30yr
- Down + closing
- —
- Monthly P&I
- —
- Monthly cashflow
- —
- DSCR
- —
- Eligible?
- —
No personal income docs; deal must DSCR.
Hard money
10% down · 12.0% · 12mo
- Down + closing
- —
- Monthly P&I
- —
- Monthly cashflow
- —
- DSCR
- —
- Eligible?
- —
Short-term bridge; refi at stabilization.
Listing history 13 events
-
2026-04-01status Pending
-
2026-03-24price $99,000
-
2026-03-04price $110,000
-
2026-02-13$127,900 Active
-
2025-10-22status Pending
-
2025-10-08historical
-
2025-09-09$127,900 Active
-
2012-07-23soldstatus $39,900 179-char remark
Show marketing remark (179 chars)
Nice 3 bedroom home set on quiet country road. Home is total electric and in great shape. Enjoy several fruit trees in the nice size yard. Newer roof and plumbing. Bring An Offer!
-
2012-07-23soldstatus $39,900
Show marketing remark (179 chars)
Nice 3 bedroom home set on quiet country road. Home is total electric and in great shape. Enjoy several fruit trees in the nice size yard. Newer roof and plumbing. Bring An Offer!
-
2011-10-26$39,900 179-char remark
Show marketing remark (179 chars)
Nice 3 bedroom home set on quiet country road. Home is total electric and in great shape. Enjoy several fruit trees in the nice size yard. Newer roof and plumbing. Bring An Offer!
-
2000-07-01soldstatus $41,500
-
1999-09-01soldstatus $40,740
-
1997-01-01soldstatus $52,000
ⓘ Source: listings_history table (triggers on properties + properties_extension) + one-shot
backfill from property_details.listing_events for pre-trigger history.
Tax reassessment forecast KY · Resets to sale price
- Current annual tax
- $747 · $62/mo
- Projected year-2 tax
- $851 · $71/mo
- Expected delta
- +$104/yr (+$9/mo · 13.9%)
ⓘ Screening estimate from a state-policy table — verify with the county assessor before closing.
Climate risk First Street
- Flood 1/10 Low FEMA zone X (unshaded) · 0% chance over 30 yrs
- Wildfire 3/10 Moderate
- Heat 4/10 Moderate 7 d/yr ≥101°F today · 19 d/yr by 30 yrs out
- Wind 2/10 Low 100% chance of damaging wind over 30 yrs
- Air quality 2/10 Low 0 unhealthy d/yr today · 1 by 30 yrs out
Nearby sold comps map
Loading sold comps map…
Walkable amenities ~0.75 mi
Loading nearby amenities…
Taxation est. · year 1
- Rental income
- $14,504
- − Mortgage interest
- −$5,546
- − Property taxes
- −$747
- − Insurance
- −$495
- − Repairs & maintenance
- −$1,160
- − Management
- −$1,160
- − Depreciation
- −$2,880
- Taxable income
- $2,515
- Est. tax owed @ 24.0%
- −$604
- After-tax cash flow
- $3,382/yr
For passive investors: Depreciation is non-cash, so a rental often shows a tax loss while cash-flowing — sheltering income. Rental losses are passive: they offset passive income freely, and up to $25,000/yr can offset ordinary (W-2) income if you actively participate and your MAGI is under $100k (phasing out to $0 by $150k); unused losses carry forward. On sale, claimed depreciation is recaptured at up to 25%, and gains may owe capital-gains tax (a 1031 exchange can defer both). Figures are a year-1 estimate at your 24.0% rate — not tax advice; consult a CPA.
Schools (NCES district)
- District
- Bracken County
- NCES district ID
- 2100660
- Math proficiency
- 27% ▼ -17.00%
- Reading proficiency
- 38% ▼ -12.00%
- Median HH income
- $41,507
- Composite
- 27.42/100
- National rank
- #6967
- State rank
- #86 of 165 in KY
Livability — Brooksville
- Score
- 64/100
- State rank
- #293
- US rank
- #14121
Category grades
Schools grade is shown separately in the Schools card above.
Census & demographics
- County
- Bracken · 8,179 people
- Metro
- Cincinnati, OH-KY-IN
- Population (ZIP)
- 4,105
- Household income
- $59,944
- Rent vs Own
Population outlook (Bracken County) Hauer SSP2
- Today (2025)
- 8,026 people
- By 2030
- 7,751 · -3.4%
- By 2040
- 7,054 · -12.1%
- By 2050
- 6,246 · -22.2%
- By 2075
- 4,453 · -44.5%
- By 2100
- 2,941 · -63.4%
Race, ethnicity, and origin ACS 2023
- Neighborhood character
- Predominantly White (94%)
- Race & ethnicity
- White 94% Two or more races 4% Black 2%
- Common ancestry
- Lithuanian 3% Slovak 3% Serbian 2%
- Foreign-born
- 0%
Political lean MEDSL · Bracken
- 2024 margin
- Solid R (+65.0) · D 16.9% · R 82.0% · Other 1.1%
- 2008→2024 swing
- -40.8pp toward R · 2008: -24.3pp · 2024: -65.0pp
- All cycles
- 2024: R+65.0 2020: R+61.2 2016: R+57.0 2012: R+27.3 2008: R+24.3
Not yet ingested
- Civics
- —
Market trends
- HPI YoY
- ▲ 10.21%
- Current HPI
- 290.6204
- Rent YoY
- —
- Metro
- —
- State GDP YoY
- ▲ 1.81%
- F500 in state
- 4
Industry mix (Fortune 500 HQ in KY)
| Industry | F500 HQs | Revenue |
|---|---|---|
| Healthcare | 1 | $118B |
|
||
| Food / Beverage | 1 | $7B |
|
||
Price history
+90.4% since first listed13 events — show timeline
- 2026-04-01 Pending — NKMLS
- 2026-03-24 Price Changed $99,000 NKMLS
- 2026-03-04 Price Changed $110,000 NKMLS
- 2026-02-13 Listed $127,900 NKMLS
- 2025-10-22 Pending — NKMLS
- 2025-10-08 Listing Removed — NKMLS
- 2025-09-09 Listed $127,900 NKMLS
- 2012-07-23 Sold (Public Records) $39,900 Public Records
- 2012-07-23 Sold (MLS) $39,900 NKMLS
- 2011-10-26 Listed $39,900 NKMLS
- 2000-07-01 Sold (Public Records) $41,500 Public Records
- 1999-09-01 Sold (Public Records) $40,740 Public Records
- 1997-01-01 Sold (Public Records) $52,000 Public Records
Property tax history
+3.2%/yrLatest (2025): $747 · +7.8% YoY. Source: county tax records.
Cash-flow waterfall
monthlySold comps — $/sqft
last 12 mo · ≤1 miLoading sold comps…