 🏷️ Likely Rental
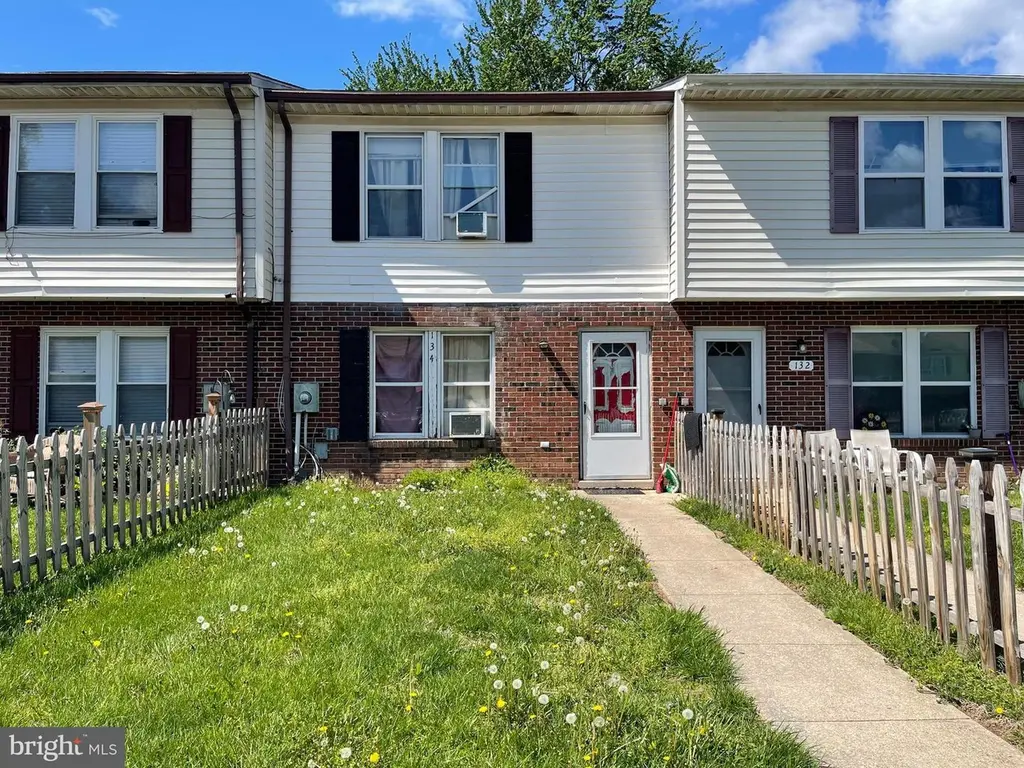
134 Carnival Dr · Taneytown, MD
Flood risk 1/10 · Minimal
- FEMA flood zone
- X (unshaded)
- Chance of flooding over 30 yrs
- 0.0%
- Est. flood insurance / yr
- $507 – $1,088
Fire risk 1/10 · Minimal
- Est. fire insurance / yr
- $755 – $1,403
Heat risk 6/10 · Moderate
- Hot days now (above 102°F)
- 7 days/yr
- Hot days in 30 yrs
- 15 days/yr
Wind risk 4/10 · Minor
- Chance of severe wind over 30 yrs
- 8.0%
Air-quality risk 2/10 · Minimal
- Unhealthy air days now
- 1 days/yr
- Unhealthy air days in 30 yrs
- 2 days/yr
Risk factors via First Street. Map © Google.
Why this score? — see what drove the C+ grade
The composite is a weighted blend of 9 inputs, each scored 0–100. Each bar is that input's sub-score; the figure is the points it added to the 100-point composite (weight × sub-score).
- Cash flow +21.5/30.0
- ARV discount +15.0/15.0
- DSCR +6.9/10.0
- 1% rule +5.5/10.0
- Schools +3.7/10.0
- Livability +3.6/5.0
- Rent growth +2.5/5.0
- Condition / age +2.5/5.0
- Appreciation +0.0/10.0
$150,000
🖨 Deal sheet (PDF) 📄 Offer letter ✓ Due diligence
Listing remarks MLS
New Price! Investor Alert! This house is tenant occupied and needs renovations. It is a great rental, tenant would like to stay. Instant income of $1692.00 per month. 3 bedrooms, 1 full bath townhome. House will not pass FHA or VA financing requirements. Great location, so close to downtown Taneytown, the library, parks, dining and shopping.
Key facts
- Needs renovations
- Shopping
- Library
Tags
Neighborhood map
What this means for you Summary
Snapshot
- This is a 3-bed/1.0-bath townhouse listed at $150k.
Deal economics
- At list price, monthly cash flow is $225 ($3k/yr) — positive.
- The deal already cash-flows at list — no discount required.
- Meets the 1% rule at list price ($2k rent vs $150k).
- Recommended offer: $146k (3.0% below list) — sets the bar for market timing.
- Cap rate 8.1% vs local median 1.8% in Taneytown — top-decile yield for the area; either an underpriced asset or a hidden risk that comps aren't pricing in. Stress-test before assuming the spread holds.
Location & tenants
- Location reads 71/100 on livability (#149 in MD) — a middle-class / working-renter tenant base. Strengths: housing A+, health & safety A+, employment A-; Watch: schools C-, crime D+, amenities F.
- Carroll County Public Schools (suburban): math 32% / reading 47% proficiency, ranked #2 of 24 in MD (top 8%) — families likely to look elsewhere, expect single-tenant / working-renter base with shorter leases; only 16% free/reduced lunch — higher-income household profile.
- Market conditions: 55 active listings in the ZIP; 3 comparable units currently listed for rent nearby; rentals leasing fast (median 4d on market — plan ~1-2 weeks tenant-placement turnaround); 156 units permitted in Carroll County in 2024 (12 in 5+ unit buildings).
Forward outlook
- Local home prices are declining (-3.0%/yr); year-one equity from $1k of loan paydown is wiped out by about $4k of value loss. Plan a longer hold.
- Carroll County population projected to shrink 7% by 2050 — rents likely to lag national; underwrite the cash flow, not the appreciation.
Negotiation context
- It's been on market 57 days — a 3% lower offer ($146k) is reasonable based on typical stale-listing flexibility.
- 6 sale attempts since 26y ago; this cycle's ask has dropped $25k (14%) from the opening price — seller is motivated, your offer sets the floor, not the list.
- Current owner paid $78k; list at $150k implies a 94% gain — meaningful room to come down on a strong offer.
Risks & watch-outs
- Climate carrying-cost: extreme-heat days projected 7→15/yr by 2055 (HVAC capex compounding) — expect insurance premiums to compound above CPI over the hold.
Questions for the listing agent
- It's been on market 57 days. Have you received any prior offers? Is the seller open to a 3% concession, seller financing, or rate buy-down credit?
- Is there a deadline driving the sale (1031 exchange, divorce, estate, relocation)? That informs how much negotiation room exists.
- Crime grade is D in this area — have there been break-ins, vandalism, or insurance claims at this property in the last 3 years? What carrier currently insures it and at what premium?
- What's the average days-on-market for RENTAL listings here right now (not sales)? A rising rental-DOM trend means longer vacancies and softer asking-rent achievability than the comps imply.
- What's the recent tenant-quality profile in this submarket — average credit score on applications, eviction rate, late-payment / NSF rate, and stable-employment percentage? A property-management company in the area should have these aggregated.
- How much new for-sale + rental construction is in the pipeline within 1–3 miles? Heavy new supply typically softens prices + rents 12–24 months out; constrained supply supports both.
Investment metrics
- 1% rule
- 1.05% ✓
- Cap rate
- 8.10%
- Cash-on-cash
- 6.44%
- DSCR
- 1.29
- GRM
- 7.9
CMA / ARV
- ARV (median comp)
- $201,269
- List price
- $150,000
- Delta
- -25.47%
- Verdict
- UNDERPRICED
- Comps
- 20 within 1.0 mi
Show comp detail 12 sales within ~0.75 mi
| Address | Dist | Beds/Ba | Sqft | Sold | Price | $/sf | Match |
|---|---|---|---|---|---|---|---|
| 105 Carnival Dr | 0.07mi | 3/1.5 | 1,032 (-6%) | 5mo | $225,000 | $218 | 80 |
| 149 Grand Dr | 0.03mi | 3/1.5 | 1,188 (+8%) | 7mo | $200,000 | $168 | 77 |
| 113 Grand Dr | 0.05mi | 3/1.5 | 1,032 (-6%) | 11mo | $202,000 | $196 | 76 |
| 121 Carnival Dr | 0.05mi | 3/1.5 | 1,032 (-6%) | 11mo | $225,000 | $218 | 76 |
| 404 Red Tulip Ct | 0.40mi | 3/1.5 | 1,152 (+5%) | 0mo | $230,000 | $200 | 71 |
| 417 Red Tulip Ct | 0.43mi | 3/1.5 | 1,160 (+6%) | 2mo | $229,900 | $198 | 67 |
| 526 Daisy Dr | 0.48mi | 3/1.5 | 1,152 (+5%) | 1mo | $220,000 | $191 | 66 |
| 423 Clover Ct | 0.55mi | 3/— | 1,152 (+5%) | 3mo | $230,000 | $200 | 64 |
| 443 Red Tulip Ct | 0.45mi | 3/1.5 | 1,152 (+5%) | 10mo | $228,000 | $198 | 61 |
| 505 Chestnut Ct | 0.49mi | 3/1.5 | 1,152 (+5%) | 8mo | $212,000 | $184 | 61 |
| 6 Courtland St | 0.66mi | 2/1.0 (-1) | 1,152 (+5%) | 10mo | $214,000 | $186 | 48 |
| 3 Courtland St | 0.65mi | 2/1.0 (-1) | 1,208 (+10%) | 3mo | $216,000 | $179 | 46 |
Match score weights: distance 35% · size 25% · config 20% · recency 20%. Top-matched comps best support the ARV.
Projected returns pro-forma
-3.0% appreciation · 3.0% rent growth · sell at horizon
- IRR
- -6.4%
- Equity multiple
- 0.76×
- Total profit
- $-9,943
- Equity at exit
- $22,365
- IRR
- 3.3%
- Equity multiple
- 1.24×
- Total profit
- $9,875
- Equity at exit
- $12,969
Cash invested: $42,000 (down + closing). Projections, not guarantees.
Landlord ↔ Tenant lean methodology
- Overall (STATE)
- 27 Tenant-Leaning
- State Maryland
- 27 Tenant-Leaning · D+14
- County
- — inherits STATE
- City
- — inherits STATE
ZIP-level market 21787
- Home prices YoY
- -34.0%
- Active inventory
- 55
- Price-to-rent
- 7.9×
Monthly cashflow live
- Estimated rent
- $1,577 medium interval (Pro) →
- Mortgage (P&I)
- −$787
- Tax from tax record
- −$171 /mo · $2,055/yr
- Insurance
- −$62
- HOA
- −$0
- Vacancy / Maint / Mgmt
- −$331
- Net cashflow
- $225
Break-even live
Sensitivity live
| Price | -10% $310 | -5% $268 | +0% $225 | +5% $183 | +10% $140 |
|---|---|---|---|---|---|
| Rent | -10% $101 | -5% $163 | +0% $225 | +5% $288 | +10% $350 |
| Rate | -1.0pp $301 | -0.5pp $263 | base $225 | +0.5pp $186 | +1.0pp $147 |
UW: 25.0% down · 7.5% · 30yr · 1.5% tax · 5.0% vac · 8.0% maint · 8.0% mgmt
Financing live
Cash to close
- Down payment
- $37,500
- Closing costs
- $4,500
- Reserves months
- —
- Total cash needed
- —
Loan-product check · same deal, 3 products live
Conventional
25% down · 7.5% · 30yr
- Down + closing
- —
- Monthly P&I
- —
- Monthly cashflow
- —
- DSCR
- —
- Eligible?
- —
Personal DTI + credit; lowest rate.
DSCR
20% down · 8.5% · 30yr
- Down + closing
- —
- Monthly P&I
- —
- Monthly cashflow
- —
- DSCR
- —
- Eligible?
- —
No personal income docs; deal must DSCR.
Hard money
10% down · 12.0% · 12mo
- Down + closing
- —
- Monthly P&I
- —
- Monthly cashflow
- —
- DSCR
- —
- Eligible?
- —
Short-term bridge; refi at stabilization.
Rent comps 3 comps
| Address | Beds | Baths | Sqft | Rent | $/sqft | DOM | Units | Dist |
|---|---|---|---|---|---|---|---|---|
| 104 Grand Dr Taneytown, MD | 2.0 | 1.0 | 848 | $1,286 | $1.52 | 1d | 1 | 0.11mi |
| 75 Grand Dr Taneytown, MD | 3.0 | 1.5 | 1032 | $1,850 | $1.79 | 18d | 1 | 0.16mi |
| 3 Courtland St Unit 3 Taneytown, MD | 2.0 | 1.0 | 1208 | $1,900 | $1.57 | 4d | 1 | 0.67mi |
Listing history 30 events
-
2026-06-18days on market $150,000 Active 57 DOM
-
2026-06-17days on market $150,000 Active 56 DOM
-
2026-06-16days on market $150,000 Active 55 DOM
-
2026-06-15days on market $150,000 Active 54 DOM
-
2026-06-13days on market $150,000 Active 52 DOM
-
2026-06-09days on market $150,000 Active 48 DOM
-
2026-06-08days on market $150,000 Active 47 DOM
-
2026-06-07days on market $150,000 Active 46 DOM
-
2026-06-04days on market $150,000 Active 43 DOM
-
2026-06-03days on market $150,000 Active 42 DOM
-
2026-06-02days on market $150,000 Active 41 DOM
-
2026-06-01days on market $150,000 Active 40 DOM
-
2026-05-31days on market $150,000 Active 39 DOM
-
2026-05-18price $150,000 343-char remark
Show marketing remark (343 chars)
New Price! Investor Alert! This house is tenant occupied and needs renovations. It is a great rental, tenant would like to stay. Instant income of $1692.00 per month. 3 bedrooms, 1 full bath townhome. House will not pass FHA or VA financing requirements. Great location, so close to downtown Taneytown, the library, parks, dining and shopping.
-
2026-04-22$175,000 Active 343-char remark
Show marketing remark (343 chars)
New Price! Investor Alert! This house is tenant occupied and needs renovations. It is a great rental, tenant would like to stay. Instant income of $1692.00 per month. 3 bedrooms, 1 full bath townhome. House will not pass FHA or VA financing requirements. Great location, so close to downtown Taneytown, the library, parks, dining and shopping.
-
2015-05-10historical
-
2015-05-10historical Expired
-
2014-11-10Active
-
2014-11-10$97,000
-
2006-12-31historical
-
2006-08-02
-
2003-05-12soldstatus $77,500
-
2003-05-06soldstatus $77,500
-
2003-03-16historical
-
2002-10-04$79,000
-
2000-06-09soldstatus $85,000
-
2000-06-09$85,000
-
2000-05-09soldstatus $85,000
-
1995-06-28soldstatus $1,350,000
-
1995-06-28soldstatus $1,350,000
ⓘ Source: listings_history table (triggers on properties + properties_extension) + one-shot
backfill from property_details.listing_events for pre-trigger history.
Tax reassessment forecast MD · Partial reset (capped growth)
- Current annual tax
- $2,055 · $171/mo
- Projected year-2 tax
- $2,055 · $171/mo
- Expected delta
- $0/yr ($0/mo · 0.0%)
ⓘ Screening estimate from a state-policy table — verify with the county assessor before closing.
Climate risk First Street
- Flood 1/10 Low FEMA zone X (unshaded) · 0% chance over 30 yrs
- Wildfire 1/10 Low
- Heat 6/10 Major 7 d/yr ≥102°F today · 15 d/yr by 30 yrs out
- Wind 4/10 Moderate 8% chance of damaging wind over 30 yrs
- Air quality 2/10 Low 1 unhealthy d/yr today · 2 by 30 yrs out
Nearby sold comps map
Loading sold comps map…
Walkable amenities ~0.75 mi
Loading nearby amenities…
Taxation est. · year 1
- Rental income
- $18,921
- − Mortgage interest
- −$8,402
- − Property taxes
- −$2,055
- − Insurance
- −$750
- − Repairs & maintenance
- −$1,514
- − Management
- −$1,514
- − Depreciation
- −$4,364
- Taxable income
- $323
- Est. tax owed @ 24.0%
- −$78
- After-tax cash flow
- $2,626/yr
For passive investors: Depreciation is non-cash, so a rental often shows a tax loss while cash-flowing — sheltering income. Rental losses are passive: they offset passive income freely, and up to $25,000/yr can offset ordinary (W-2) income if you actively participate and your MAGI is under $100k (phasing out to $0 by $150k); unused losses carry forward. On sale, claimed depreciation is recaptured at up to 25%, and gains may owe capital-gains tax (a 1031 exchange can defer both). Figures are a year-1 estimate at your 24.0% rate — not tax advice; consult a CPA.
Schools (NCES district)
- District
- Carroll County Public Schools
- NCES district ID
- 2400210
- Math proficiency
- 32% ▼ -25.00%
- Reading proficiency
- 47% ▼ -16.00%
- Median HH income
- $84,594
- Composite
- 37.33/100
- National rank
- #4441
- State rank
- #2 of 24 in MD
Livability — Taneytown
- Score
- 71/100
- State rank
- #149
- US rank
- #6550
Category grades
Schools grade is shown separately in the Schools card above.
Census & demographics
- Census place
- Taneytown, MD
- Population (ZIP)
- 11,549
Population outlook (Carroll County) Hauer SSP2
- Today (2025)
- 169,677 people
- By 2030
- 169,605 · +-0.0%
- By 2040
- 166,205 · -2.0%
- By 2050
- 158,312 · -6.7%
- By 2075
- 143,013 · -15.7%
- By 2100
- 122,431 · -27.8%
Race, ethnicity, and origin ACS 2023
- Neighborhood character
- Predominantly White (86%)
- Race & ethnicity
- White 86% Black 5% Hispanic / Latino 5% Two or more races 4%
- Hispanic origin (detail)
- Common ancestry
- Romanian 1% Slovak 1% Hispanic 1%
- Foreign-born
- 4% · Canada
- Languages at home
- 95% English-only · Spanish 2% French/Haitian/Cajun 1%
Political lean MEDSL · Carroll
- 2024 margin
- Strong R (+24.9) · D 36.2% · R 61.2% · Other 2.6%
- 2008→2024 swing
- +6.2pp toward D · 2008: -31.2pp · 2024: -24.9pp
- All cycles
- 2024: R+24.9 2020: R+23.7 2016: R+36.9 2012: R+34.0 2008: R+31.2
Not yet ingested
- Civics
- —
Market trends
- HPI YoY
- ▼ -132.27%
- Current HPI
- 257.2289
- Rent YoY
- —
- Metro
- —
- State GDP YoY
- ▲ 2.97%
- F500 in state
- 12
Industry mix (Fortune 500 HQ in MD)
| Industry | F500 HQs | Revenue |
|---|---|---|
| Aerospace / Defense | 1 | $71B |
|
||
| Utilities | 1 | $25B |
|
||
| Hotels | 1 | $24B |
|
||
| Consumer Goods | 1 | $7B |
|
||
| Real Estate | 1 | $6B |
|
||
| Chemicals | 1 | $2B |
|
||
Price history
-88.9% since first listed17 events — show timeline
- 2026-05-18 Price Changed $150,000 BRIGHT MLS
- 2026-04-22 Listed $175,000 BRIGHT MLS
- 2015-05-10 Delisted — MRIS
- 2015-05-10 Listing Removed — BRIGHT MLS
- 2014-11-10 Listed — MRIS
- 2014-11-10 Listed $97,000 BRIGHT MLS
- 2006-12-31 Delisted — MRIS
- 2006-08-02 Listed — MRIS
- 2003-05-12 Sold (Public Records) $77,500 Public Records
- 2003-05-06 Sold (MLS) $77,500 MRIS
- 2003-03-16 Delisted — MRIS
- 2002-10-04 Listed $79,000 MRIS
- 2000-06-09 Listed $85,000 MRIS
- 2000-06-09 Sold (MLS) $85,000 MRIS
- 2000-05-09 Sold (Public Records) $85,000 Public Records
- 1995-06-28 Sold (Public Records) $1,350,000 Public Records
- 1995-06-28 Sold (Public Records) $1,350,000 Public Records
Property tax history
+1.6%/yrLatest (2025): $2,055 · +10.2% YoY. Source: county tax records.
Cash-flow waterfall
monthlySold comps — $/sqft
last 12 mo · ≤1 miLoading sold comps…