 🌊 Lakefront
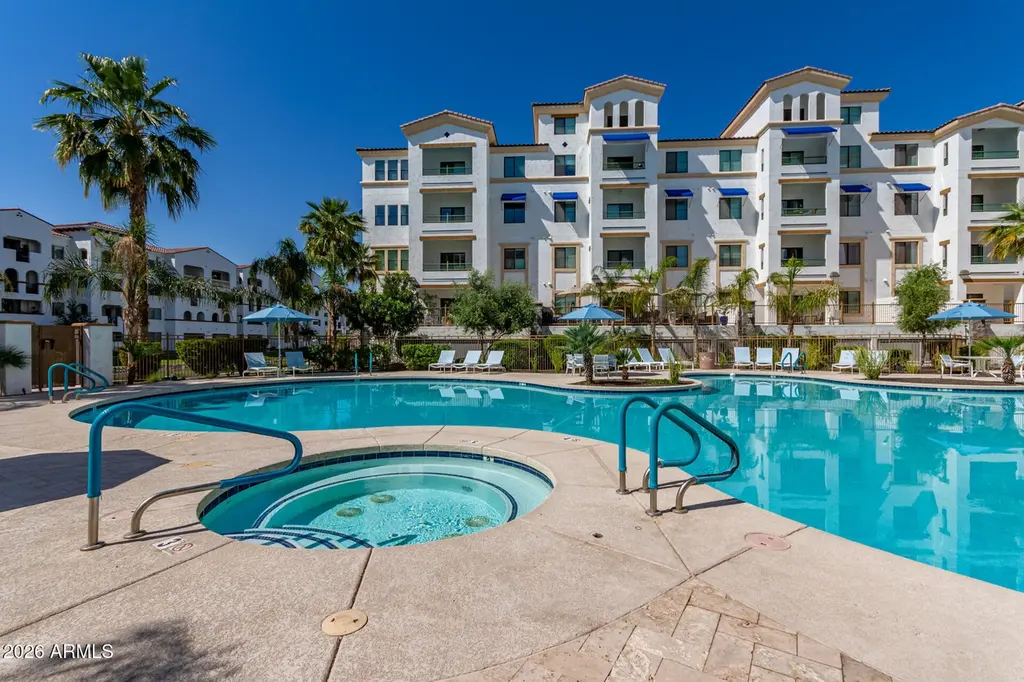
2511 W Queen Creek Rd #337 · Chandler, AZ
Flood risk 1/10 · Minimal
- FEMA flood zone
- X (shaded)
- Chance of flooding over 30 yrs
- 0.0%
- Est. flood insurance / yr
- $507 – $1,088
Fire risk 4/10 · Minor
- Est. fire insurance / yr
- $610 – $1,132
Heat risk 9/10 · Severe
- Hot days now (above 112°F)
- 7 days/yr
- Hot days in 30 yrs
- 19 days/yr
Wind risk 1/10 · Minimal
- Chance of severe wind over 30 yrs
- —
Air-quality risk 2/10 · Minimal
- Unhealthy air days now
- 0 days/yr
- Unhealthy air days in 30 yrs
- 1 days/yr
Risk factors via First Street. Map © Google.
Why this score? — see what drove the D grade
The composite is a weighted blend of 9 inputs, each scored 0–100. Each bar is that input's sub-score; the figure is the points it added to the 100-point composite (weight × sub-score).
- ARV discount +15.0/15.0
- Cash flow +8.8/30.0
- Schools +4.8/10.0
- Livability +3.9/5.0
- 1% rule +3.2/10.0
- Rent growth +2.9/5.0
- Condition / age +2.5/5.0
- DSCR +2.4/10.0
- Appreciation +0.0/10.0
$450,000
🖨 Deal sheet (PDF) 📄 Offer letter ✓ Due diligence
Listing remarks
Beautiful luxury lakefront condo in the heart of downtown Ocotillo, offering resort-style living at its finest. This 2-bedroom residence features a rare private tandem parking space in a secure, gated garage plus a private large storage room, worth over $20,000. Water softener, R/O water purifier. The building is undergoing upgrades to its common areas, bringing bright, modern, high-end finishes throughout. Residents enjoy an impressive suite of amenities, including a boutique fitness center, steam room, clubhouse, technology center, media room, game room, and a gourmet kitchen perfect for private events and social gatherings. Outdoors, relax by the heated pool and spa or take a stroll alo
Key facts
- Gated garage
- Steam room
- Lakefront condo
Tags
Property features AI
Finance
- Other: Building area and lot size sourced from assessor
- Financial info: Currently financed with conventional loan (non-assumable)
- HOA & community: Monthly association fee; Additional quarterly association fee; Association covers roof repair and replacement, insurance, sewer, cable TV, grounds maintenance, street maintenance, trash, water, and exterior maintenance; Community amenities include pool, heated community spa, pickleball courts, tennis courts, lake, fitness center, community media room, biking/walking paths, and proximity to bus stop
Exterior
- Parking: Covered tandem garage with 2 spaces; Gated parking; Assigned parking with permit required
- Security: Fire sprinkler system
- Utilities: City water; Public sewer
- Home design: Apartment (attached property); Fee simple ownership
- Construction: Stucco and wood frame construction; Tile and built-up roof
- Exterior features: Balcony; Wrought iron fencing; Gravel/stone front and back; Private maintained road; Heated spa
Interior
- Kitchen: Built-in microwave; Garbage disposal; Pantry; Breakfast bar; Granite counters
- Bedrooms: 2 bedrooms
- Flooring: Carpet; Tile
- Bathrooms: 2 full bathrooms
- Heating & cooling: Heat pump heating; Central air conditioning; Ceiling fans; Programmable thermostat
- Interior features: High-speed internet; Granite counters; Double vanity; Breakfast bar; Pantry; 3/4 bath in master bedroom; Dual-pane windows
- Laundry & utility: No specific laundry details provided
Neighborhood map
What this means for you Summary
Snapshot
- This is a 2-bed/3.0-bath condo listed at $450k.
Deal economics
- At list price, monthly cash flow is $-374 ($-4k/yr) — negative.
- To cash-flow at today's rent, offer at most $384k (14.7% below list).
- To meet the 1% rule (rent ≥ 1% of price), the offer needs to be $367k (18.3% below list).
- Recommended offer: $367k (18.3% below list) — sets the bar for 1% rule.
- Cap rate 5.3% vs local median 3.3% in Chandler — top-decile yield for the area; either an underpriced asset or a hidden risk that comps aren't pricing in. Stress-test before assuming the spread holds.
Location & tenants
- Location reads 78/100 on livability (#9 in AZ, #2,508 nationally) — a middle-class / working-renter tenant base. Strengths: employment A+, housing A+, crime A-; Watch: health & safety D, cost of living D-.
- Chandler Unified District #80 (4242) (suburban): math 49% / reading 57% proficiency, ranked #31 of 249 in AZ (top 12%) — acceptable for families but not a draw, mixed tenant base, ~2y average lease.
- Zoned schools: Anna Marie Jacobson Elementary School (math 61% / reading 71%, grade B+, #82 of 1,109 statewide, top 8%, 675 students, 22% FRL); Bogle Junior High School (math 43% / reading 52%, grade C-, #36 of 218 statewide, top 18%, 1,151 students, 26% FRL); Hamilton High School (math 52% / reading 49%, grade D+, #36 of 381 statewide, top 9%, 3,850 students, 18% FRL) — zoned schools at 22% FRL track the district average.
- Market conditions: Rents rising (+1.4%/yr); 349 active listings in the ZIP; 27 comparable units currently listed for rent nearby; rentals leasing fast (median 4d on market — plan ~1-2 weeks tenant-placement turnaround); solid renter incomes; 36,011 units permitted in Maricopa County in 2024 (12,801 in 5+ unit buildings).
- At $3,675/mo this rent would consume 47% of the median local household income ($94k/yr) (locally 1107% of renters already pay >50% of income on rent) — very limited rent-growth headroom before tenants either downsize or default.
Forward outlook
- Local home prices are declining (-3.0%/yr); year-one equity from $3k of loan paydown is wiped out by about $14k of value loss. Plan a longer hold.
- Maricopa County population projected at +38% by 2050 — long-run rental-demand tailwind backs the buy-and-hold thesis.
Negotiation context
- It's been on market 52 days — a 3% lower offer ($436k) is reasonable based on typical stale-listing flexibility.
- 3 sale attempts with the ask held roughly flat each time — persistent listings suggest the price (not the market) is what's stuck; bring a comps-based counter.
Risks & watch-outs
- Climate carrying-cost: extreme-heat days projected 7→19/yr by 2055 (HVAC capex compounding) — expect insurance premiums to compound above CPI over the hold.
Questions for the listing agent
- What do current leases actually rent for vs. the listed asking? Can we see a recent rent roll and the last 12 months of T-12 income?
- It's been on market 52 days. Have you received any prior offers? Is the seller open to a 18% concession, seller financing, or rate buy-down credit?
- What does the HOA fee cover, when was the last increase, and are there any pending special assessments or reserve-fund shortfalls?
- Any open or pending special assessments — roof, HVAC, plumbing, elevator, façade? What's the per-unit balance and payoff schedule, and is the seller paying it off at close or rolling it to the buyer?
- Is there a deadline driving the sale (1031 exchange, divorce, estate, relocation)? That informs how much negotiation room exists.
- Schools are B-rated — typically a magnet for longer-tenancy family renters. What's the average tenant stay here, and is there a school-zone premium baked into asking?
- The area grade is low — what's the realistic commute time and amenity access for the typical tenant pool here? Any planned neighborhood developments (good or bad) we should know about?
- This sits on a lake — are riparian / water-frontage rights deeded with the parcel? Any dock permits, shoreline easements, or HOA water-use restrictions?
- What's the documented flood / surge / shoreline-erosion history here (FEMA AND non-FEMA — e.g., storm surge, creek backup, septic-field saturation)?
- Any water-quality or seasonal algae-bloom issues that affect tenant satisfaction or short-term-rental demand?
- What's the average days-on-market for RENTAL listings here right now (not sales)? A rising rental-DOM trend means longer vacancies and softer asking-rent achievability than the comps imply.
- What's the recent tenant-quality profile in this submarket — average credit score on applications, eviction rate, late-payment / NSF rate, and stable-employment percentage? A property-management company in the area should have these aggregated.
- How much new apartment / multifamily construction is in the pipeline within 1–3 miles? Heavy new supply (>2% of stock underway) typically softens rents 12–24 months out; light construction supports rent growth.
Investment metrics
- 1% rule
- 0.82% ✗
- Cap rate
- 5.30%
- Cash-on-cash
- -3.56%
- DSCR
- 0.84
- GRM
- 10.2
CMA / ARV
- ARV (median comp)
- $665,223
- List price
- $450,000
- Delta
- -32.35%
- Verdict
- UNDERPRICED
- Comps
- 20 within 1.0 mi
Projected returns pro-forma
-3.0% appreciation · 1.4% rent growth · sell at horizon
- IRR
- -24.1%
- Equity multiple
- 0.19×
- Total profit
- $-102,377
- Equity at exit
- $67,096
- IRR
- -24.8%
- Equity multiple
- -0.13×
- Total profit
- $-142,281
- Equity at exit
- $38,908
Cash invested: $126,000 (down + closing). Projections, not guarantees.
Landlord ↔ Tenant lean methodology
- Overall (STATE)
- 87 Strongly Landlord-Friendly
- State Arizona
- 87 Strongly Landlord-Friendly · R+3
- County
- — inherits STATE
- City
- — inherits STATE
ZIP-level market 85248
- Home prices YoY
- -23.0%
- Rents YoY
- 1.4%
- Active inventory
- 349
- Price-to-rent
- 10.2×
Monthly cashflow live
- Estimated rent
- $3,675 high interval (Pro) →
- Mortgage (P&I)
- −$2,360
- Tax from tax record
- −$137 /mo · $1,647/yr
- Insurance
- −$188
- HOA
- −$592
- Vacancy / Maint / Mgmt
- −$772
- Net cashflow
- $-374
Break-even live
Sensitivity live
| Price | -10% $-119 | -5% $-246 | +0% $-374 | +5% $-501 | +10% $-628 |
|---|---|---|---|---|---|
| Rent | -10% $-664 | -5% $-519 | +0% $-374 | +5% $-228 | +10% $-83 |
| Rate | -1.0pp $-147 | -0.5pp $-259 | base $-374 | +0.5pp $-490 | +1.0pp $-609 |
UW: 25.0% down · 7.5% · 30yr · 1.5% tax · 5.0% vac · 8.0% maint · 8.0% mgmt
Financing live
Cash to close
- Down payment
- $112,500
- Closing costs
- $13,500
- Reserves months
- —
- Total cash needed
- —
Loan-product check · same deal, 3 products live
Conventional
25% down · 7.5% · 30yr
- Down + closing
- —
- Monthly P&I
- —
- Monthly cashflow
- —
- DSCR
- —
- Eligible?
- —
Personal DTI + credit; lowest rate.
DSCR
20% down · 8.5% · 30yr
- Down + closing
- —
- Monthly P&I
- —
- Monthly cashflow
- —
- DSCR
- —
- Eligible?
- —
No personal income docs; deal must DSCR.
Hard money
10% down · 12.0% · 12mo
- Down + closing
- —
- Monthly P&I
- —
- Monthly cashflow
- —
- DSCR
- —
- Eligible?
- —
Short-term bridge; refi at stabilization.
Rent comps 27 comps
| Address | Beds | Baths | Sqft | Rent | $/sqft | DOM | Units | Dist |
|---|---|---|---|---|---|---|---|---|
| 2511 W Queen Creek Rd Chandler, AZ | 1.0–3.0 | 1.5–3.0 | 1222 | $3,998 | $3.27 | 45d | 17 | 0.04mi |
| 2511 W Queen Creek Rd Chandler, AZ | 1.0–3.0 | 1.5–3.0 | 1222 | $3,950 | $3.23 | 24d | 17 | 0.04mi |
| 2511 W Queen Creek Rd #442 Chandler, AZ | 2.0 | 3.0 | 1584 | $4,725 | $2.98 | 0d | 1 | 0.05mi |
| 2511 W Queen Creek Rd #247 Chandler, AZ | 1.0 | 1.5 | 1011 | $3,937 | $3.89 | 0d | 1 | 0.06mi |
| 2511 W Queen Creek Rd #160 Chandler, AZ | 2.0 | 2.0 | 1346 | $3,800 | $2.82 | 0d | 1 | 0.07mi |
| 2511 W Queen Creek Rd #260 Chandler, AZ | 2.0 | 2.0 | 1346 | $4,500 | $3.34 | 0d | 1 | 0.07mi |
| 2511 W Queen Creek Rd #460 Chandler, AZ | 3.0 | 3.0 | 1556 | $5,750 | $3.70 | 0d | 1 | 0.07mi |
| 2511 W Queen Creek Rd #356 Chandler, AZ | 2.0 | 2.0 | 1346 | $5,700 | $4.23 | 0d | 1 | 0.07mi |
| 2511 W Queen Creek Rd #173 Chandler, AZ | 2.0 | 2.0 | 1445 | $4,000 | $2.77 | 4d | 1 | 0.10mi |
| 1889 W Queen Creek Rd Chandler, AZ | 1.0–2.0 | 1.0–2.0 | 930 | $2,162 | $2.32 | 4d | 15 | 0.29mi |
| 2471 W Edgewater Way Chandler, AZ | 2.0 | 2.0 | 1072 | $2,253 | $2.10 | 24d | 1 | 0.31mi |
| 2471 W Edgewater Way Chandler, AZ | 2.0 | 2.0 | 1076 | $2,113 | $1.96 | 5d | 1 | 0.31mi |
| 2471 W Edgewater Way Chandler, AZ | 3.0 | 2.0 | 1294 | $2,170 | $1.68 | 0d | 1 | 0.31mi |
| 2441 W Indigo Dr Chandler, AZ | 3.0 | 2.0 | 1538 | $2,350 | $1.53 | 45d | 1 | 0.49mi |
| 2281 W Redwood Dr Chandler, AZ | 3.0 | 2.0 | 1568 | $2,300 | $1.47 | 45d | 1 | 0.87mi |
| 2222 S Dobson Rd Chandler, AZ | 1.0–3.0 | 1.0–2.0 | 1004 | $1,820 | $1.81 | 0d | 20 | 0.97mi |
| 2255 W Germann Rd Chandler, AZ | 1.0–3.0 | 1.0–2.0 | 1085 | $1,862 | $1.71 | 0d | 25 | 0.99mi |
| 1901 W Germann Rd Chandler, AZ | 1.0–3.0 | 1.0–2.0 | 1021 | $1,991 | $1.95 | 0d | 13 | 1.09mi |
| 2042 W Periwinkle Way Chandler, AZ | 2.0 | 2.0 | 1311 | $5,000 | $3.81 | 17d | 1 | 1.10mi |
| 2037 W Periwinkle Way Chandler, AZ | 3.0 | 2.0 | 1610 | $3,100 | $1.93 | 26d | 1 | 1.12mi |
| 1833 W Periwinkle Way Chandler, AZ | 3.0 | 2.0 | 1338 | $3,000 | $2.24 | 14d | 1 | 1.14mi |
| 3999 S Dobson Rd Chandler, AZ | 1.0–2.0 | 1.0–2.0 | 900 | $1,876 | $2.08 | 0d | 17 | 1.16mi |
| 3800 S Cantabria Cir Chandler, AZ | 2.0 | 2.0 | 1476 | $3,198 | $2.17 | 26d | 3 | 1.21mi |
| 2759 S Jackrabbit Dr Chandler, AZ | 2.0 | 2.5 | 1273 | $3,050 | $2.40 | 45d | 1 | 1.29mi |
| 1616 W Germann Rd Chandler, AZ | 1.0–2.0 | 1.0–2.0 | 872 | $1,795 | $2.06 | 0d | 15 | 1.30mi |
| 1913 W Grand Canyon Dr Chandler, AZ | 3.0 | 2.0 | 1614 | $2,500 | $1.55 | 26d | 1 | 1.36mi |
| 2450 S Apache Dr Chandler, AZ | 3.0 | 2.0 | 1317 | $2,150 | $1.63 | 0d | 1 | 1.42mi |
HOA detail condo
- Monthly dues
- $592 · $7,104/yr
- Likely covers
- waterpoolgymsecurity
- Assessments
- None detected in remarks — confirm with the listing agent.
Listing history 21 events
-
2026-06-21days on market $450,000 Active 52 DOM
-
2026-06-18days on market $450,000 Active 49 DOM
-
2026-06-17days on market $450,000 Active 48 DOM
-
2026-06-16days on market $450,000 Active 47 DOM
-
2026-06-15days on market $450,000 Active 46 DOM
-
2026-06-13days on market $450,000 Active 44 DOM
-
2026-06-13days on market $450,000 Active 43 DOM
-
2026-06-09days on market $450,000 Active 40 DOM
-
2026-06-08days on market $450,000 Active 39 DOM
-
2026-06-07days on market $450,000 Active 38 DOM
-
2026-06-04days on market $450,000 Active 35 DOM
-
2026-06-03days on market $450,000 Active 34 DOM
-
2026-06-02days on market $450,000 Active 33 DOM
-
2026-06-01days on market $450,000 Active 32 DOM
-
2026-05-31days on market $450,000 Active 31 DOM
-
2026-04-30$450,000 Active 1134-char remark
-
2026-04-29historical
-
2026-01-13$450,000 Active
-
2026-01-01historical
-
2025-10-24price $490,000
-
2025-04-30$500,000 Active
ⓘ Source: listings_history table (triggers on properties + properties_extension) + one-shot
backfill from property_details.listing_events for pre-trigger history.
Tax reassessment forecast AZ · Resets to sale price
- Current annual tax
- $1,647 · $137/mo
- Projected year-2 tax
- $2,970 · $248/mo
- Expected delta
- +$1,323/yr (+$110/mo · 80.3%)
ⓘ Screening estimate from a state-policy table — verify with the county assessor before closing.
Climate risk First Street
- Flood 1/10 Low FEMA zone X (shaded) · 0% chance over 30 yrs
- Wildfire 4/10 Moderate
- Heat 9/10 Extreme 7 d/yr ≥112°F today · 19 d/yr by 30 yrs out
- Wind 1/10 Low
- Air quality 2/10 Low 0 unhealthy d/yr today · 1 by 30 yrs out
Nearby sold comps map
Loading sold comps map…
Walkable amenities ~0.75 mi
Loading nearby amenities…
Taxation est. · year 1
- Rental income
- $44,097
- − Mortgage interest
- −$25,207
- − Property taxes
- −$1,647
- − Insurance
- −$2,250
- − Repairs & maintenance
- −$3,528
- − Management
- −$3,528
- − HOA
- −$7,104
- − Depreciation
- −$13,091
- Taxable loss
- −$12,258
- Est. tax savings @ 24.0%
- +$2,942
- After-tax cash flow
- $-1,541/yr
For passive investors: Depreciation is non-cash, so a rental often shows a tax loss while cash-flowing — sheltering income. Rental losses are passive: they offset passive income freely, and up to $25,000/yr can offset ordinary (W-2) income if you actively participate and your MAGI is under $100k (phasing out to $0 by $150k); unused losses carry forward. On sale, claimed depreciation is recaptured at up to 25%, and gains may owe capital-gains tax (a 1031 exchange can defer both). Figures are a year-1 estimate at your 24.0% rate — not tax advice; consult a CPA.
Schools (NCES district)
- District
- Chandler Unified District #80 (4242)
- NCES district ID
- 0401870
- Math proficiency
- 49% ▼ -8.00%
- Reading proficiency
- 57% ▼ -2.00%
- Median HH income
- $74,048
- Composite
- 47.54/100
- National rank
- #2268
- State rank
- #31 of 249 in AZ
Livability — Chandler
- Score
- 78/100
- State rank
- #9
- US rank
- #2508
Category grades
Schools grade is shown separately in the Schools card above.
Census & demographics
- Census place
- Chandler, AZ
- County
- Maricopa County · 4,537,380 people
- City population
- 299,016
- Metro
- Phoenix-Mesa-Chandler, AZ
- Population (ZIP)
- 37,095
- Household income
- $94,495
- Rent vs Own
- Severe rent burden
- 1107.0
Population outlook (Maricopa County) Hauer SSP2
- Today (2025)
- 4,979,203 people
- By 2030
- 5,378,229 · +8.0%
- By 2040
- 6,156,598 · +23.6%
- By 2050
- 6,872,376 · +38.0%
- By 2075
- 8,401,270 · +68.7%
- By 2100
- 9,247,439 · +85.7%
Race, ethnicity, and origin ACS 2023
- Neighborhood character
- Predominantly White (70%)
- Race & ethnicity
- White 70% Asian 13% Hispanic / Latino 8% Two or more races 7% Black 3% Native American 2%
- Hispanic origin (detail)
- Mexican 5%
- Common ancestry
- Lithuanian 3% Portuguese 3% Romanian 3%
- Foreign-born
- 16% · Canada, China, South Korea
- Languages at home
- 83% English-only · Spanish 4% Other Asian/Pacific 3% Other Indo-European 3%
Political lean MEDSL · Maricopa
- 2024 margin
- Toss-up / Even · D 47.7% · R 51.2% · Other 1.1%
- 2008→2024 swing
- +7.1pp toward D · 2008: -10.6pp · 2024: -3.5pp
- All cycles
- 2024: R+3.5 2020: D+2.2 2016: R+3.5 2012: R+12.0 2008: R+10.6
Not yet ingested
- Civics
- —
Market trends
- HPI YoY
- ▼ -79.23%
- Current HPI
- 265.2743
- Rent YoY
- ▲ 1.40%
- Metro
- Phoenix-Mesa-Chandler, AZ
- State GDP YoY
- ▲ 4.54%
- F500 in state
- 20
Industry mix (Fortune 500 HQ in AZ)
| Industry | F500 HQs | Revenue |
|---|---|---|
| Technology | 2 | $13B |
|
||
| Mining / Metals | 1 | $23B |
|
||
| Environmental Services | 1 | $16B |
|
||
| Metals / Steel | 1 | $14B |
|
||
| Technology Distribution | 1 | $9B |
|
||
| Homebuilding | 1 | $8B |
|
||
Price history
-10.0% since first listed6 events — show timeline
- 2026-04-30 Listed $450,000 ARMLS
- 2026-04-29 Listing Removed — ARMLS
- 2026-01-13 Listed $450,000 ARMLS
- 2026-01-01 Listing Removed — ARMLS
- 2025-10-24 Price Changed $490,000 ARMLS
- 2025-04-30 Listed $500,000 ARMLS
Property tax history
+2.1%/yrLatest (2025): $1,647 · +1.4% YoY. Source: county tax records.
Cash-flow waterfall
monthlySold comps — $/sqft
last 12 mo · ≤1 miLoading sold comps…