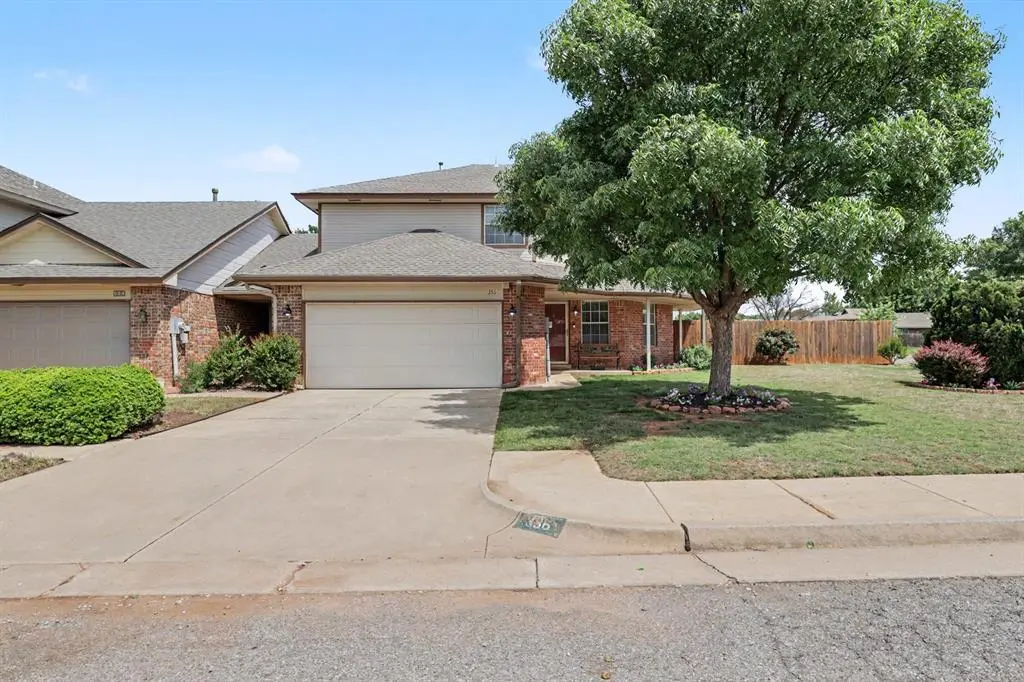
336 Lariat Cir · Edmond, OK
Flood risk 1/10 · Minimal
- FEMA flood zone
- X (unshaded)
- Chance of flooding over 30 yrs
- 0.0%
- Est. flood insurance / yr
- $507 – $1,088
Fire risk 3/10 · Minor
- Est. fire insurance / yr
- $2,463 – $4,575
Heat risk 6/10 · Moderate
- Hot days now (above 108°F)
- 7 days/yr
- Hot days in 30 yrs
- 19 days/yr
Wind risk 2/10 · Minimal
- Chance of severe wind over 30 yrs
- 3.0%
Air-quality risk 2/10 · Minimal
- Unhealthy air days now
- 2 days/yr
- Unhealthy air days in 30 yrs
- 2 days/yr
Risk factors via First Street. Map © Google.
Why this score? — see what drove the D+ grade
The composite is a weighted blend of 9 inputs, each scored 0–100. Each bar is that input's sub-score; the figure is the points it added to the 100-point composite (weight × sub-score).
- Cash flow +14.2/30.0
- ARV discount +10.5/15.0
- DSCR +4.3/10.0
- Livability +3.9/5.0
- Schools +3.6/10.0
- Rent growth +3.5/5.0
- 1% rule +3.2/10.0
- Condition / age +2.5/5.0
- Appreciation +0.0/10.0
$219,950
🖨 Deal sheet (PDF) 📄 Offer letter ✓ Due diligence
Listing remarks MLS
you cannot find a nicer home for the $$$- Easy to show Co-list with Gordon Wyhn
Key facts
- Winding staircase
- Brick fireplace
- Walk-in closet
Tags
Property features AI
Finance
- Other: Homestead exempt; Vacant and available; Open house scheduled (public)
- Financial info: Property is not assumable
- HOA & community: No mandatory association dues
Exterior
- Parking: Detached 2-car garage
- Home design: Townhouse; Two levels; Residential property; Located in Chisholm Lake Twnhms
- Construction: Brick and frame construction; Composition roof; Slab foundation; Existing property
- Exterior features: Corner lot; Storm shelter; No notable exterior features listed
Interior
- Kitchen: Built-in electric range; Electric oven
- Bedrooms: 3 bedrooms
- Bathrooms: 2 full bathrooms; 1 half bathroom
- Interior features: Dishwasher; Refrigerator; Gas log fireplace; One living area; One dining area
- Laundry & utility: Slab foundation (utility access at slab)
Neighborhood map
What this means for you Summary
Snapshot
- This is a 3-bed/3.0-bath townhouse listed at $220k.
Deal economics
- At list price, monthly cash flow is $37 ($444/yr) — positive.
- The deal already cash-flows at list — no discount required.
- To meet the 1% rule (rent ≥ 1% of price), the offer needs to be $181k (17.6% below list).
- Recommended offer: $181k (17.6% below list) — sets the bar for 1% rule.
- Cap rate 6.5% vs local median 3.4% in Edmond — top-decile yield for the area; either an underpriced asset or a hidden risk that comps aren't pricing in. Stress-test before assuming the spread holds.
Location & tenants
- Location reads 78/100 on livability (#6 in OK, #2,383 nationally) — a middle-class / working-renter tenant base. Strengths: employment A+, housing A+, crime A-; Watch: health & safety C-, commute F.
- Edmond (suburban): math 38% / reading 40% proficiency, ranked #11 of 270 in OK (top 4%) — families likely to look elsewhere, expect single-tenant / working-renter base with shorter leases.
- Zoned schools: Sunset Es (math 18% / reading 18%, grade F, #534 of 845 statewide, top 64%, 670 students, 0% FRL); Central Ms (math 40% / reading 42%, grade F, #5 of 345 statewide, top 1%, 980 students, 0% FRL); Santa Fe Hs (math 36% / reading 52%, grade F, #18 of 447 statewide, top 4%, 2,796 students, 0% FRL) — zoned schools average 0% FRL vs 22% district-wide (22 pts lower); this property's tenant base skews higher-income than the district average.
- Market conditions: Rents rising (+3.9%/yr); 220 active listings in the ZIP; 40 comparable units currently listed for rent nearby; rentals leasing fast (median 14d on market — plan ~1-2 weeks tenant-placement turnaround); solid renter incomes; 5,365 units permitted in Oklahoma County in 2024 (569 in 5+ unit buildings).
Forward outlook
- Local home prices are declining (-3.0%/yr); year-one equity from $2k of loan paydown is wiped out by about $7k of value loss. Plan a longer hold.
- Oklahoma County population projected at +41% by 2050 — long-run rental-demand tailwind backs the buy-and-hold thesis.
Negotiation context
- It's been on market 16 days — a 2% lower offer ($217k) is reasonable based on typical stale-listing flexibility.
- 2 sale attempts since 26y ago with the ask held roughly flat each time — persistent listings suggest the price (not the market) is what's stuck; bring a comps-based counter.
- Current owner paid $95k; list at $220k implies a 132% gain — meaningful room to come down on a strong offer.
Risks & watch-outs
- Climate carrying-cost: extreme-heat days projected 7→19/yr by 2055 (HVAC capex compounding) — expect insurance premiums to compound above CPI over the hold.
Questions for the listing agent
- Is there a deadline driving the sale (1031 exchange, divorce, estate, relocation)? That informs how much negotiation room exists.
- Schools are A-rated — typically a magnet for longer-tenancy family renters. What's the average tenant stay here, and is there a school-zone premium baked into asking?
- The area grade is low — what's the realistic commute time and amenity access for the typical tenant pool here? Any planned neighborhood developments (good or bad) we should know about?
- What's the average days-on-market for RENTAL listings here right now (not sales)? A rising rental-DOM trend means longer vacancies and softer asking-rent achievability than the comps imply.
- What's the recent tenant-quality profile in this submarket — average credit score on applications, eviction rate, late-payment / NSF rate, and stable-employment percentage? A property-management company in the area should have these aggregated.
- How much new for-sale + rental construction is in the pipeline within 1–3 miles? Heavy new supply typically softens prices + rents 12–24 months out; constrained supply supports both.
Investment metrics
- 1% rule
- 0.82% ✗
- Cap rate
- 6.49%
- Cash-on-cash
- 0.72%
- DSCR
- 1.03
- GRM
- 10.1
CMA / ARV
- ARV (on-the-fly)
- $235,760
- Comps found
- 12
Show comp detail 12 sales within ~0.75 mi
| Address | Dist | Beds/Ba | Sqft | Sold | Price | $/sf | Match |
|---|---|---|---|---|---|---|---|
| 117 Woodbridge Cir | 0.47mi | 3/2.0 | 1,621 (-4%) | 1mo | $240,000 | $148 | 67 |
| 2333 Glenrock | 0.40mi | 3/2.0 | 1,767 (+5%) | 4mo | $240,000 | $136 | 66 |
| 637 Doe Trl | 0.49mi | 3/2.0 | 1,718 (+2%) | 9mo | $240,000 | $140 | 62 |
| 2317 Glenrock | 0.38mi | 2/2.0 (-1) | 1,647 (-2%) | 11mo | $230,500 | $140 | 60 |
| 509 S Santa Fe Ave #163 | 0.46mi | 2/2.0 (-1) | 1,600 (-5%) | 6mo | $233,000 | $146 | 56 |
| 1640 Laurel Pl | 0.16mi | 2/2.0 (-1) | 1,437 (-15%) | 4mo | $216,500 | $151 | 56 |
| 2316 Sweetwater St | 0.45mi | 2/2.0 (-1) | 1,756 (+4%) | 10mo | $225,000 | $128 | 54 |
| 2329 Big Horn | 0.42mi | 2/2.5 (-1) | 1,527 (-9%) | 14mo | $179,000 | $117 | 46 |
| 2320 Big Horn | 0.42mi | 2/2.5 (-1) | 1,552 (-8%) | 19mo | $182,000 | $117 | 44 |
| 509 S Santa Fe Ave #103 | 0.46mi | 2/2.0 (-1) | 1,556 (-8%) | 18mo | $250,000 | $161 | 42 |
| 119 Woodbridge Cir | 0.48mi | 3/2.0 | 1,894 (+12%) | 18mo | $162,005 | $86 | 38 |
| 509 S Santa Fe Ave #146 | 0.46mi | 2/2.0 (-1) | 1,463 (-13%) | 21mo | $235,000 | $161 | 30 |
Match score weights: distance 35% · size 25% · config 20% · recency 20%. Top-matched comps best support the ARV.
Projected returns pro-forma
-3.0% appreciation · 3.86% rent growth · sell at horizon
- IRR
- -14.3%
- Equity multiple
- 0.48×
- Total profit
- $-31,752
- Equity at exit
- $32,795
- IRR
- -4.3%
- Equity multiple
- 0.70×
- Total profit
- $-18,213
- Equity at exit
- $19,017
Cash invested: $61,586 (down + closing). Projections, not guarantees.
Landlord ↔ Tenant lean methodology
- Overall (STATE)
- 83 Strongly Landlord-Friendly
- State Oklahoma
- 83 Strongly Landlord-Friendly · R+20
- County
- — inherits STATE
- City
- — inherits STATE
ZIP-level market 73003
- Home prices YoY
- -31.2%
- Rents YoY
- 3.9%
- Active inventory
- 220
- Price-to-rent
- 10.1×
Monthly cashflow live
- Estimated rent
- $1,812 high interval (Pro) →
- Mortgage (P&I)
- −$1,153
- Tax from tax record
- −$149 /mo · $1,792/yr
- Insurance
- −$92
- HOA
- −$0
- Vacancy / Maint / Mgmt
- −$381
- Net cashflow
- $37
Break-even live
Sensitivity live
| Price | -10% $162 | -5% $99 | +0% $37 | +5% $-25 | +10% $-87 |
|---|---|---|---|---|---|
| Rent | -10% $-106 | -5% $-35 | +0% $37 | +5% $109 | +10% $180 |
| Rate | -1.0pp $148 | -0.5pp $93 | base $37 | +0.5pp $-20 | +1.0pp $-78 |
UW: 25.0% down · 7.5% · 30yr · 1.5% tax · 5.0% vac · 8.0% maint · 8.0% mgmt
Financing live
Cash to close
- Down payment
- $54,988
- Closing costs
- $6,598
- Reserves months
- —
- Total cash needed
- —
Loan-product check · same deal, 3 products live
Conventional
25% down · 7.5% · 30yr
- Down + closing
- —
- Monthly P&I
- —
- Monthly cashflow
- —
- DSCR
- —
- Eligible?
- —
Personal DTI + credit; lowest rate.
DSCR
20% down · 8.5% · 30yr
- Down + closing
- —
- Monthly P&I
- —
- Monthly cashflow
- —
- DSCR
- —
- Eligible?
- —
No personal income docs; deal must DSCR.
Hard money
10% down · 12.0% · 12mo
- Down + closing
- —
- Monthly P&I
- —
- Monthly cashflow
- —
- DSCR
- —
- Eligible?
- —
Short-term bridge; refi at stabilization.
Rent comps 40 comps
| Address | Beds | Baths | Sqft | Rent | $/sqft | DOM | Units | Dist |
|---|---|---|---|---|---|---|---|---|
| 1808 Ada Sage Ln Edmond, OK | 3.0 | 2.0 | 1918 | $2,290 | $1.19 | 4d | 1 | 0.31mi |
| 804 Stag Trl Edmond, OK | 3.0 | 2.0 | 1250 | $1,550 | $1.24 | 25d | 1 | 0.47mi |
| 804 Stag Trl Edmond, OK | 3.0 | 2.0 | 1250 | $1,550 | $1.24 | 6d | 1 | 0.47mi |
| 1504 Apollo Rd Edmond, OK | 3.0 | 2.0 | 1435 | $1,475 | $1.03 | 13d | 1 | 0.58mi |
| 313 Dooley Creek Ln Edmond, OK | 3.0 | 2.0 | 1295 | $1,595 | $1.23 | 25d | 1 | 0.61mi |
| 1129 Carpe Diem Ct Edmond, OK | 3.0 | 2.0 | 1250 | $1,595 | $1.28 | 6d | 1 | 0.62mi |
| 317 Dooley Creek Ln Edmond, OK | 3.0 | 2.0 | 1295 | $1,595 | $1.23 | 16d | 1 | 0.62mi |
| 1024 Carpe Diem Ct Edmond, OK | 3.0 | 2.0 | 1700 | $1,895 | $1.11 | 5d | 1 | 0.66mi |
| 1121 Charlton Rd Edmond, OK | 4.0 | 3.0 | 2072 | $2,300 | $1.11 | 4d | 1 | 0.66mi |
| 725 Lapwing Rd Edmond, OK | 3.0 | 2.0 | 1825 | $1,810 | $0.99 | 25d | 1 | 0.76mi |
| 800 Blake Ct Edmond, OK | 3.0 | 2.0 | 1742 | $1,825 | $1.05 | 4d | 1 | 0.76mi |
| 733 Lapwing Rd Edmond, OK | 2.0 | 2.0 | 1216 | $1,450 | $1.19 | 25d | 1 | 0.77mi |
| 1013 Kelly Park Rd Edmond, OK | 4.0 | 2.0 | 1450 | $1,550 | $1.07 | 4d | 1 | 0.80mi |
| 1113 Countrywood Ln Edmond, OK | 3.0 | 2.0 | 1606 | $1,785 | $1.11 | 6d | 1 | 0.80mi |
| 808 Mars Cir Unit 1 Edmond, OK | 3.0 | 1.0 | 1401 | $1,375 | $0.98 | 22d | 1 | 0.85mi |
| 913 Rolling Hills Ter Edmond, OK | 3.0 | 2.0 | 1829 | $1,895 | $1.04 | 6d | 1 | 0.86mi |
| 17629 Nantucket Ave Edmond, OK | 3.0 | 2.0 | 1632 | $1,925 | $1.18 | 4d | 1 | 0.90mi |
| 1318 Pennington Ave Edmond, OK | 2.0 | 2.0 | 1150 | $1,300 | $1.13 | 25d | 1 | 0.90mi |
| 1404 S Gemini Rd Edmond, OK | 3.0 | 2.0 | 1267 | $1,650 | $1.30 | 23d | 1 | 0.91mi |
| 1404 S Gemini Rd Edmond, OK | 3.0 | 2.0 | 1267 | $1,650 | $1.30 | 25d | 1 | 0.91mi |
| 645 W 2nd St Edmond, OK | 3.0 | 2.0 | 1660 | $1,975 | $1.19 | 16d | 1 | 0.92mi |
| 1321 Kelly Park Rd Edmond, OK | 4.0 | 2.0 | 1991 | $1,995 | $1.00 | 4d | 1 | 0.92mi |
| 604A NW 175th St Unit 604A Edmond, OK | 4.0 | 2.5 | 1968 | $1,900 | $0.97 | 25d | 1 | 0.95mi |
| 612 W 2nd St Unit 100 Edmond, OK | 3.0 | 2.5 | 1414 | $1,895 | $1.34 | 23d | 1 | 0.96mi |
| 525 NW 171st St Edmond, OK | 3.0 | 2.0 | 1607 | $1,900 | $1.18 | 4d | 1 | 0.98mi |
| 1909 Fountain Vw Edmond, OK | 3.0 | 2.0 | 1506 | $1,999 | $1.33 | 4d | 1 | 1.01mi |
| 1015 Swan Lake Ct Edmond, OK | 2.0 | 2.0 | 1200 | $1,295 | $1.08 | 25d | 1 | 1.01mi |
| 1015 Swan Lake Ct Edmond, OK | 2.0 | 2.0 | 1200 | $1,295 | $1.08 | 6d | 1 | 1.01mi |
| 1120 Mars Rd Edmond, OK | 4.0 | 2.0 | 1917 | $1,745 | $0.91 | 6d | 1 | 1.01mi |
| 17116 Sunny Hollow Rd Edmond, OK | 4.0 | 2.5 | 1690 | $2,100 | $1.24 | 4d | 1 | 1.08mi |
| 16420 Del Mar Dr Edmond, OK | 3.0 | 2.0 | 1404 | $1,741 | $1.24 | 13d | 1 | 1.08mi |
| 620 Winding Ln Edmond, OK | 3.0 | 2.0 | 1133 | $1,550 | $1.37 | 4d | 1 | 1.13mi |
| 2116 Camino del Plaza Ln Edmond, OK | 3.0 | 2.0 | 1396 | $1,645 | $1.18 | 25d | 1 | 1.16mi |
| 15 S Walnut St Edmond, OK | 2.0 | 1.0 | 1162 | $1,400 | $1.20 | 25d | 1 | 1.16mi |
| 2172 Camino del Plaza Ln Edmond, OK | 3.0 | 2.0 | 1287 | $1,600 | $1.24 | 6d | 1 | 1.16mi |
| 2172 Camino del Plaza Ln Edmond, OK | 3.0 | 2.0 | 1274 | $1,600 | $1.26 | 25d | 1 | 1.16mi |
| 2125 Buena Vida Ln Edmond, OK | 3.0 | 2.5 | 1458 | $1,699 | $1.17 | 4d | 1 | 1.17mi |
| 2149 Buena Vida Ln Edmond, OK | 3.0 | 2.5 | 1300 | $1,645 | $1.27 | 4d | 1 | 1.18mi |
| 541 S Fretz Ave Edmond, OK | 2.0 | 2.5 | 1682 | $1,795 | $1.07 | 25d | 1 | 1.19mi |
| 463 S Fretz Ave Edmond, OK | 2.0 | 2.0 | 1550 | $1,695 | $1.09 | 16d | 1 | 1.19mi |
Listing history 8 events
-
2026-05-24status Pending
-
2026-05-16price $219,950
-
2026-04-30$225,900 Active
-
2000-08-23soldstatus $95,000
-
2000-08-21soldstatus $95,000 80-char remark
Show marketing remark (80 chars)
you cannot find a nicer home for the $$$- Easy to show Co-list with Gordon Wyhn
-
2000-05-04$99,900 80-char remark
Show marketing remark (80 chars)
you cannot find a nicer home for the $$$- Easy to show Co-list with Gordon Wyhn
-
1998-11-02soldstatus $76,000
-
1994-07-20soldstatus $72,000
ⓘ Source: listings_history table (triggers on properties + properties_extension) + one-shot
backfill from property_details.listing_events for pre-trigger history.
Tax reassessment forecast OK · Resets to sale price
- Current annual tax
- $1,792 · $149/mo
- Projected year-2 tax
- $1,980 · $165/mo
- Expected delta
- +$188/yr (+$16/mo · 10.5%)
ⓘ Screening estimate from a state-policy table — verify with the county assessor before closing.
Climate risk First Street
- Flood 1/10 Low FEMA zone X (unshaded) · 0% chance over 30 yrs
- Wildfire 3/10 Moderate
- Heat 6/10 Major 7 d/yr ≥108°F today · 19 d/yr by 30 yrs out
- Wind 2/10 Low 3% chance of damaging wind over 30 yrs
- Air quality 2/10 Low 2 unhealthy d/yr today · 2 by 30 yrs out
Nearby sold comps map
Loading sold comps map…
Walkable amenities ~0.75 mi
Loading nearby amenities…
Taxation est. · year 1
- Rental income
- $21,743
- − Mortgage interest
- −$12,321
- − Property taxes
- −$1,792
- − Insurance
- −$1,100
- − Repairs & maintenance
- −$1,739
- − Management
- −$1,739
- − Depreciation
- −$6,399
- Taxable loss
- −$3,346
- Est. tax savings @ 24.0%
- +$803
- After-tax cash flow
- $1,247/yr
For passive investors: Depreciation is non-cash, so a rental often shows a tax loss while cash-flowing — sheltering income. Rental losses are passive: they offset passive income freely, and up to $25,000/yr can offset ordinary (W-2) income if you actively participate and your MAGI is under $100k (phasing out to $0 by $150k); unused losses carry forward. On sale, claimed depreciation is recaptured at up to 25%, and gains may owe capital-gains tax (a 1031 exchange can defer both). Figures are a year-1 estimate at your 24.0% rate — not tax advice; consult a CPA.
Schools (NCES district)
- District
- Edmond
- NCES district ID
- 4010590
- Math proficiency
- 38% ▼ -12.00%
- Reading proficiency
- 40% ▼ -12.00%
- Median HH income
- $73,212
- Composite
- 35.88/100
- National rank
- #4814
- State rank
- #11 of 270 in OK
Livability — Edmond
- Score
- 78/100
- State rank
- #6
- US rank
- #2383
Category grades
Schools grade is shown separately in the Schools card above.
Census & demographics
- Census place
- Edmond, OK
- County
- Oklahoma County · 771,644 people
- City population
- 177,083
- Metro
- Oklahoma City, OK
- Population (ZIP)
- 23,236
- Household income
- $78,149
- Rent vs Own
- Severe rent burden
- 988.0
Population outlook (Oklahoma County) Hauer SSP2
- Today (2025)
- 911,875 people
- By 2030
- 982,413 · +7.7%
- By 2040
- 1,130,468 · +24.0%
- By 2050
- 1,288,422 · +41.3%
- By 2075
- 1,711,482 · +87.7%
- By 2100
- 2,088,448 · +129.0%
Race, ethnicity, and origin ACS 2023
- Neighborhood character
- Predominantly White (69%)
- Race & ethnicity
- White 69% Two or more races 13% Black 9% Hispanic / Latino 9% Asian 3%
- Hispanic origin (detail)
- Mexican 7%
- Common ancestry
- Italian 2% Slovak 2% Lithuanian 1%
- Foreign-born
- 8% · Canada, China
- Languages at home
- 90% English-only · Spanish 5% Other Indo-European 2% Chinese 1%
Political lean MEDSL · Oklahoma
- 2024 margin
- Toss-up / Even · D 48.0% · R 49.7% · Other 2.3%
- 2008→2024 swing
- +15.1pp toward D · 2008: -16.8pp · 2024: -1.7pp
- All cycles
- 2024: R+1.7 2020: R+1.1 2016: R+10.5 2012: R+16.7 2008: R+16.8
Not yet ingested
- Civics
- —
Market trends
- HPI YoY
- ▼ -104.15%
- Current HPI
- 229.3899
- Rent YoY
- ▲ 3.86%
- Metro
- Oklahoma City, OK
- State GDP YoY
- ▲ 1.55%
- F500 in state
- 6
Industry mix (Fortune 500 HQ in OK)
| Industry | F500 HQs | Revenue |
|---|---|---|
| Energy | 3 | $48B |
|
||
Price history
+205.5% since first listed8 events — show timeline
- 2026-05-24 Pending — MLSOK
- 2026-05-16 Price Changed $219,950 MLSOK
- 2026-04-30 Listed $225,900 MLSOK
- 2000-08-23 Sold (Public Records) $95,000 Public Records
- 2000-08-21 Sold (MLS) $95,000 MLSOK
- 2000-05-04 Listed $99,900 MLSOK
- 1998-11-02 Sold (Public Records) $76,000 Public Records
- 1994-07-20 Sold (Public Records) $72,000 Public Records
Property tax history
+0.7%/yrLatest (2025): $1,792 · +0.1% YoY. Source: county tax records.
Cash-flow waterfall
monthlySold comps — $/sqft
last 12 mo · ≤1 miLoading sold comps…