939 Whisperwood Dr · Onalaska, TX
Flood risk No data
- FEMA flood zone
- —
- Chance of flooding over 30 yrs
- —
- Est. flood insurance / yr
- —
Fire risk No data
- Est. fire insurance / yr
- —
Heat risk No data
- Hot days now (above threshold)
- —
- Hot days in 30 yrs
- —
Wind risk No data
- Chance of severe wind over 30 yrs
- —
Air-quality risk No data
- Unhealthy air days now
- —
- Unhealthy air days in 30 yrs
- —
Risk factors via First Street. Map © Google.
Why this score? — see what drove the F grade
The composite is a weighted blend of 9 inputs, each scored 0–100. Each bar is that input's sub-score; the figure is the points it added to the 100-point composite (weight × sub-score).
- ARV discount +7.5/15.0
- Cash flow +6.6/30.0
- Appreciation +4.7/10.0
- Schools +4.1/10.0
- Livability +3.0/5.0
- Rent growth +2.5/5.0
- Condition / age +2.5/5.0
- 1% rule +1.7/10.0
- DSCR +0.9/10.0
$169,900
🖨 Deal sheet (PDF) 📄 Offer letter ✓ Due diligence
Listing remarks
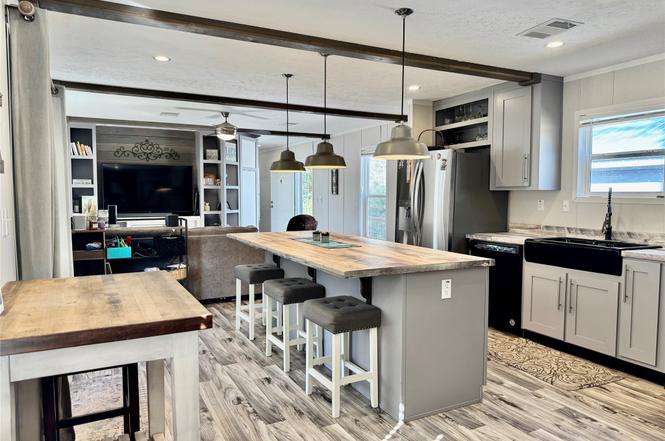
Discover this beautiful 3-bedroom, 2-bathroom home nestled on a peaceful cul-de-sac. The spacious kitchen features a large island, upgraded fixtures, and modern appliances. It has a coffee bar for you to enjoy your cup of coffee or tea. Relax and entertain on the expansive screened patio overlooking the beautifully landscaped yard, with over $10,000 invested in landscaping and fence improvements. Situated on a large, wooded pie-shaped lot, this home offers privacy and tranquility. Plus, enjoy the convenience of a 22x30 garage with a loft for extra storage. The subdivision has a large pool, a basketball and a volleyball court as well as a club house and watercraft storage. Survey is availabl
Key facts
- Screened patio
- Wooded lot
- Large island
Tags
Property features AI
Finance
- HOA & community: Part of Twin Harbors association; Association amenities: basketball court, boat ramp, clubhouse, picnic area, pool, tennis courts; Association fee $120 annually
Exterior
- Parking: Detached 2-car garage with workshop in garage
- Utilities: Public water; Public sewer
- Home design: Residential property; Built in 2021
- Construction: Vinyl siding; Composition roof; Block foundation
- Exterior features: Cleared lot; Cul-de-sac location; Subdivision setting; Wooded areas; Association pool
Interior
- Kitchen: Dishwasher; Electric oven; Electric range; Microwave
- Bedrooms: Primary bedroom (First floor); Bedroom (First floor); Bedroom (First floor); Living room (First floor)
- Flooring: Vinyl
- Bathrooms: 2 full bathrooms
- Heating & cooling: Central heating (electric); Central air (electric)
- Interior features: Kitchen island; Kitchen/family room combo; Kitchen/dining combo; Living/dining room
- Laundry & utility: Electric dryer hookup
Neighborhood map
What this means for you Summary
Snapshot
- This is a 3-bed/2.0-bath land listed at $170k.
Deal economics
- At list price, monthly cash flow is $-280 ($-3k/yr) — negative.
- To cash-flow at today's rent, offer at most $129k (23.9% below list).
- To meet the 1% rule (rent ≥ 1% of price), the offer needs to be $114k (32.7% below list).
- Recommended offer: $114k (32.7% below list) — sets the bar for 1% rule.
- Cap rate 4.3% vs local median 2.8% in Onalaska — top-decile yield for the area; either an underpriced asset or a hidden risk that comps aren't pricing in. Stress-test before assuming the spread holds.
Location & tenants
- Location reads 60/100 on livability (#1,055 in TX) — a middle-class / working-renter tenant base. Strengths: cost of living A+, housing A+; Watch: employment C-, crime D+, amenities F.
- Onalaska ISD (rural): math 50% / reading 48% proficiency, ranked #213 of 826 in TX (top 26%) — families likely to look elsewhere, expect single-tenant / working-renter base with shorter leases.
- Zoned schools: Onalaska El (math 52% / reading 42%, grade D-, #1,006 of 4,322 statewide, top 25%, 712 students, 70% FRL); Onalaska Jr/Sr High (math 48% / reading 55%, grade D+, #478 of 1,632 statewide, top 29%, 527 students, 58% FRL).
- Market conditions: 353 active listings in the ZIP; 2 comparable units currently listed for rent nearby; 769 units permitted in Polk County in 2024 (0 in 5+ unit buildings).
Forward outlook
- In year one you build about $141 of equity ($1k loan paydown + $-1k appreciation (-0.6% local appreciation)).
- Polk County population projected at +16% by 2050 — long-run rental-demand tailwind backs the buy-and-hold thesis.
Negotiation context
- It's been on market 104 days — a 9% lower offer ($155k) is reasonable based on typical stale-listing flexibility.
- 2 sale attempts; this cycle's ask has dropped $12k (7%) from the opening price — seller is motivated, your offer sets the floor, not the list.
Questions for the listing agent
- What do current leases actually rent for vs. the listed asking? Can we see a recent rent roll and the last 12 months of T-12 income?
- It's been on market 104 days. Have you received any prior offers? Is the seller open to a 33% concession, seller financing, or rate buy-down credit?
- What does the HOA fee cover, when was the last increase, and are there any pending special assessments or reserve-fund shortfalls?
- Why hasn't it sold? Are there any deal-killer items the seller is aware of (foundation, flood, title, zoning, code violations)?
- Is there a deadline driving the sale (1031 exchange, divorce, estate, relocation)? That informs how much negotiation room exists.
- Schools are D-rated, which usually means shorter tenancies and higher turnover. Who's the typical renter profile here, and what's been the actual vacancy rate?
- Crime grade is D in this area — have there been break-ins, vandalism, or insurance claims at this property in the last 3 years? What carrier currently insures it and at what premium?
- The area grade is low — what's the realistic commute time and amenity access for the typical tenant pool here? Any planned neighborhood developments (good or bad) we should know about?
- What's the average days-on-market for RENTAL listings here right now (not sales)? A rising rental-DOM trend means longer vacancies and softer asking-rent achievability than the comps imply.
- What's the recent tenant-quality profile in this submarket — average credit score on applications, eviction rate, late-payment / NSF rate, and stable-employment percentage? A property-management company in the area should have these aggregated.
- How much new for-sale + rental construction is in the pipeline within 1–3 miles? Heavy new supply typically softens prices + rents 12–24 months out; constrained supply supports both.
Investment metrics
- 1% rule
- 0.67% ✗
- Cap rate
- 4.31%
- Cash-on-cash
- -7.07%
- DSCR
- 0.69
- GRM
- 12.4
CMA / ARV
No comps found within radius.
Projected returns pro-forma
-0.61% appreciation · 3.0% rent growth · sell at horizon
- IRR
- -13.1%
- Equity multiple
- 0.42×
- Total profit
- $-27,603
- Equity at exit
- $44,226
- IRR
- -6.5%
- Equity multiple
- 0.37×
- Total profit
- $-29,920
- Equity at exit
- $49,240
Cash invested: $47,572 (down + closing). Projections, not guarantees.
Landlord ↔ Tenant lean methodology
- Overall (STATE)
- 87 Strongly Landlord-Friendly
- State Texas
- 87 Strongly Landlord-Friendly · R+5
- County
- — inherits STATE
- City
- — inherits STATE
ZIP-level market 77360
- Home prices YoY
- -0.4%
- Active inventory
- 353
- Price-to-rent
- 12.4×
Monthly cashflow live
- Estimated rent
- $1,144 medium interval (Pro) →
- Mortgage (P&I)
- −$891
- Tax est. 1.5%
- −$212 /mo · $2,548/yr
- Insurance
- −$71
- HOA
- −$10
- Lot rent
- −$0
- Vacancy / Maint / Mgmt
- −$240
- Net cashflow
- $-280
Break-even live
Sensitivity live
| Price | -10% $-163 | -5% $-222 | +0% $-280 | +5% $-339 | +10% $-398 |
|---|---|---|---|---|---|
| Rent | -10% $-371 | -5% $-326 | +0% $-280 | +5% $-235 | +10% $-190 |
| Rate | -1.0pp $-195 | -0.5pp $-237 | base $-280 | +0.5pp $-324 | +1.0pp $-369 |
UW: 25.0% down · 7.5% · 30yr · 1.5% tax · 5.0% vac · 8.0% maint · 8.0% mgmt
Financing live
Cash to close
- Down payment
- $42,475
- Closing costs
- $5,097
- Reserves months
- —
- Total cash needed
- —
Loan-product check · same deal, 3 products live
Conventional
25% down · 7.5% · 30yr
- Down + closing
- —
- Monthly P&I
- —
- Monthly cashflow
- —
- DSCR
- —
- Eligible?
- —
Personal DTI + credit; lowest rate.
DSCR
20% down · 8.5% · 30yr
- Down + closing
- —
- Monthly P&I
- —
- Monthly cashflow
- —
- DSCR
- —
- Eligible?
- —
No personal income docs; deal must DSCR.
Hard money
10% down · 12.0% · 12mo
- Down + closing
- —
- Monthly P&I
- —
- Monthly cashflow
- —
- DSCR
- —
- Eligible?
- —
Short-term bridge; refi at stabilization.
Rent comps 2 comps
| Address | Beds | Baths | Sqft | Rent | $/sqft | DOM | Units | Dist |
|---|---|---|---|---|---|---|---|---|
| 120 Farm to Market Road 356 Unit 4 Onalaska, TX | 2.0 | 1.0 | 754 | $875 | $1.16 | 46d | 1 | 0.77mi |
| 132 Broken Arrow Onalaska, TX | 3.0 | 2.0 | 1000 | $1,400 | $1.40 | 46d | 1 | 0.98mi |
HOA detail
- Monthly dues
- $10 · $120/yr
- Likely covers
- waterlandscapingpool
Listing history 23 events
-
2026-06-21days on market $169,900 Active 104 DOM
-
2026-06-19days on market $169,900 Active 102 DOM
-
2026-06-18days on market $169,900 Active 101 DOM
-
2026-06-17days on market $169,900 Active 100 DOM
-
2026-06-16days on market $169,900 Active 99 DOM
-
2026-06-15days on market $169,900 Active 98 DOM
-
2026-06-14days on market $169,900 Active 96 DOM
-
2026-06-13days on market $169,900 Active 95 DOM
-
2026-06-10days on market $169,900 Active 93 DOM
-
2026-06-09days on market $169,900 Active 92 DOM
-
2026-06-08days on market $169,900 Active 91 DOM
-
2026-06-07days on market $169,900 Active 90 DOM
-
2026-06-05days on market $169,900 Active 87 DOM
-
2026-06-03days on market $169,900 Active 86 DOM
-
2026-06-02days on market $169,900 Active 85 DOM
-
2026-06-01days on market $169,900 Active 84 DOM
-
2026-05-31days on market $169,900 Active 83 DOM
-
2026-05-30days on market $169,900 Active 82 DOM
-
2026-05-17status Active
-
2026-05-17price $169,900
-
2025-05-22historical
-
2025-04-17price $178,500
-
2025-03-14$182,000 Active
ⓘ Source: listings_history table (triggers on properties + properties_extension) + one-shot
backfill from property_details.listing_events for pre-trigger history.
Nearby sold comps map
Loading sold comps map…
Walkable amenities ~0.75 mi
Loading nearby amenities…
Taxation est. · year 1
- Rental income
- $13,729
- − Mortgage interest
- −$9,517
- − Property taxes
- −$2,548
- − Insurance
- −$850
- − Repairs & maintenance
- −$1,098
- − Management
- −$1,098
- − HOA
- −$120
- − Depreciation
- −$4,943
- Taxable loss
- −$6,446
- Est. tax savings @ 24.0%
- +$1,547
- After-tax cash flow
- $-1,817/yr
For passive investors: Depreciation is non-cash, so a rental often shows a tax loss while cash-flowing — sheltering income. Rental losses are passive: they offset passive income freely, and up to $25,000/yr can offset ordinary (W-2) income if you actively participate and your MAGI is under $100k (phasing out to $0 by $150k); unused losses carry forward. On sale, claimed depreciation is recaptured at up to 25%, and gains may owe capital-gains tax (a 1031 exchange can defer both). Figures are a year-1 estimate at your 24.0% rate — not tax advice; consult a CPA.
Schools (NCES district)
- District
- Onalaska ISD
- NCES district ID
- 4833690
- Math proficiency
- 50% ▼ -10.00%
- Reading proficiency
- 48% ▼ -1.00%
- Median HH income
- $38,882
- Composite
- 40.91/100
- National rank
- #3616
- State rank
- #213 of 826 in TX
Livability — Onalaska
- Score
- 60/100
- State rank
- #1055
- US rank
- #18716
Category grades
Schools grade is shown separately in the Schools card above.
Census & demographics
- Census place
- Onalaska, TX
- Population (ZIP)
- 6,130
Population outlook (Polk County) Hauer SSP2
- Today (2025)
- 51,049 people
- By 2030
- 53,243 · +4.3%
- By 2040
- 56,528 · +10.7%
- By 2050
- 59,243 · +16.1%
- By 2075
- 63,528 · +24.4%
- By 2100
- 60,376 · +18.3%
Race, ethnicity, and origin ACS 2023
- Neighborhood character
- Predominantly White (86%)
- Race & ethnicity
- White 86% Two or more races 10% Hispanic / Latino 8%
- Hispanic origin (detail)
- Mexican 7%
- Common ancestry
- Lithuanian 4% Italian 2% Romanian 2%
- Foreign-born
- 1% · Canada
- Languages at home
- 95% English-only · Spanish 5%
Political lean MEDSL · Polk
- 2024 margin
- Solid R (+58.9) · D 20.2% · R 79.1%
- 2008→2024 swing
- -21.7pp toward R · 2008: -37.2pp · 2024: -58.9pp
- All cycles
- 2024: R+58.9 2020: R+54.5 2016: R+56.5 2012: R+48.2 2008: R+37.2
Not yet ingested
- Civics
- —
Market trends
- HPI YoY
- ▼ -0.61%
- Current HPI
- 150.9486
- Rent YoY
- —
- Metro
- —
- State GDP YoY
- ▲ 3.95%
- F500 in state
- 110
Industry mix (Fortune 500 HQ in TX)
| Industry | F500 HQs | Revenue |
|---|---|---|
| Energy | 16 | $1,198B |
|
||
| Technology | 5 | $198B |
|
||
| Engineering / Construction | 4 | $72B |
|
||
| Energy Services | 3 | $60B |
|
||
| Utilities | 3 | $41B |
|
||
| Healthcare | 2 | $330B |
|
||
Price history
-6.6% since first listed5 events — show timeline
- 2026-05-17 Relisted — HARMLS
- 2026-05-17 Price Changed $169,900 HARMLS
- 2025-05-22 Listing Removed — HARMLS
- 2025-04-17 Price Changed $178,500 HARMLS
- 2025-03-14 Listed $182,000 HARMLS
Property tax history
+5.2%/yrLatest (2025): $301 · +0.2% YoY. Source: county tax records.
Cash-flow waterfall
monthlySold comps — $/sqft
last 12 mo · ≤1 miLoading sold comps…