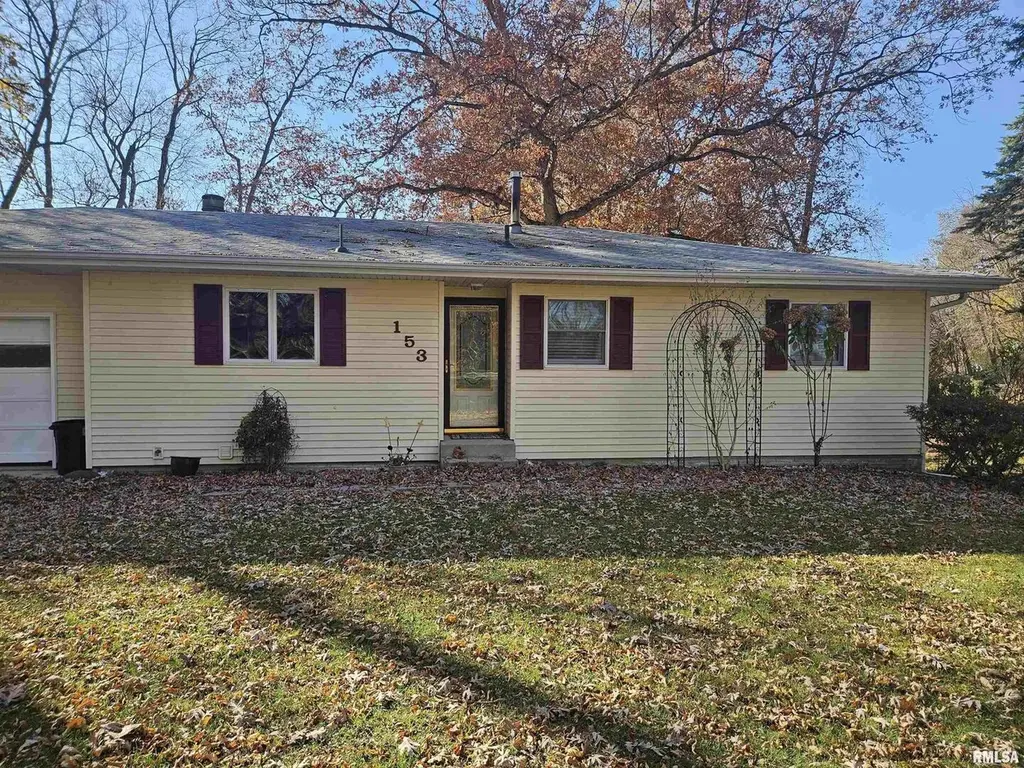
153 Deer Park Dr · Geneseo, IL
Flood risk 1/10 · Minimal
- FEMA flood zone
- X (unshaded)
- Chance of flooding over 30 yrs
- 0.0%
- Est. flood insurance / yr
- $473 – $860
Fire risk 1/10 · Minimal
- Est. fire insurance / yr
- $804 – $1,492
Heat risk 3/10 · Minor
- Hot days now (above 104°F)
- 7 days/yr
- Hot days in 30 yrs
- 17 days/yr
Wind risk 2/10 · Minimal
- Chance of severe wind over 30 yrs
- —
Air-quality risk 3/10 · Minor
- Unhealthy air days now
- 2 days/yr
- Unhealthy air days in 30 yrs
- 3 days/yr
Risk factors via First Street. Map © Google.
Why this score? — see what drove the D- grade
The composite is a weighted blend of 9 inputs, each scored 0–100. Each bar is that input's sub-score; the figure is the points it added to the 100-point composite (weight × sub-score).
- Cash flow +16.2/30.0
- DSCR +5.0/10.0
- 1% rule +4.9/10.0
- Livability +4.2/5.0
- Rent growth +2.5/5.0
- Condition / age +2.5/5.0
- Schools +2.3/10.0
- ARV discount +0.0/15.0
- Appreciation +0.0/10.0
$215,000
🖨 Deal sheet (PDF) 📄 Offer letter ✓ Due diligence
Listing remarks
153 Deer Park Drive presents a 3 Bed/1 Bath ranch set on a spacious . 92-acre double lot. This home features an attached 2-car garage and a full basement complete with a wood-burning fireplace, offering excellent potential for additional living space, storage, or future finishing. The main level provides a practical and efficient layout with all living areas conveniently on one floor. An included adjacent lot adds exceptional value and flexibility-perfect for expanding outdoor living, future building opportunities, or simply enjoying extra space and privacy. Located in a neighborhood setting with a more open feel, this property offers the best of both worlds. Discover the possibilities wait
Key facts
- Attached garage
- Full basement
- Outdoor space
Tags
Neighborhood map
What this means for you Summary
Snapshot
- This is a 3-bed/1.0-bath single-family listed at $215k.
Deal economics
- At list price, monthly cash flow is $113 ($1k/yr) — positive.
- The deal already cash-flows at list — no discount required.
- To meet the 1% rule (rent ≥ 1% of price), the offer needs to be $213k (0.8% below list).
- Recommended offer: $189k (12.0% below list) — sets the bar for market timing.
Location & tenants
- Location reads 83/100 on livability (#45 in IL, #907 nationally) — a professional / high-income tenant draw. Strengths: crime A+, cost of living A+, housing A+; Watch: commute F.
- Geneseo CUSD 228 (town): math 23% / reading 26% proficiency, ranked #297 of 620 in IL (top 48%) — low school quality limits family demand, transient renter base, plan for 1-2y turnover; only 18% free/reduced lunch — higher-income household profile.
- Zoned schools: Northside Elem School (math 27% / reading 27%, grade F, #749 of 2,056 statewide, top 40%, 331 students, 0% FRL); Geneseo Middle School (math 15% / reading 20%, grade F, #450 of 665 statewide, top 69%, 591 students, 0% FRL); Geneseo High School (math 32% / reading 42%, grade F, #107 of 693 statewide, top 17%, 809 students, 0% FRL) — zoned schools average 0% FRL vs 18% district-wide (18 pts lower); this property's tenant base skews higher-income than the district average.
- Market conditions: 73 active listings in the ZIP; 32 units permitted in Henry County in 2024 (0 in 5+ unit buildings).
Forward outlook
- Local home prices are declining (-3.0%/yr); year-one equity from $1k of loan paydown is wiped out by about $6k of value loss. Plan a longer hold.
- Henry County population projected at -16% by 2050 — secular population decline; favor cash flow + early exit over multi-decade hold.
Negotiation context
- It's been on market 145 days — a 12% lower offer ($189k) is reasonable based on typical stale-listing flexibility.
Questions for the listing agent
- It's been on market 145 days. Have you received any prior offers? Is the seller open to a 12% concession, seller financing, or rate buy-down credit?
- Built in 1969 — when were the roof, HVAC, electrical panel, plumbing, and water heater last replaced?
- What does the HOA fee cover, when was the last increase, and are there any pending special assessments or reserve-fund shortfalls?
- Why hasn't it sold? Are there any deal-killer items the seller is aware of (foundation, flood, title, zoning, code violations)?
- Is there a deadline driving the sale (1031 exchange, divorce, estate, relocation)? That informs how much negotiation room exists.
- Schools are D-rated, which usually means shorter tenancies and higher turnover. Who's the typical renter profile here, and what's been the actual vacancy rate?
- The area grade is low — what's the realistic commute time and amenity access for the typical tenant pool here? Any planned neighborhood developments (good or bad) we should know about?
- What's the average days-on-market for RENTAL listings here right now (not sales)? A rising rental-DOM trend means longer vacancies and softer asking-rent achievability than the comps imply.
- What's the recent tenant-quality profile in this submarket — average credit score on applications, eviction rate, late-payment / NSF rate, and stable-employment percentage? A property-management company in the area should have these aggregated.
- How much new for-sale + rental construction is in the pipeline within 1–3 miles? Heavy new supply typically softens prices + rents 12–24 months out; constrained supply supports both.
Investment metrics
- 1% rule
- 0.99% ✗
- Cap rate
- 6.92%
- Cash-on-cash
- 2.25%
- DSCR
- 1.10
- GRM
- 8.4
CMA / ARV
- ARV (median comp)
- $154,422
- List price
- $215,000
- Delta
- 39.23%
- Verdict
- OVERPRICED
- Comps
- 3 within 1.0 mi
Show comp detail 2 sales within ~0.75 mi
| Address | Dist | Beds/Ba | Sqft | Sold | Price | $/sf | Match |
|---|---|---|---|---|---|---|---|
| 147 Central Park Ave | 0.06mi | 2/2.0 (-1) | 1,105 (-1%) | 20mo | $144,000 | $130 | 70 |
| 147 Central Park Ave | 0.06mi | 2/2.0 (-1) | 1,105 (-1%) | 20mo | $144,000 | $130 | 70 |
Match score weights: distance 35% · size 25% · config 20% · recency 20%. Top-matched comps best support the ARV.
Projected returns pro-forma
-3.0% appreciation · 3.0% rent growth · sell at horizon
- IRR
- -12.7%
- Equity multiple
- 0.54×
- Total profit
- $-27,580
- Equity at exit
- $32,057
- IRR
- -3.6%
- Equity multiple
- 0.76×
- Total profit
- $-14,433
- Equity at exit
- $18,589
Cash invested: $60,200 (down + closing). Projections, not guarantees.
Landlord ↔ Tenant lean methodology
- Overall (STATE)
- 43 Moderately Tenant-Leaning
- State Illinois
- 43 Moderately Tenant-Leaning · D+7
- County
- — inherits STATE
- City
- — inherits STATE
ZIP-level market 61254
- Home prices YoY
- -32.0%
- Active inventory
- 73
- Price-to-rent
- 8.4×
Monthly cashflow live
- Estimated rent
- $2,133 medium interval (Pro) →
- Mortgage (P&I)
- −$1,127
- Tax from tax record
- −$322 /mo · $3,864/yr
- Insurance
- −$90
- HOA
- −$33
- Vacancy / Maint / Mgmt
- −$448
- Net cashflow
- $113
Break-even live
Sensitivity live
| Price | -10% $234 | -5% $173 | +0% $113 | +5% $52 | +10% $-9 |
|---|---|---|---|---|---|
| Rent | -10% $-56 | -5% $28 | +0% $113 | +5% $197 | +10% $281 |
| Rate | -1.0pp $221 | -0.5pp $167 | base $113 | +0.5pp $57 | +1.0pp $0 |
UW: 25.0% down · 7.5% · 30yr · 1.5% tax · 5.0% vac · 8.0% maint · 8.0% mgmt
Financing live
Cash to close
- Down payment
- $53,750
- Closing costs
- $6,450
- Reserves months
- —
- Total cash needed
- —
Loan-product check · same deal, 3 products live
Conventional
25% down · 7.5% · 30yr
- Down + closing
- —
- Monthly P&I
- —
- Monthly cashflow
- —
- DSCR
- —
- Eligible?
- —
Personal DTI + credit; lowest rate.
DSCR
20% down · 8.5% · 30yr
- Down + closing
- —
- Monthly P&I
- —
- Monthly cashflow
- —
- DSCR
- —
- Eligible?
- —
No personal income docs; deal must DSCR.
Hard money
10% down · 12.0% · 12mo
- Down + closing
- —
- Monthly P&I
- —
- Monthly cashflow
- —
- DSCR
- —
- Eligible?
- —
Short-term bridge; refi at stabilization.
HOA detail
- Monthly dues
- $33 · $396/yr
Listing history 18 events
-
2026-06-13days on market $215,000 Active 145 DOM
-
2026-06-10days on market $215,000 Active 143 DOM
-
2026-06-09days on market $215,000 Active 142 DOM
-
2026-06-08days on market $215,000 Active 141 DOM
-
2026-06-07days on market $215,000 Active 140 DOM
-
2026-06-02days on market $215,000 Active 135 DOM
-
2026-06-01days on market $215,000 Active 134 DOM
-
2026-05-31days on market $215,000 Active 133 DOM
-
2026-05-30days on market $215,000 Active 132 DOM
-
2026-02-06status Active
-
2026-02-06historical
-
2026-01-16status Active
-
2026-01-16status Pending
-
2026-01-14historical
-
2025-12-18status Pending
-
2025-12-18status Pending
-
2025-12-13historical
-
2025-12-02Active
ⓘ Source: listings_history table (triggers on properties + properties_extension) + one-shot
backfill from property_details.listing_events for pre-trigger history.
Tax reassessment forecast IL · Partial reset (capped growth)
- Current annual tax
- $3,864 · $322/mo
- Projected year-2 tax
- $4,372 · $364/mo
- Expected delta
- +$508/yr (+$42/mo · 13.2%)
ⓘ Screening estimate from a state-policy table — verify with the county assessor before closing.
Climate risk First Street
- Flood 1/10 Low FEMA zone X (unshaded) · 0% chance over 30 yrs
- Wildfire 1/10 Low
- Heat 3/10 Moderate 7 d/yr ≥104°F today · 17 d/yr by 30 yrs out
- Wind 2/10 Low
- Air quality 3/10 Moderate 2 unhealthy d/yr today · 3 by 30 yrs out
Nearby sold comps map
Loading sold comps map…
Walkable amenities ~0.75 mi
Loading nearby amenities…
Taxation est. · year 1
- Rental income
- $25,591
- − Mortgage interest
- −$12,043
- − Property taxes
- −$3,864
- − Insurance
- −$1,075
- − Repairs & maintenance
- −$2,047
- − Management
- −$2,047
- − HOA
- −$396
- − Depreciation
- −$6,255
- Taxable loss
- −$2,137
- Est. tax savings @ 24.0%
- +$513
- After-tax cash flow
- $1,864/yr
For passive investors: Depreciation is non-cash, so a rental often shows a tax loss while cash-flowing — sheltering income. Rental losses are passive: they offset passive income freely, and up to $25,000/yr can offset ordinary (W-2) income if you actively participate and your MAGI is under $100k (phasing out to $0 by $150k); unused losses carry forward. On sale, claimed depreciation is recaptured at up to 25%, and gains may owe capital-gains tax (a 1031 exchange can defer both). Figures are a year-1 estimate at your 24.0% rate — not tax advice; consult a CPA.
Schools (NCES district)
- District
- Geneseo CUSD 228
- NCES district ID
- 1716350
- Math proficiency
- 23% ▼ -10.00%
- Reading proficiency
- 26% ▼ -9.00%
- Median HH income
- $63,288
- Composite
- 22.91/100
- National rank
- #7996
- State rank
- #297 of 620 in IL
Livability — Geneseo
- Score
- 83/100
- State rank
- #45
- US rank
- #907
Category grades
Schools grade is shown separately in the Schools card above.
Census & demographics
- City population
- 12,049
- Population (ZIP)
- 12,049
Population outlook (Henry County) Hauer SSP2
- Today (2025)
- 47,376 people
- By 2030
- 45,920 · -3.1%
- By 2040
- 42,829 · -9.6%
- By 2050
- 39,606 · -16.4%
- By 2075
- 31,848 · -32.8%
- By 2100
- 23,503 · -50.4%
Race, ethnicity, and origin ACS 2023
- Neighborhood character
- Predominantly White (91%)
- Race & ethnicity
- White 91% Two or more races 7% Hispanic / Latino 6%
- Hispanic origin (detail)
- Mexican 6%
- Common ancestry
- English 9% Romanian 4% Portuguese 3%
- Foreign-born
- 1% · Canada, China
- Languages at home
- 96% English-only · Spanish 3%
Political lean MEDSL · Henry
- 2024 margin
- Strong R (+24.5) · D 36.8% · R 61.3% · Other 1.9%
- 2008→2024 swing
- -32.2pp toward R · 2008: 7.7pp · 2024: -24.5pp
- All cycles
- 2024: R+24.5 2020: R+21.4 2016: R+21.2 2012: D+3.1 2008: D+7.7
Not yet ingested
- Civics
- —
Market trends
- HPI YoY
- ▼ -74.08%
- Current HPI
- 157.4041
- Rent YoY
- —
- Metro
- —
- State GDP YoY
- ▲ 1.59%
- F500 in state
- 60
Industry mix (Fortune 500 HQ in IL)
| Industry | F500 HQs | Revenue |
|---|---|---|
| Insurance | 4 | $201B |
|
||
| Consumer Goods | 4 | $87B |
|
||
| Industrial Machinery | 3 | $64B |
|
||
| Healthcare | 2 | $55B |
|
||
| Retail / Pharmacy | 1 | $148B |
|
||
| Agriculture / Food | 1 | $86B |
|
||
Property tax history
+5.9%/yrLatest (2024): $3,864 · +13.5% YoY. Source: county tax records.
Cash-flow waterfall
monthlySold comps — $/sqft
last 12 mo · ≤1 miLoading sold comps…