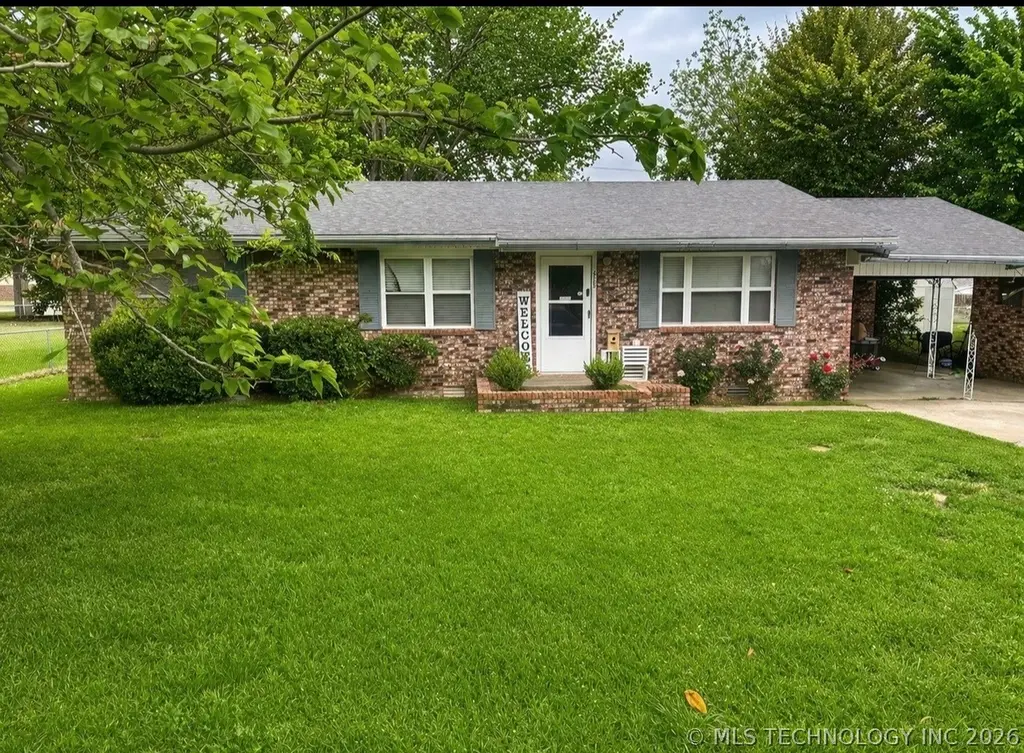
405 NW Mimosa Dr · Stigler, OK
Flood risk 1/10 · Minimal
- FEMA flood zone
- X (unshaded)
- Chance of flooding over 30 yrs
- 0.0%
- Est. flood insurance / yr
- $507 – $1,088
Fire risk 5/10 · Moderate
- Est. fire insurance / yr
- $2,463 – $4,575
Heat risk 6/10 · Moderate
- Hot days now (above 111°F)
- 7 days/yr
- Hot days in 30 yrs
- 20 days/yr
Wind risk 3/10 · Minor
- Chance of severe wind over 30 yrs
- 7.0%
Air-quality risk 2/10 · Minimal
- Unhealthy air days now
- 1 days/yr
- Unhealthy air days in 30 yrs
- 1 days/yr
Risk factors via First Street. Map © Google.
Why this score? — see what drove the D- grade
The composite is a weighted blend of 9 inputs, each scored 0–100. Each bar is that input's sub-score; the figure is the points it added to the 100-point composite (weight × sub-score).
- Cash flow +10.5/30.0
- Appreciation +6.9/10.0
- Livability +3.2/5.0
- DSCR +3.0/10.0
- ARV discount +3.0/15.0
- Rent growth +2.5/5.0
- Condition / age +2.5/5.0
- 1% rule +2.2/10.0
- Schools +1.9/10.0
$135,900
🖨 Deal sheet 📄 Offer letter ✓ Due diligence
Listing remarks MLS
This really cute 3/1 brick home with nice trees, sits close to Middle and High schools and Roye Park! It has a newer roof, windows and has been updated inside and out! Beautiful home! COME SEE!
Key facts
- Storage building
- Convenient location
- Move in ready
Tags
Property features AI
Finance
- Financial info: Pets allowed
Exterior
- Parking: 1-car garage; Carport
- Security: Storm shelter
- Utilities: Electricity available; Natural gas available; Public water; Public sewer
- Home design: Single-story; Faces south; Crawlspace foundation; Property type: Single family
- Construction: Built of brick and wood frame; Asphalt/fiberglass roof; Year built from public records
- Exterior features: Concrete driveway; Porch; Shed(s)/storage; Chain link fencing; Storm shelter; Mature trees; Boat ramp/lift access nearby (Lake John Wells)
Interior
- Kitchen: Built-in range; Built-in oven; Oven; Range; Dishwasher; Refrigerator
- Flooring: Carpet; Vinyl
- Bathrooms: 1 full bathroom
- Heating & cooling: Central heating (gas); Central air conditioning
- Interior features: Ceiling fan(s); Laminate counters; Vinyl windows; Electric oven/range connections
- Laundry & utility: Washer hookup; Electric dryer hookup; Gas water heater
Neighborhood map
What this means for you Summary
Snapshot
- This is a 3-bed/1.0-bath single-family listed at $136k.
Deal economics
- At list price, monthly cash flow is $-70 ($-836/yr) — negative.
- To cash-flow at today's rent, offer at most $124k (9.1% below list).
- To meet the 1% rule (rent ≥ 1% of price), the offer needs to be $98k (28.0% below list).
- Recommended offer: $98k (28.0% below list) — sets the bar for 1% rule.
- Cap rate 5.7% vs local median 3.7% in Stigler — top-decile yield for the area; either an underpriced asset or a hidden risk that comps aren't pricing in. Stress-test before assuming the spread holds.
Location & tenants
- Location reads 65/100 on livability (#159 in OK) — a middle-class / working-renter tenant base. Strengths: cost of living A+, housing A-; Watch: health & safety C-, schools F, amenities F.
- Stigler (town): math 20% / reading 25% proficiency, ranked #151 of 270 in OK (top 56%) — low school quality limits family demand, transient renter base, plan for 1-2y turnover.
- Market conditions: 138 active listings in the ZIP; 10 units permitted in Haskell County in 2024 (0 in 5+ unit buildings).
Forward outlook
- In year one you build about $6k of equity ($940 loan paydown + $5k appreciation (3.8% local appreciation)).
- Haskell County population projected at -10% by 2050 — secular population decline; favor cash flow + early exit over multi-decade hold.
- At projected returns (3.8% appreciation + 3.0% rent growth), your $38k cash investment doubles in ~6 years — after that, you're playing with house money.
- By year 6, paydown + projected appreciation supports a ~$33k cash-out refi (75% LTV) — recoverable capital for the next deal without selling this one.
Negotiation context
- It's been on market 28 days — a 2% lower offer ($134k) is reasonable based on typical stale-listing flexibility.
- 5 sale attempts since 10y ago with the ask held roughly flat each time — persistent listings suggest the price (not the market) is what's stuck; bring a comps-based counter.
- Current owner paid $116k; 17% above their basis — modest negotiation headroom, anchor on the comps not their cost.
Risks & watch-outs
- Climate carrying-cost: moderate wildfire risk; extreme-heat days projected 7→20/yr by 2055 (HVAC capex compounding) — expect insurance premiums to compound above CPI over the hold.
Questions for the listing agent
- What do current leases actually rent for vs. the listed asking? Can we see a recent rent roll and the last 12 months of T-12 income?
- Built in 1965 — when were the roof, HVAC, electrical panel, plumbing, and water heater last replaced?
- Is there a deadline driving the sale (1031 exchange, divorce, estate, relocation)? That informs how much negotiation room exists.
- Schools are F-rated, which usually means shorter tenancies and higher turnover. Who's the typical renter profile here, and what's been the actual vacancy rate?
- The area grade is low — what's the realistic commute time and amenity access for the typical tenant pool here? Any planned neighborhood developments (good or bad) we should know about?
- What's the average days-on-market for RENTAL listings here right now (not sales)? A rising rental-DOM trend means longer vacancies and softer asking-rent achievability than the comps imply.
- What's the recent tenant-quality profile in this submarket — average credit score on applications, eviction rate, late-payment / NSF rate, and stable-employment percentage? A property-management company in the area should have these aggregated.
- How much new for-sale + rental construction is in the pipeline within 1–3 miles? Heavy new supply typically softens prices + rents 12–24 months out; constrained supply supports both.
Investment metrics
- 1% rule
- 0.72% ✗
- Cap rate
- 5.68%
- Cash-on-cash
- -2.20%
- DSCR
- 0.90
- GRM
- 11.6
CMA / ARV
- ARV (on-the-fly)
- $123,432
- Comps found
- 7
Show comp detail 7 sales within ~0.75 mi
| Address | Dist | Beds/Ba | Sqft | Sold | Price | $/sf | Match |
|---|---|---|---|---|---|---|---|
| 303 NW J St | 0.12mi | 3/2.0 | 1,215 (+9%) | 5mo | $128,000 | $105 | 71 |
| 503 NE 4th St | 0.56mi | 3/1.5 | 1,118 (+0%) | 9mo | $104,900 | $94 | 64 |
| 1101 NW 9th St | 0.37mi | 3/1.5 | 1,248 (+12%) | 2mo | $149,000 | $119 | 58 |
| 1103 NW 9th St | 0.37mi | 2/1.0 (-1) | 988 (-11%) | 4mo | $110,000 | $111 | 56 |
| 311 N Broadway St | 0.44mi | 2/1.0 (-1) | 1,008 (-9%) | 11mo | $48,500 | $48 | 49 |
| 1102 NW H. St | 0.44mi | 2/1.0 (-1) | 1,053 (-5%) | 20mo | $120,000 | $114 | 49 |
| 504 NE Tilden St | 0.67mi | 3/1.0 | 1,128 (+1%) | 23mo | $137,500 | $122 | 47 |
Match score weights: distance 35% · size 25% · config 20% · recency 20%. Top-matched comps best support the ARV.
Projected returns pro-forma
3.83% appreciation · 3.0% rent growth · sell at horizon
- IRR
- 7.8%
- Equity multiple
- 1.47×
- Total profit
- $17,951
- Equity at exit
- $67,557
- IRR
- 10.1%
- Equity multiple
- 2.65×
- Total profit
- $62,846
- Equity at exit
- $109,435
Cash invested: $38,052 (down + closing). Projections, not guarantees.
Landlord ↔ Tenant lean methodology
- Overall (STATE)
- 83 Strongly Landlord-Friendly
- State Oklahoma
- 83 Strongly Landlord-Friendly · R+20
- County
- — inherits STATE
- City
- — inherits STATE
ZIP-level market 74462
- Home prices YoY
- 1.9%
- Active inventory
- 138
- Price-to-rent
- 11.6×
Monthly cashflow live
- Estimated rent
- $979 medium interval (Pro) →
- Mortgage (P&I)
- −$713
- Tax from tax record
- −$74 /mo · $884/yr
- Insurance
- −$57
- HOA
- −$0
- Vacancy / Maint / Mgmt
- −$206
- Net cashflow
- $-70
Break-even live
UW: 25.0% down · 7.5% · 30yr · 1.5% tax · 5.0% vac · 8.0% maint · 8.0% mgmt
Financing live
Cash to close
- Down payment
- $33,975
- Closing costs
- $4,077
- Reserves months
- —
- Total cash needed
- —
Loan-product check · same deal, 3 products live
Conventional
25% down · 7.5% · 30yr
- Down + closing
- —
- Monthly P&I
- —
- Monthly cashflow
- —
- DSCR
- —
- Eligible?
- —
Personal DTI + credit; lowest rate.
DSCR
20% down · 8.5% · 30yr
- Down + closing
- —
- Monthly P&I
- —
- Monthly cashflow
- —
- DSCR
- —
- Eligible?
- —
No personal income docs; deal must DSCR.
Hard money
10% down · 12.0% · 12mo
- Down + closing
- —
- Monthly P&I
- —
- Monthly cashflow
- —
- DSCR
- —
- Eligible?
- —
Short-term bridge; refi at stabilization.
Listing history 12 events
-
2026-05-11status Pending
-
2026-04-13$135,900 Active
-
2023-02-27soldstatus $116,100
-
2023-02-24soldstatus $116,100 193-char remark
Show marketing remark (193 chars)
This really cute 3/1 brick home with nice trees, sits close to Middle and High schools and Roye Park! It has a newer roof, windows and has been updated inside and out! Beautiful home! COME SEE!
-
2022-09-18$115,000 193-char remark
Show marketing remark (193 chars)
This really cute 3/1 brick home with nice trees, sits close to Middle and High schools and Roye Park! It has a newer roof, windows and has been updated inside and out! Beautiful home! COME SEE!
-
2018-07-01soldstatus $80,000 254-char remark
Show marketing remark (254 chars)
SUPER NICE brick home with large fenced bacvkyard. It has been remodeled and has new roof, new windows, new bathroom, all new flooring, lighting, paint, storm cellar, etc! Close to hospital, schools, golf course and Roye Park! MUST SEE! * * owner/agent
-
2018-06-20soldstatus $80,000
-
2018-06-01soldstatus $80,000
-
2017-12-07$80,000 254-char remark
Show marketing remark (254 chars)
SUPER NICE brick home with large fenced bacvkyard. It has been remodeled and has new roof, new windows, new bathroom, all new flooring, lighting, paint, storm cellar, etc! Close to hospital, schools, golf course and Roye Park! MUST SEE! * * owner/agent
-
2017-12-07$80,000
Show marketing remark (254 chars)
SUPER NICE brick home with large fenced bacvkyard. It has been remodeled and has new roof, new windows, new bathroom, all new flooring, lighting, paint, storm cellar, etc! Close to hospital, schools, golf course and Roye Park! MUST SEE! * * owner/agent
-
2016-05-27soldstatus $61,500
-
2016-03-21$55,000
ⓘ Source: listings_history table (triggers on properties + properties_extension) + one-shot
backfill from property_details.listing_events for pre-trigger history.
Tax reassessment forecast OK · Resets to sale price
- Current annual tax
- $884 · $74/mo
- Projected year-2 tax
- $1,223 · $102/mo
- Expected delta
- +$339/yr (+$28/mo · 38.4%)
ⓘ Screening estimate from a state-policy table — verify with the county assessor before closing.
Climate risk First Street
- Flood 1/10 Low FEMA zone X (unshaded) · 0% chance over 30 yrs
- Wildfire 5/10 Major
- Heat 6/10 Major 7 d/yr ≥111°F today · 20 d/yr by 30 yrs out
- Wind 3/10 Moderate 7% chance of damaging wind over 30 yrs
- Air quality 2/10 Low 1 unhealthy d/yr today · 1 by 30 yrs out
Nearby sold comps map
Loading sold comps map…
Walkable amenities ~0.75 mi
Loading nearby amenities…
Taxation est. · year 1
- Rental income
- $11,746
- − Mortgage interest
- −$7,613
- − Property taxes
- −$884
- − Insurance
- −$680
- − Repairs & maintenance
- −$940
- − Management
- −$940
- − Depreciation
- −$3,953
- Taxable loss
- −$3,263
- Est. tax savings @ 24.0%
- +$783
- After-tax cash flow
- $-53/yr
For passive investors: Depreciation is non-cash, so a rental often shows a tax loss while cash-flowing — sheltering income. Rental losses are passive: they offset passive income freely, and up to $25,000/yr can offset ordinary (W-2) income if you actively participate and your MAGI is under $100k (phasing out to $0 by $150k); unused losses carry forward. On sale, claimed depreciation is recaptured at up to 25%, and gains may owe capital-gains tax (a 1031 exchange can defer both). Figures are a year-1 estimate at your 24.0% rate — not tax advice; consult a CPA.
Schools (NCES district)
- District
- Stigler
- NCES district ID
- 4028650
- Math proficiency
- 20% ▼ -13.00%
- Reading proficiency
- 25% ▼ -6.00%
- Median HH income
- $37,379
- Composite
- 18.77/100
- National rank
- #8874
- State rank
- #151 of 270 in OK
Livability — Stigler
- Score
- 65/100
- State rank
- #159
- US rank
- #13589
Category grades
Schools grade is shown separately in the Schools card above.
Census & demographics
- Census place
- Stigler, OK
- Population (ZIP)
- 7,096
Population outlook (Haskell County) Hauer SSP2
- Today (2025)
- 12,670 people
- By 2030
- 12,462 · -1.6%
- By 2040
- 11,962 · -5.6%
- By 2050
- 11,354 · -10.4%
- By 2075
- 9,621 · -24.1%
- By 2100
- 7,478 · -41.0%
Race, ethnicity, and origin ACS 2023
- Neighborhood character
- Predominantly White (70%)
- Race & ethnicity
- White 70% Native American 13% Two or more races 13% Hispanic / Latino 6%
- Hispanic origin (detail)
- Mexican 6%
- Common ancestry
- Scotch-Irish 1% Slovak 1% Italian 1%
- Foreign-born
- 3% · Canada
- Languages at home
- 95% English-only · Spanish 4% Russian/Polish/Slavic 1%
Political lean MEDSL · Haskell
- 2024 margin
- Solid R (+69.7) · D 14.6% · R 84.2% · Other 1.3%
- 2008→2024 swing
- -32.6pp toward R · 2008: -37.0pp · 2024: -69.7pp
- All cycles
- 2024: R+69.7 2020: R+67.5 2016: R+59.5 2012: R+44.6 2008: R+37.0
Not yet ingested
- Civics
- —
Market trends
- HPI YoY
- ▲ 3.83%
- Current HPI
- 201.74
- Rent YoY
- —
- Metro
- —
- State GDP YoY
- ▲ 1.55%
- F500 in state
- 6
Industry mix (Fortune 500 HQ in OK)
| Industry | F500 HQs | Revenue |
|---|---|---|
| Energy | 3 | $48B |
|
||
Price history
+147.1% since first listed12 events — show timeline
- 2026-05-11 Pending — MLS Technology, Inc.
- 2026-04-13 Listed $135,900 MLS Technology, Inc.
- 2023-02-27 Sold (Public Records) $116,100 Public Records
- 2023-02-24 Sold (MLS) $116,100 WRVBOR
- 2022-09-18 Listed $115,000 WRVBOR
- 2018-07-01 Sold (MLS) $80,000 WRVBOR
- 2018-06-20 Sold (Public Records) $80,000 Public Records
- 2018-06-01 Sold (MLS) $80,000 MLS Technology, Inc.
- 2017-12-07 Listed $80,000 MLS Technology, Inc.
- 2017-12-07 Listed $80,000 WRVBOR
- 2016-05-27 Sold (MLS) $61,500 MLS Technology, Inc.
- 2016-03-21 Listed $55,000 MLS Technology, Inc.
Property tax history
+11.2%/yrLatest (2025): $884 · -10.2% YoY. Source: county tax records.
Cash-flow waterfall
monthlySold comps — $/sqft
last 12 mo · ≤1 miLoading sold comps…