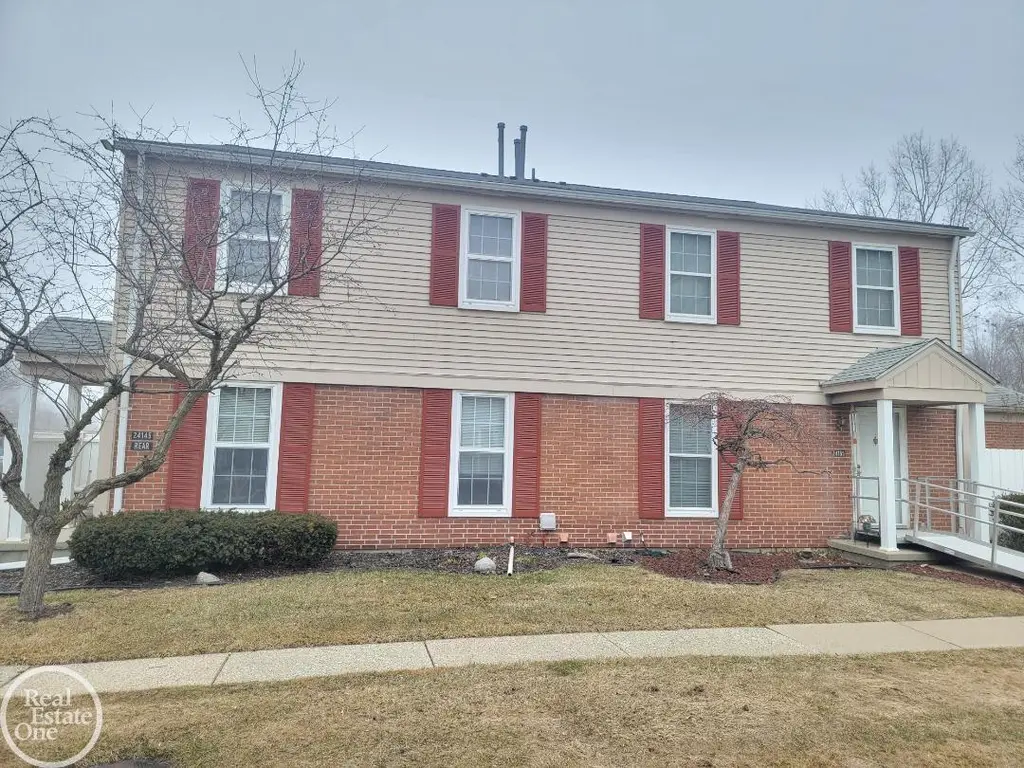
24151 Meadowbridge Dr · Mount Clemens, MI
Flood risk 1/10 · Minimal
- FEMA flood zone
- X (unshaded)
- Chance of flooding over 30 yrs
- 0.0%
- Est. flood insurance / yr
- $473 – $860
Fire risk 1/10 · Minimal
- Est. fire insurance / yr
- $784 – $1,456
Heat risk 3/10 · Minor
- Hot days now (above 97°F)
- 7 days/yr
- Hot days in 30 yrs
- 15 days/yr
Wind risk 1/10 · Minimal
- Chance of severe wind over 30 yrs
- —
Air-quality risk 4/10 · Minor
- Unhealthy air days now
- 4 days/yr
- Unhealthy air days in 30 yrs
- 6 days/yr
Risk factors via First Street. Map © Google.
Why this score? — see what drove the D grade
The composite is a weighted blend of 9 inputs, each scored 0–100. Each bar is that input's sub-score; the figure is the points it added to the 100-point composite (weight × sub-score).
- ARV discount +10.4/15.0
- Cash flow +9.0/30.0
- 1% rule +5.1/10.0
- Livability +3.9/5.0
- Condition / age +3.8/5.0
- Rent growth +3.6/5.0
- Schools +3.6/10.0
- DSCR +2.5/10.0
- Appreciation +0.0/10.0
$139,900
🖨 Deal sheet (PDF) 📄 Offer letter ✓ Due diligence
Listing remarks
Very well maintained 2-bedroom, 1.5-bath condo with an attached 1.5-car garage, ready for its next owner. Nicely situated toward the back of the complex, this unit offers added privacy and a peaceful setting. Updates include a furnace replaced in 2013 and new windows installed in 2022. The condo also features a full finished basement, providing additional living and entertaining space. All appliances are included. Additional parking is available for guests. Conveniently located just minutes from Metro Beach, shopping, dining, and entertainment.
Key facts
- $255 HOA
- Garage
- Built 1979
Property features AI
Finance
- Other: Located in the Meadow Bridge subdivision (East of Harper / South of 16 Mile)
- HOA & community: Homeowners association with a monthly fee of $255 (includes water)
Exterior
- Parking: Attached garage (approximately 1.5 car)
- Utilities: Public sewer; Water available
- Home design: Residential condominium; Two levels
- Construction: Brick and vinyl siding exterior
- Exterior features: Patio; Paved road access
Interior
- Kitchen: Dishwasher; Oven; Range; Refrigerator
- Bedrooms: 5 total rooms (includes bedrooms and living areas)
- Bathrooms: 1 full bathroom; 1 half bathroom
- Heating & cooling: Forced air heating (natural gas); Central air conditioning; Ceiling fans
- Interior features: Gas water heater; Basement
- Laundry & utility: Washer; Dryer
Neighborhood map
What this means for you Summary
Snapshot
- This is a 2-bed/1.5-bath condo listed at $140k. Condition is rated good.
Deal economics
- At list price, monthly cash flow is $-110 ($-1k/yr) — negative.
- To cash-flow at today's rent, offer at most $124k (11.4% below list).
- Meets the 1% rule at list price ($1k rent vs $140k).
- Recommended offer: $124k (11.4% below list) — sets the bar for cash-flow.
- Cap rate 5.3% vs local median 3.0% in Mount Clemens — top-decile yield for the area; either an underpriced asset or a hidden risk that comps aren't pricing in. Stress-test before assuming the spread holds.
Location & tenants
- Location reads 77/100 on livability (#120 in MI, #2,918 nationally) — a middle-class / working-renter tenant base. Strengths: commute A+, cost of living A+, housing A+; Watch: crime D+, amenities D+, employment D-.
- L'Anse Creuse Public Schools (suburban): math 31% / reading 51% proficiency, ranked #184 of 540 in MI (top 34%) — families likely to look elsewhere, expect single-tenant / working-renter base with shorter leases.
- Zoned schools: Tenniswood Elementary School (math 22% / reading 27%, grade F, #980 of 1,397 statewide, top 74%, 356 students, 73% FRL); Middle School South (math 26% / reading 46%, grade F, #269 of 493 statewide, top 56%, 389 students, 57% FRL); High School (math 24% / reading 50%, grade F, #334 of 713 statewide, top 51%, 1,246 students, 41% FRL) — zoned schools average 57% FRL vs 32% district-wide (25 pts higher); higher-poverty schools than district average — tighter screening recommended.
- Market conditions: Rents rising fast (+4.2%/yr); 175 active listings in the ZIP; 17 comparable units currently listed for rent nearby; rentals at typical pace (median 19d on market — plan ~3-4 weeks tenant-placement turnaround); 1,321 units permitted in Macomb County in 2024 (86 in 5+ unit buildings).
Forward outlook
- Local home prices are declining (-3.0%/yr); year-one equity from $967 of loan paydown is wiped out by about $4k of value loss. Plan a longer hold.
- Macomb County population projected at +9% by 2050 — modest demand growth; plan on rents tracking national, not racing it.
Negotiation context
- It's been on market 47 days — a 3% lower offer ($136k) is reasonable based on typical stale-listing flexibility.
- 7 sale attempts since 13y ago; this cycle's ask has dropped $20k (13%) from the opening price — seller is motivated, your offer sets the floor, not the list.
- Current owner paid $50k; list at $140k implies a 180% gain — meaningful room to come down on a strong offer.
Questions for the listing agent
- What do current leases actually rent for vs. the listed asking? Can we see a recent rent roll and the last 12 months of T-12 income?
- It's been on market 47 days. Have you received any prior offers? Is the seller open to a 11% concession, seller financing, or rate buy-down credit?
- Built in 1979 — when were the roof, HVAC, electrical panel, plumbing, and water heater last replaced?
- What does the HOA fee cover, when was the last increase, and are there any pending special assessments or reserve-fund shortfalls?
- Any open or pending special assessments — roof, HVAC, plumbing, elevator, façade? What's the per-unit balance and payoff schedule, and is the seller paying it off at close or rolling it to the buyer?
- Is there a deadline driving the sale (1031 exchange, divorce, estate, relocation)? That informs how much negotiation room exists.
- Schools are D-rated, which usually means shorter tenancies and higher turnover. Who's the typical renter profile here, and what's been the actual vacancy rate?
- Crime grade is D in this area — have there been break-ins, vandalism, or insurance claims at this property in the last 3 years? What carrier currently insures it and at what premium?
- The area grade is low — what's the realistic commute time and amenity access for the typical tenant pool here? Any planned neighborhood developments (good or bad) we should know about?
- What's the average days-on-market for RENTAL listings here right now (not sales)? A rising rental-DOM trend means longer vacancies and softer asking-rent achievability than the comps imply.
- What's the recent tenant-quality profile in this submarket — average credit score on applications, eviction rate, late-payment / NSF rate, and stable-employment percentage? A property-management company in the area should have these aggregated.
- How much new apartment / multifamily construction is in the pipeline within 1–3 miles? Heavy new supply (>2% of stock underway) typically softens rents 12–24 months out; light construction supports rent growth.
Investment metrics
- 1% rule
- 1.01% ✓
- Cap rate
- 5.35%
- Cash-on-cash
- -3.37%
- DSCR
- 0.85
- GRM
- 8.3
CMA / ARV
- ARV (median comp)
- $149,643
- List price
- $139,900
- Delta
- -6.51%
- Verdict
- FAIR
- Comps
- 20 within 1.0 mi
Projected returns pro-forma
-3.0% appreciation · 4.25% rent growth · sell at horizon
- IRR
- -20.0%
- Equity multiple
- 0.29×
- Total profit
- $-27,716
- Equity at exit
- $20,860
- IRR
- -9.6%
- Equity multiple
- 0.36×
- Total profit
- $-24,903
- Equity at exit
- $12,096
Cash invested: $39,172 (down + closing). Projections, not guarantees.
Landlord ↔ Tenant lean methodology
- Overall (STATE)
- 62 Landlord-Friendly
- State Michigan
- 62 Landlord-Friendly · EVEN
- County
- — inherits STATE
- City
- — inherits STATE
ZIP-level market 48035
- Home prices YoY
- -29.1%
- Rents YoY
- 4.2%
- Active inventory
- 175
- Price-to-rent
- 8.3×
Monthly cashflow live
- Estimated rent
- $1,407 high interval (Pro) →
- Mortgage (P&I)
- −$734
- Tax est. 1.5%
- −$175 /mo · $2,098/yr
- Insurance
- −$58
- HOA
- −$255
- Vacancy / Maint / Mgmt
- −$296
- Net cashflow
- $-110
Break-even live
Sensitivity live
| Price | -10% $-13 | -5% $-62 | +0% $-110 | +5% $-158 | +10% $-207 |
|---|---|---|---|---|---|
| Rent | -10% $-221 | -5% $-166 | +0% $-110 | +5% $-55 | +10% $1 |
| Rate | -1.0pp $-40 | -0.5pp $-75 | base $-110 | +0.5pp $-146 | +1.0pp $-183 |
UW: 25.0% down · 7.5% · 30yr · 1.5% tax · 5.0% vac · 8.0% maint · 8.0% mgmt
Financing live
Cash to close
- Down payment
- $34,975
- Closing costs
- $4,197
- Reserves months
- —
- Total cash needed
- —
Loan-product check · same deal, 3 products live
Conventional
25% down · 7.5% · 30yr
- Down + closing
- —
- Monthly P&I
- —
- Monthly cashflow
- —
- DSCR
- —
- Eligible?
- —
Personal DTI + credit; lowest rate.
DSCR
20% down · 8.5% · 30yr
- Down + closing
- —
- Monthly P&I
- —
- Monthly cashflow
- —
- DSCR
- —
- Eligible?
- —
No personal income docs; deal must DSCR.
Hard money
10% down · 12.0% · 12mo
- Down + closing
- —
- Monthly P&I
- —
- Monthly cashflow
- —
- DSCR
- —
- Eligible?
- —
Short-term bridge; refi at stabilization.
Rent comps 17 comps
| Address | Beds | Baths | Sqft | Rent | $/sqft | DOM | Units | Dist |
|---|---|---|---|---|---|---|---|---|
| 24382 Eastwood Village Ct Clinton Twp, MI | 1.0–2.0 | 1.0 | 825 | $1,460 | $1.77 | 0d | 7 | 0.11mi |
| 24646 N Elda Ct Harrison Twp, MI | 1.0–2.0 | 1.0 | 700 | $930 | $1.33 | 45d | 1 | 0.32mi |
| 35926 Union Lake Rd Harrison Twp, MI | 1.0–2.0 | 1.0 | 840 | $1,085 | $1.29 | 1d | 2 | 0.39mi |
| 23654 Whitley Dr Clinton Twp, MI | 3.0 | 1.0 | 1513 | $1,850 | $1.22 | 26d | 1 | 0.45mi |
| 24120 Denise Blvd Clinton Twp, MI | 1.0–2.0 | 1.0 | 800 | $940 | $1.18 | 45d | 1 | 0.51mi |
| 23560 Denton St Clinton Twp, MI | 1.0–2.0 | 1.0 | 650 | $1,100 | $1.69 | 5d | 1 | 0.61mi |
| 25675 Maritime Cir N Harrison Twp, MI | 2.0 | 2.5 | 1335 | $1,800 | $1.35 | 24d | 1 | 0.72mi |
| 25656 Maritime Cir N Harrison Twp, MI | 2.0 | 2.0 | 1077 | $1,650 | $1.53 | 45d | 1 | 0.72mi |
| 25855 Ashby Dr Harrison Township, MI | 2.0 | 2.0–2.5 | 1405 | $2,180 | $1.55 | 0d | 3 | 0.81mi |
| 35255 Brittany Park St Harrison Twp, MI | 2.0 | 1.0–1.5 | 750 | $1,165 | $1.55 | 18d | 1 | 0.86mi |
| 35844 Jefferson Ave Harrison Twp, MI | 1.0–2.0 | 1.0–2.0 | 850 | $1,440 | $1.69 | 0d | 11 | 1.06mi |
| 26905 Carrington Pl Harrison Charter Township, MI | 2.0 | 2.0 | 1600 | $2,150 | $1.34 | 7d | 1 | 1.14mi |
| 38539 Wellington Dr #19 Clinton Twp, MI | 2.0 | 1.0 | 1092 | $1,400 | $1.28 | 45d | 1 | 1.25mi |
| 25169 Orchid St Harrison Twp, MI | 2.0 | 1.5 | 1100 | $1,000 | $0.91 | 22d | 1 | 1.30mi |
| 25199 Orchid St Unit 1 Harrison Township, MI | 2.0 | 1.5 | 1100 | $1,000 | $0.91 | 22d | 1 | 1.32mi |
| 23128 Wellington Cres Clinton Twp, MI | 1.0–2.0 | 1.0 | 850 | $1,375 | $1.62 | 0d | 6 | 1.38mi |
| 26070 N Lake Dr Harrison Twp, MI | 2.0 | 1.0 | 1000 | $1,498 | $1.50 | 0d | 1 | 1.43mi |
HOA detail condo
- Monthly dues
- $255 · $3,060/yr
- Assessments
- None detected in remarks — confirm with the listing agent.
Listing history 32 events
-
2026-06-21days on market $139,900 Active 47 DOM
-
2026-06-18days on market $139,900 Active 44 DOM
-
2026-06-17days on market $139,900 Active 43 DOM
-
2026-06-16days on market $139,900 Active 42 DOM
-
2026-06-15pricedays on market $139,900 Active 41 DOM
-
2026-06-13days on market $159,900 Active 39 DOM
-
2026-06-13days on market $159,900 Active 38 DOM
-
2026-06-09days on market $159,900 Active 35 DOM
-
2026-06-08days on market $159,900 Active 34 DOM
-
2026-06-07days on market $159,900 Active 33 DOM
-
2026-06-04days on market $159,900 Active 30 DOM
-
2026-06-03days on market $159,900 Active 29 DOM
-
2026-06-02days on market $159,900 Active 28 DOM
-
2026-06-01days on market $159,900 Active 27 DOM
-
2026-05-31days on market $159,900 Active 26 DOM
-
2026-05-05$159,900 Active 550-char remark
-
2026-04-13$154,900 Active
-
2026-04-13historical
-
2026-04-13historical
-
2026-03-05$159,900 Active
-
2025-11-25historical
-
2025-10-18price $167,500
-
2025-10-17price $167,500
-
2025-09-29$174,900 Active
-
2025-09-29$174,900 Active
-
2025-09-22historical
-
2013-06-03soldstatus $50,000
-
2013-06-03soldstatus $50,000
-
2013-05-28historical
-
2013-05-28historical
-
2013-05-20$50,000
-
2013-05-20$50,000
ⓘ Source: listings_history table (triggers on properties + properties_extension) + one-shot
backfill from property_details.listing_events for pre-trigger history.
Climate risk First Street
- Flood 1/10 Low FEMA zone X (unshaded) · 0% chance over 30 yrs
- Wildfire 1/10 Low
- Heat 3/10 Moderate 7 d/yr ≥97°F today · 15 d/yr by 30 yrs out
- Wind 1/10 Low
- Air quality 4/10 Moderate 4 unhealthy d/yr today · 6 by 30 yrs out
Nearby sold comps map
Loading sold comps map…
Walkable amenities ~0.75 mi
Loading nearby amenities…
Taxation est. · year 1
- Rental income
- $16,886
- − Mortgage interest
- −$7,837
- − Property taxes
- −$2,098
- − Insurance
- −$700
- − Repairs & maintenance
- −$1,351
- − Management
- −$1,351
- − HOA
- −$3,060
- − Depreciation
- −$4,070
- Taxable loss
- −$3,580
- Est. tax savings @ 24.0%
- +$859
- After-tax cash flow
- $-463/yr
For passive investors: Depreciation is non-cash, so a rental often shows a tax loss while cash-flowing — sheltering income. Rental losses are passive: they offset passive income freely, and up to $25,000/yr can offset ordinary (W-2) income if you actively participate and your MAGI is under $100k (phasing out to $0 by $150k); unused losses carry forward. On sale, claimed depreciation is recaptured at up to 25%, and gains may owe capital-gains tax (a 1031 exchange can defer both). Figures are a year-1 estimate at your 24.0% rate — not tax advice; consult a CPA.
Condition & rehab AI · 11 photos
This well-maintained 2-bedroom, 1.5-bath condo is ready for its next owner. It features a full finished basement, a furnace replaced in 2013, and new windows installed in 2022. The exterior and interior are in good condition, with minor cosmetic updates needed to enhance its curb appeal and resale value.
Value-add opportunities
- Both Paint the exterior walls — Enhances curb appeal and resale value.
- Both Replace the carpet in the living area and kitchen — Improves the overall look and feel of the interior, increasing both resale and rental value.
Renovation cost estimate screening
Value-add ROI direction
- Both Paint the exterior walls — Enhances curb appeal and resale value. ↑
- Both Replace the carpet in the living area and kitchen — Improves the overall look and feel of the interior, increasing both resale and rental value. ↑
ⓘ Cost ranges are severity-bucket heuristics (US national rule-of-thumb). Get contractor quotes + a written scope before underwriting a rehab budget.
Schools (NCES district)
- District
- L'Anse Creuse Public Schools
- NCES district ID
- 2621870
- Math proficiency
- 31% ▼ -8.00%
- Reading proficiency
- 51% ▼ -2.00%
- Median HH income
- $57,757
- Composite
- 35.99/100
- National rank
- #4790
- State rank
- #184 of 540 in MI
Livability — Mount Clemens
- Score
- 77/100
- State rank
- #120
- US rank
- #2918
Category grades
Schools grade is shown separately in the Schools card above.
Census & demographics
- County
- Macomb County · 638,552 people
- City population
- 15,429
- Metro
- Detroit-Warren-Dearborn, MI
- Population (ZIP)
- 33,569
- Household income
- $73,015
- Rent vs Own
- Severe rent burden
- 978.0
Population outlook (Macomb County) Hauer SSP2
- Today (2025)
- 925,296 people
- By 2030
- 948,226 · +2.5%
- By 2040
- 983,961 · +6.3%
- By 2050
- 1,010,200 · +9.2%
- By 2075
- 1,076,222 · +16.3%
- By 2100
- 1,077,065 · +16.4%
Race, ethnicity, and origin ACS 2023
- Neighborhood character
- Predominantly White (68%)
- Race & ethnicity
- White 68% Black 21% Two or more races 6% Hispanic / Latino 4% Asian 2%
- Common ancestry
- Romanian 14% Lithuanian 5% Slovak 2%
- Foreign-born
- 6% · Canada
- Languages at home
- 93% English-only · Spanish 2% Other Indo-European 1% Arabic 1%
Political lean MEDSL · Macomb
- 2024 margin
- R (+13.7) · D 42.2% · R 55.9% · Other 1.9%
- 2008→2024 swing
- -22.3pp toward R · 2008: 8.6pp · 2024: -13.7pp
- All cycles
- 2024: R+13.7 2020: R+8.1 2016: R+11.6 2012: D+4.0 2008: D+8.6
Not yet ingested
- Civics
- —
Market trends
- HPI YoY
- ▼ -148.36%
- Current HPI
- 362.1471
- Rent YoY
- ▲ 4.25%
- Metro
- Detroit-Warren-Dearborn, MI
- State GDP YoY
- ▲ 1.37%
- F500 in state
- 28
Industry mix (Fortune 500 HQ in MI)
| Industry | F500 HQs | Revenue |
|---|---|---|
| Automotive Parts | 3 | $48B |
|
||
| Automotive | 2 | $372B |
|
||
| Chemicals | 1 | $45B |
|
||
| Automotive Retail | 1 | $29B |
|
||
| Healthcare / Medical Devices | 1 | $23B |
|
||
| Automotive Technology | 1 | $20B |
|
||
Price history
+179.8% since first listed18 events — show timeline
- 2026-06-14 Price Changed $139,900 REALCOMP
- 2026-05-05 Listed $159,900 REALCOMP
- 2026-04-13 Listed $154,900 REALCOMP
- 2026-04-13 Listing Removed — REALCOMP
- 2026-04-13 Listing Removed — REALCOMP
- 2026-03-05 Listed $159,900 REALCOMP
- 2025-11-25 Listing Removed — MiRealSource-MiMLS
- 2025-10-18 Price Changed $167,500 MiRealSource-MiMLS
- 2025-10-17 Price Changed $167,500 REALCOMP
- 2025-09-29 Listed $174,900 REALCOMP
- 2025-09-29 Listed $174,900 MiRealSource-MiMLS
- 2025-09-22 Coming Soon — MiRealSource-MiMLS
- 2013-06-03 Sold (MLS) $50,000 MiRealSource-MiMLS
- 2013-06-03 Sold (MLS) $50,000 REALCOMP
- 2013-05-28 Listing Removed — MiRealSource-MiMLS
- 2013-05-28 Listing Removed — REALCOMP
- 2013-05-20 Listed $50,000 MiRealSource-MiMLS
- 2013-05-20 Listed $50,000 REALCOMP
Cash-flow waterfall
monthlySold comps — $/sqft
last 12 mo · ≤1 miLoading sold comps…