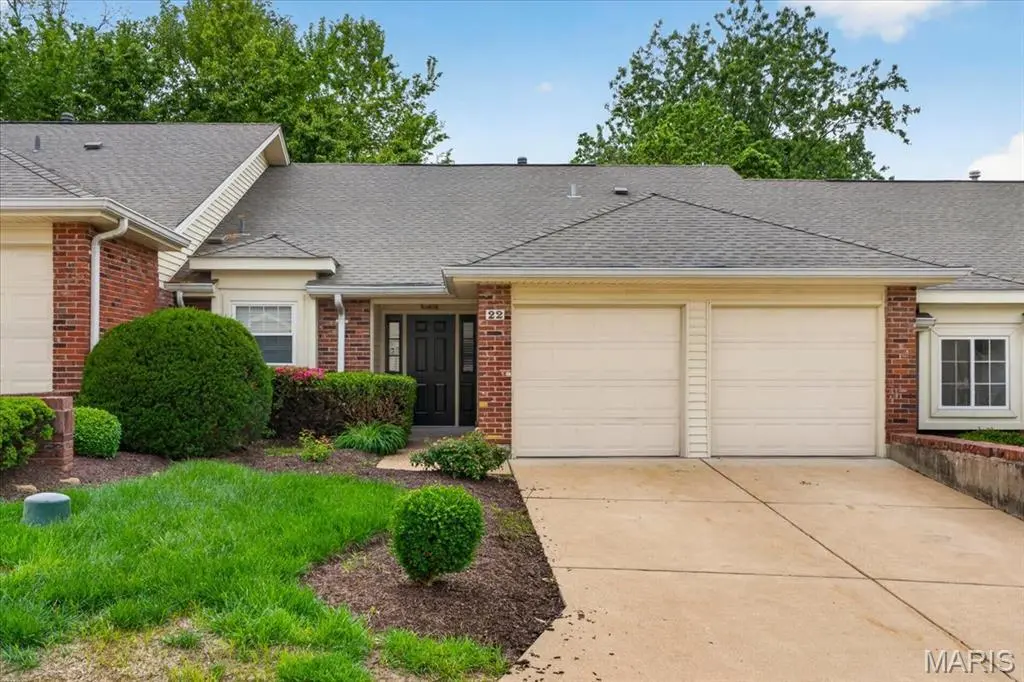
22 Willowyck Ct · Maryland Heights, MO
Flood risk 1/10 · Minimal
- FEMA flood zone
- X (unshaded)
- Chance of flooding over 30 yrs
- 0.0%
- Est. flood insurance / yr
- $473 – $860
Fire risk 1/10 · Minimal
- Est. fire insurance / yr
- $1,054 – $1,958
Heat risk 5/10 · Moderate
- Hot days now (above 106°F)
- 7 days/yr
- Hot days in 30 yrs
- 21 days/yr
Wind risk 2/10 · Minimal
- Chance of severe wind over 30 yrs
- 1.0%
Air-quality risk 2/10 · Minimal
- Unhealthy air days now
- 2 days/yr
- Unhealthy air days in 30 yrs
- 2 days/yr
Risk factors via First Street. Map © Google.
Why this score? — see what drove the D grade
The composite is a weighted blend of 9 inputs, each scored 0–100. Each bar is that input's sub-score; the figure is the points it added to the 100-point composite (weight × sub-score).
- Appreciation +10.0/10.0
- ARV discount +9.5/15.0
- Cash flow +6.5/30.0
- Schools +5.1/10.0
- Livability +3.6/5.0
- 1% rule +3.0/10.0
- Condition / age +2.5/5.0
- Rent growth +1.8/5.0
- DSCR +0.7/10.0
$265,000
🖨 Deal sheet (PDF) 📄 Offer letter ✓ Due diligence
Listing remarks
Fabulous 3-bedroom, 3-bath open-concept Townhome style PUD featuring tasteful decor throughout. Upon entry, appreciate the thoughtfully designed bright eat in kitchen showcasing Cambria quartz countertops, custom cabinetry with a lazy Susan, luxury tile flooring, modern lighting, a stylish backsplash, refrigerator which will remain, dishwasher. stainless microwave and flat-top electric range. Upstairs, the versatile vaulted loft features a wood-burning fire place, provides flexible living space and opens to the deck overlooking mature trees. The spacious primary suite offers large windows and an updated en-suite bathroom with a shower. An additional bedroom and full remodeled bath with show
Key facts
- Custom cabinetry
- Greatroom
- $430 HOA
Tags
Property features AI
Finance
- Other: Community of 25 units
- HOA & community: Thornhill Ridge Association; Monthly association fee of $430; Association manages grounds, parking/roads, common areas; includes sewer, trash, and snow removal
Exterior
- Parking: Attached garage (2 spaces)
- Utilities: Public water; Public sewer; Electric service by Ameren; Cable available; Natural gas connected; Phone available
- Home design: Residential townhouse; Private ownership; Three or more levels; Above-grade finished area recorded by assessor
- Construction: Brick veneer, frame, and vinyl siding construction
- Exterior features: Private yard; Back and front yard; Landscaped grounds; Level lot with many trees
Interior
- Kitchen: Stainless steel appliances; Dishwasher; Disposal; Microwave; Electric range; Refrigerator
- Bedrooms: 3 bedrooms total (2 upper level, 1 lower level)
- Bathrooms: 3 full bathrooms (2 on main/upper levels, 1 on lower level)
- Heating & cooling: Natural gas heating; Central air conditioning
- Interior features: Eat-in kitchen; Open floor plan; Stone counters; Vaulted ceilings; Two wood-burning fireplaces
- Laundry & utility: Laundry in basement; Gas water heater
Neighborhood map
What this means for you Summary
Snapshot
- This is a 3-bed/3.0-bath townhouse listed at $265k.
Deal economics
- At list price, monthly cash flow is $-453 ($-5k/yr) — negative.
- To cash-flow at today's rent, offer at most $185k (30.2% below list).
- To meet the 1% rule (rent ≥ 1% of price), the offer needs to be $213k (19.8% below list).
- Recommended offer: $185k (30.2% below list) — sets the bar for cash-flow.
Location & tenants
- Location reads 71/100 on livability (#101 in MO) — a middle-class / working-renter tenant base. Strengths: cost of living A+, housing A+, crime A-; Watch: health & safety C-, amenities F, commute F.
- Parkway C-2 (suburban): math 49% / reading 62% proficiency, ranked #18 of 324 in MO (top 6%) — acceptable for families but not a draw, mixed tenant base, ~2y average lease; only 14% free/reduced lunch — higher-income household profile.
- Zoned schools: Ross Elem. (math 27% / reading 42%, grade F, #676 of 1,115 statewide, top 66%, 385 students, 32% FRL); Northeast Middle (math 33% / reading 47%, grade F, #185 of 391 statewide, top 48%, 703 students, 24% FRL); North High (math 35% / reading 70%, grade C-, #89 of 521 statewide, top 17%, 1,074 students, 34% FRL) — zoned schools average 30% FRL vs 14% district-wide (16 pts higher); higher-poverty schools than district average — tighter screening recommended.
- Zoned-school proficiency averages 42% at this address vs 56% district-wide (-13 pts) — the specific schools serving this property underperform the Parkway C-2 average; the district grade overstates school quality for this exact location.
- Market conditions: Rents soft (-3.0%/yr); 173 active listings in the ZIP; 10 comparable units currently listed for rent nearby; rentals leasing fast (median 1d on market — plan ~1-2 weeks tenant-placement turnaround); solid renter incomes; 920 units permitted in St. Louis County in 2024 (250 in 5+ unit buildings).
- This rent runs 30% of the median local income ($85k/yr) — at the standard rent-burdened threshold; future hikes will face affordability resistance.
Forward outlook
- In year one you build about $28k of equity ($2k loan paydown + $26k appreciation (10.0% local appreciation)).
- By year 2, paydown + projected appreciation supports a ~$46k cash-out refi (75% LTV) — recoverable capital for the next deal without selling this one.
Negotiation context
- It's been on market 51 days — a 3% lower offer ($257k) is reasonable based on typical stale-listing flexibility.
- 2 sale attempts since 2y ago; this cycle's ask has dropped $14k (5%) from the opening price — seller is motivated, your offer sets the floor, not the list.
- Current owner paid $120k; list at $265k implies a 122% gain — meaningful room to come down on a strong offer.
Risks & watch-outs
- Watch-outs: HOA is 20% of rent.
- Climate carrying-cost: extreme-heat days projected 7→21/yr by 2055 (HVAC capex compounding) — expect insurance premiums to compound above CPI over the hold.
Questions for the listing agent
- What do current leases actually rent for vs. the listed asking? Can we see a recent rent roll and the last 12 months of T-12 income?
- It's been on market 51 days. Have you received any prior offers? Is the seller open to a 30% concession, seller financing, or rate buy-down credit?
- What does the HOA fee cover, when was the last increase, and are there any pending special assessments or reserve-fund shortfalls?
- Is there a deadline driving the sale (1031 exchange, divorce, estate, relocation)? That informs how much negotiation room exists.
- Schools are B-rated — typically a magnet for longer-tenancy family renters. What's the average tenant stay here, and is there a school-zone premium baked into asking?
- The area grade is low — what's the realistic commute time and amenity access for the typical tenant pool here? Any planned neighborhood developments (good or bad) we should know about?
- What's the average days-on-market for RENTAL listings here right now (not sales)? A rising rental-DOM trend means longer vacancies and softer asking-rent achievability than the comps imply.
- What's the recent tenant-quality profile in this submarket — average credit score on applications, eviction rate, late-payment / NSF rate, and stable-employment percentage? A property-management company in the area should have these aggregated.
- How much new for-sale + rental construction is in the pipeline within 1–3 miles? Heavy new supply typically softens prices + rents 12–24 months out; constrained supply supports both.
Investment metrics
- 1% rule
- 0.80% ✗
- Cap rate
- 4.24%
- Cash-on-cash
- -7.32%
- DSCR
- 0.67
- GRM
- 10.4
CMA / ARV
- ARV (median comp)
- $277,182
- List price
- $265,000
- Delta
- -4.39%
- Verdict
- FAIR
- Comps
- 20 within 1.0 mi
Show comp detail 12 sales within ~0.75 mi
| Address | Dist | Beds/Ba | Sqft | Sold | Price | $/sf | Match |
|---|---|---|---|---|---|---|---|
| 1909 King Arthur Ct | 0.46mi | 3/2.5 | 1,134 (+11%) | 6mo | $335,000 | $295 | 53 |
| 1923 Marine Terrace Dr Unit K | 0.45mi | 2/2.0 (-1) | 868 (-15%) | 3mo | $154,990 | $179 | 43 |
| 1935 Marine Terrace Dr Unit D | 0.46mi | 2/2.0 (-1) | 868 (-15%) | 4mo | $155,000 | $179 | 41 |
| 1948 Marine Terrace Dr Unit A | 0.52mi | 2/2.0 (-1) | 868 (-15%) | 2mo | $145,000 | $167 | 40 |
| 12818 Portulaca Dr Unit G | 0.61mi | 2/2.0 (-1) | 868 (-15%) | 0mo | $139,900 | $161 | 37 |
| 1923 Marine Terrace Dr Unit G | 0.45mi | 2/2.0 (-1) | 868 (-15%) | 10mo | $150,000 | $173 | 37 |
| 1912 Marine Terrace Dr Unit C | 0.47mi | 2/2.0 (-1) | 868 (-15%) | 10mo | $140,000 | $161 | 36 |
| 12818 Portulaca Dr Unit K | 0.61mi | 2/2.0 (-1) | 868 (-15%) | 2mo | $139,000 | $160 | 36 |
| 1911 Marine Terrace Dr Unit L | 0.44mi | 2/1.0 (-1) | 868 (-15%) | 8mo | $140,000 | $161 | 34 |
| 1961 Marine Terrace Dr Unit K | 0.51mi | 2/2.0 (-1) | 868 (-15%) | 9mo | $140,000 | $161 | 34 |
| 1960 Marine Terrace Dr Unit E | 0.54mi | 2/2.0 (-1) | 868 (-15%) | 10mo | $155,000 | $179 | 32 |
| 12824 Portulaca Dr Unit J | 0.64mi | 2/2.0 (-1) | 868 (-15%) | 9mo | $139,900 | $161 | 29 |
Match score weights: distance 35% · size 25% · config 20% · recency 20%. Top-matched comps best support the ARV.
Projected returns pro-forma
10.0% appreciation · 0.0% rent growth · sell at horizon
- IRR
- 18.2%
- Equity multiple
- 2.48×
- Total profit
- $109,487
- Equity at exit
- $238,733
- IRR
- 16.4%
- Equity multiple
- 5.51×
- Total profit
- $334,370
- Equity at exit
- $514,837
Cash invested: $74,200 (down + closing). Projections, not guarantees.
Landlord ↔ Tenant lean methodology
- Overall (STATE)
- 81 Strongly Landlord-Friendly
- State Missouri
- 81 Strongly Landlord-Friendly · R+10
- County
- — inherits STATE
- City
- — inherits STATE
ZIP-level market 63146
- Home prices YoY
- 4.9%
- Rents YoY
- -3.0%
- Active inventory
- 173
- Price-to-rent
- 10.4×
Monthly cashflow live
- Estimated rent
- $2,125 high interval (Pro) →
- Mortgage (P&I)
- −$1,390
- Tax from tax record
- −$201 /mo · $2,418/yr
- Insurance
- −$110
- HOA
- −$430
- Vacancy / Maint / Mgmt
- −$446
- Net cashflow
- $-453
Break-even live
Sensitivity live
| Price | -10% $-303 | -5% $-378 | +0% $-453 | +5% $-528 | +10% $-603 |
|---|---|---|---|---|---|
| Rent | -10% $-621 | -5% $-537 | +0% $-453 | +5% $-369 | +10% $-285 |
| Rate | -1.0pp $-319 | -0.5pp $-385 | base $-453 | +0.5pp $-521 | +1.0pp $-591 |
UW: 25.0% down · 7.5% · 30yr · 1.5% tax · 5.0% vac · 8.0% maint · 8.0% mgmt
Financing live
Cash to close
- Down payment
- $66,250
- Closing costs
- $7,950
- Reserves months
- —
- Total cash needed
- —
Loan-product check · same deal, 3 products live
Conventional
25% down · 7.5% · 30yr
- Down + closing
- —
- Monthly P&I
- —
- Monthly cashflow
- —
- DSCR
- —
- Eligible?
- —
Personal DTI + credit; lowest rate.
DSCR
20% down · 8.5% · 30yr
- Down + closing
- —
- Monthly P&I
- —
- Monthly cashflow
- —
- DSCR
- —
- Eligible?
- —
No personal income docs; deal must DSCR.
Hard money
10% down · 12.0% · 12mo
- Down + closing
- —
- Monthly P&I
- —
- Monthly cashflow
- —
- DSCR
- —
- Eligible?
- —
Short-term bridge; refi at stabilization.
Rent comps 10 comps
| Address | Beds | Baths | Sqft | Rent | $/sqft | DOM | Units | Dist |
|---|---|---|---|---|---|---|---|---|
| 12806 Willowyck Dr Saint Louis, MO | 3.0 | 2.0 | 1456 | $2,500 | $1.72 | 45d | 1 | 0.23mi |
| 2037 Chablis Dr Saint Louis, MO | 1.0–2.0 | 1.0–1.5 | 780 | $1,588 | $2.04 | 0d | 67 | 0.57mi |
| 12545 Markaire Dr St. Louis, MO | 1.0–3.0 | 1.0–4.0 | 1420 | $2,695 | $1.90 | 12d | 5 | 0.81mi |
| 1951 Oberlin Dr St. Louis, MO | 1.0–3.0 | 1.0–2.5 | 993 | $2,128 | $2.14 | 0d | 24 | 0.83mi |
| 2207 Summerhouse Dr St. Louis, MO | 1.0–3.0 | 1.0–2.0 | 804 | $1,573 | $1.96 | 0d | 20 | 0.93mi |
| 1895 Boulder Springs Dr St. Louis, MO | 1.0–3.0 | 1.0–2.5 | 1083 | $3,091 | $2.85 | 0d | 6 | 1.07mi |
| 12401 Boulder Springs Pkwy St. Louis, MO | 1.0–3.0 | 1.0–2.0 | 1006 | $2,867 | $2.85 | 0d | 10 | 1.15mi |
| 1231 Creve Coeur Crossing Ln Unit I Chesterfield, MO | 2.0 | 2.0 | 868 | $1,395 | $1.61 | 0d | 1 | 1.20mi |
| 1173 Pompeii Dr Chesterfield, MO | 1.0–2.0 | 1.0–2.0 | 950 | $1,799 | $1.89 | 0d | 24 | 1.48mi |
| 1432 Glenmeade Dr Maryland Heights, MO | 3.0 | 2.0 | 1090 | $2,176 | $2.00 | 12d | 1 | 1.49mi |
HOA detail
- Monthly dues
- $430 · $5,160/yr
- Likely covers
- electric
Listing history 21 events
-
2026-06-21days on market $265,000 Active 51 DOM
-
2026-06-18days on market $265,000 Active 48 DOM
-
2026-06-17days on market $265,000 Active 47 DOM
-
2026-06-16days on market $265,000 Active 46 DOM
-
2026-06-15days on market $265,000 Active 45 DOM
-
2026-06-13days on market $265,000 Active 43 DOM
-
2026-06-13days on market $265,000 Active 42 DOM
-
2026-06-09days on market $265,000 Active 39 DOM
-
2026-06-08days on market $265,000 Active 38 DOM
-
2026-06-07days on market $265,000 Active 37 DOM
-
2026-06-03days on market $265,000 Active 33 DOM
-
2026-06-02days on market $265,000 Active 32 DOM
-
2026-06-02price $265,000 Active 31 DOM
-
2026-06-01days on market $279,000 Active 31 DOM
-
2026-05-31days on market $279,000 Active 30 DOM
-
2026-05-01$279,000 Active 1335-char remark
-
2026-05-01historical $279,000 1335-char remark
-
2024-11-12historical $1,850
-
2024-11-03price $1,850
-
2024-10-12$1,895
-
1998-07-30soldstatus $119,500
ⓘ Source: listings_history table (triggers on properties + properties_extension) + one-shot
backfill from property_details.listing_events for pre-trigger history.
Tax reassessment forecast MO · Resets to sale price
- Current annual tax
- $2,418 · $201/mo
- Projected year-2 tax
- $2,570 · $214/mo
- Expected delta
- +$153/yr (+$13/mo · 6.3%)
ⓘ Screening estimate from a state-policy table — verify with the county assessor before closing.
Climate risk First Street
- Flood 1/10 Low FEMA zone X (unshaded) · 0% chance over 30 yrs
- Wildfire 1/10 Low
- Heat 5/10 Major 7 d/yr ≥106°F today · 21 d/yr by 30 yrs out
- Wind 2/10 Low 100% chance of damaging wind over 30 yrs
- Air quality 2/10 Low 2 unhealthy d/yr today · 2 by 30 yrs out
Nearby sold comps map
Loading sold comps map…
Walkable amenities ~0.75 mi
Loading nearby amenities…
Taxation est. · year 1
- Rental income
- $25,504
- − Mortgage interest
- −$14,844
- − Property taxes
- −$2,418
- − Insurance
- −$1,325
- − Repairs & maintenance
- −$2,040
- − Management
- −$2,040
- − HOA
- −$5,160
- − Depreciation
- −$7,709
- Taxable loss
- −$10,033
- Est. tax savings @ 24.0%
- +$2,408
- After-tax cash flow
- $-3,023/yr
For passive investors: Depreciation is non-cash, so a rental often shows a tax loss while cash-flowing — sheltering income. Rental losses are passive: they offset passive income freely, and up to $25,000/yr can offset ordinary (W-2) income if you actively participate and your MAGI is under $100k (phasing out to $0 by $150k); unused losses carry forward. On sale, claimed depreciation is recaptured at up to 25%, and gains may owe capital-gains tax (a 1031 exchange can defer both). Figures are a year-1 estimate at your 24.0% rate — not tax advice; consult a CPA.
Schools (NCES district)
- District
- Parkway C-2
- NCES district ID
- 2923580
- Math proficiency
- 49% ▼ -11.00%
- Reading proficiency
- 62% ▼ -2.00%
- Median HH income
- $83,551
- Composite
- 50.5/100
- National rank
- #1851
- State rank
- #18 of 324 in MO
Livability — Maryland Heights
- Score
- 71/100
- State rank
- #101
- US rank
- #6808
Category grades
Schools grade is shown separately in the Schools card above.
Census & demographics
- County
- Saint Louis County · 888,823 people
- City population
- 21,924
- Metro
- St. Louis, MO-IL
- Population (ZIP)
- 30,678
- Household income
- $84,756
- Rent vs Own
- Severe rent burden
- 1156.0
Population outlook (St. Louis County) Hauer SSP2
- Today (2025)
- 1,025,227 people
- By 2030
- 1,028,023 · +0.3%
- By 2040
- 1,020,940 · -0.4%
- By 2050
- 1,007,280 · -1.8%
- By 2075
- 987,277 · -3.7%
- By 2100
- 921,984 · -10.1%
Race, ethnicity, and origin ACS 2023
- Neighborhood character
- Diverse neighborhood (Simpson 0.56)
- Race & ethnicity
- White 63% Asian 17% Black 13% Two or more races 4% Hispanic / Latino 3%
- Common ancestry
- Scotch-Irish 3% Romanian 3% Italian 2%
- Foreign-born
- 19% · China, South Korea, Canada
- Languages at home
- 79% English-only · Other Asian/Pacific 7% Other Indo-European 4% Chinese 3%
Political lean MEDSL · St. Louis
- 2024 margin
- Strong D (+23.4) · D 60.8% · R 37.4% · Other 1.7%
- 2008→2024 swing
- +3.5pp toward D · 2008: 19.9pp · 2024: 23.4pp
- All cycles
- 2024: D+23.4 2020: D+24.0 2016: D+16.2 2012: D+13.7 2008: D+19.9
Not yet ingested
- Civics
- —
Market trends
- HPI YoY
- ▲ 33.10%
- Current HPI
- 711.49
- Rent YoY
- ▼ -2.96%
- Metro
- St. Louis, MO-IL
- State GDP YoY
- ▲ 1.84%
- F500 in state
- 20
Industry mix (Fortune 500 HQ in MO)
| Industry | F500 HQs | Revenue |
|---|---|---|
| Healthcare | 1 | $163B |
|
||
| Insurance | 1 | $21B |
|
||
| Industrial Technology | 1 | $17B |
|
||
| Retail | 1 | $16B |
|
||
| Industrial Distribution | 1 | $10B |
|
||
| Utilities | 1 | $9B |
|
||
Price history
+121.8% since first listed7 events — show timeline
- 2026-06-01 Price Changed $265,000 MARIS as Distributed by MLS Grid
- 2026-05-01 Listed $279,000 MARIS as Distributed by MLS Grid
- 2026-05-01 Coming Soon $279,000 MARIS as Distributed by MLS Grid
- 2024-11-12 Rental Removed $1,850 RENTEC
- 2024-11-03 Price Changed $1,850 RENTEC
- 2024-10-12 Listed for Rent $1,895 RENTEC
- 1998-07-30 Sold (Public Records) $119,500 Public Records
Property tax history
+1.2%/yrLatest (2022): $2,418 · +0.7% YoY. Source: county tax records.
Cash-flow waterfall
monthlySold comps — $/sqft
last 12 mo · ≤1 miLoading sold comps…