176 Casa Grande Dr · Red Bluff, CA
Flood risk 10/10 · Severe
- FEMA flood zone
- AE
- Chance of flooding over 30 yrs
- 0.99%
- Est. flood insurance / yr
- $1,737 – $8,500
Fire risk 8/10 · Major
- Est. fire insurance / yr
- $659 – $1,223
Heat risk 8/10 · Major
- Hot days now (above 105°F)
- 6 days/yr
- Hot days in 30 yrs
- 14 days/yr
Wind risk 1/10 · Minimal
- Chance of severe wind over 30 yrs
- —
Air-quality risk 10/10 · Severe
- Unhealthy air days now
- 32 days/yr
- Unhealthy air days in 30 yrs
- 34 days/yr
Risk factors via First Street. Map © Google.
Why this score? — see what drove the C+ grade
The composite is a weighted blend of 9 inputs, each scored 0–100. Each bar is that input's sub-score; the figure is the points it added to the 100-point composite (weight × sub-score).
- Cash flow +30.0/30.0
- 1% rule +10.0/10.0
- DSCR +10.0/10.0
- Condition / age +4.0/5.0
- Schools +3.3/10.0
- Livability +2.9/5.0
- Rent growth +2.7/5.0
- ARV discount +0.0/15.0
- Appreciation +0.0/10.0
$89,500
🖨 Deal sheet (PDF) 📄 Offer letter ✓ Due diligence
Listing remarks
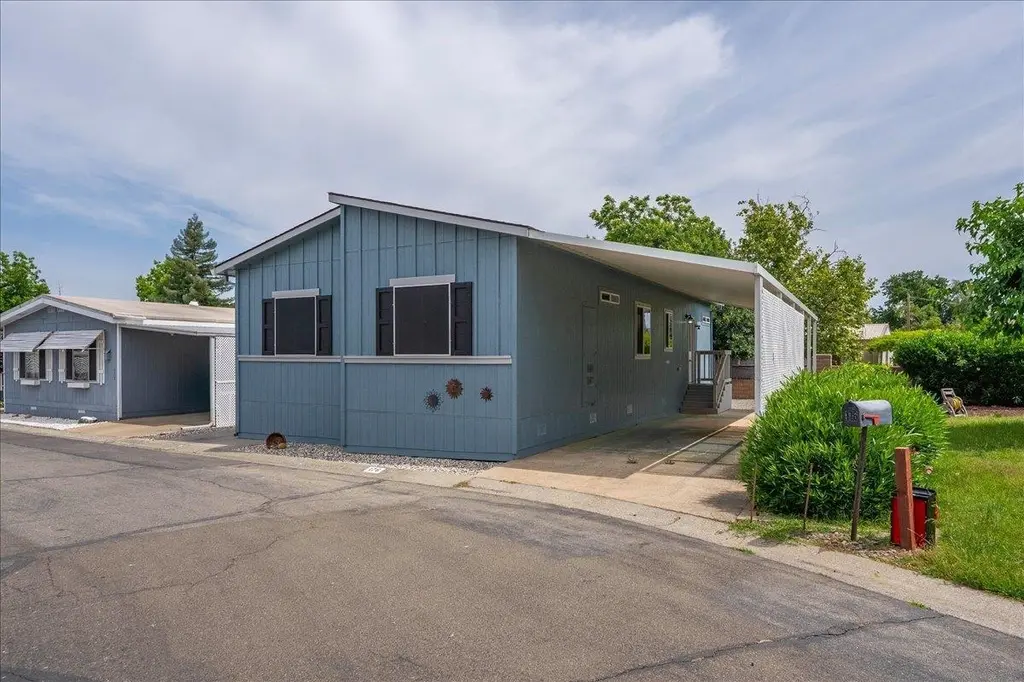
Easy, stylish living in this 2020 manufactured home, located in a desirable senior community along the Sacramento River. With approximately 1,200 s. f. of living space, this home offers tall ceilings throughout, creating a bright and open feel. The floor plan features an open kitchen with island and breakfast bar, open to the living room, ideal for everyday comfort and entertaining. New wood laminate plank flooring, custom window treatments, fresh exterior paint and all the appliances stay gives it a move in ready appeal. Outdoor living is just as inviting with covered parking, a covered patio area, and additional space to relax, garden, or enjoy the peaceful surroundings of this space tuc
Key facts
- Covered parking
- Covered patio
- Open kitchen
Tags
Property features AI
Exterior
- Parking: Attached carport; Carport; Concrete parking surface
- Utilities: Electricity available; Natural gas available
- Home design: Manufactured home; Located in Rio Vista Estates; 50-foot mobile home (model: CMH Manufacturing West/Clayton)
- Construction: Wood siding; Composition roof
- Exterior features: Covered patio and porch; Porch; Patio; Paved road access
Interior
- Kitchen: Gas oven; Gas range; Dishwasher; Microwave; Refrigerator; Garbage disposal
- Bathrooms: 2 full bathrooms
- Heating & cooling: Central heating; Central air conditioning
- Interior features: Breakfast bar; Ceiling fan(s); Laminate countertops; Walk-in closet(s); Double-pane windows; Window coverings
- Laundry & utility: Laundry room; Washer; Dryer
Neighborhood map
What this means for you Summary
Snapshot
- This is a 3-bed/2.0-bath manufactured listed at $90k. Condition is rated good.
Deal economics
- At list price, monthly cash flow is $330 ($4k/yr) — positive.
- The deal already cash-flows at list — no discount required.
- Meets the 1% rule at list price ($2k rent vs $90k).
- Recommended offer: $88k (1.5% below list) — sets the bar for market timing.
- Cap rate 16.4% vs local median 3.6% in Red Bluff — top-decile yield for the area; either an underpriced asset or a hidden risk that comps aren't pricing in. Stress-test before assuming the spread holds.
Location & tenants
- Location reads 58/100 on livability (#698 in CA) — a working-class tenant base; expect higher turnover. Strengths: health & safety A+, housing A-; Watch: cost of living D, crime F, amenities F.
- Antelope Elementary (town): math 34% / reading 44% proficiency, ranked #249 of 517 in CA (top 48%) — families likely to look elsewhere, expect single-tenant / working-renter base with shorter leases.
- Zoned schools: Antelope Elementary (math 38% / reading 42%, grade F, #607 of 1,571 statewide, top 39%, 446 students, 58% FRL); Berrendos Middle (math 36% / reading 49%, grade D-, #143 of 498 statewide, top 29%, 251 students, 56% FRL); Red Bluff High (math 26% / reading 36%, grade F, #702 of 1,170 statewide, top 61%, 1,618 students, 65% FRL) — zoned schools average 60% FRL vs 43% district-wide (17 pts higher); higher-poverty schools than district average — tighter screening recommended.
- Market conditions: Rents flat; 263 active listings in the ZIP; 186 units permitted in Tehama County in 2024 (0 in 5+ unit buildings).
- This rent runs 31% of the median local income ($66k/yr) — at the standard rent-burdened threshold; future hikes will face affordability resistance.
Forward outlook
- Local home prices are declining (-3.0%/yr); year-one equity from $619 of loan paydown is wiped out by about $3k of value loss. Plan a longer hold.
- Tehama County population projected at -14% by 2050 — secular population decline; favor cash flow + early exit over multi-decade hold.
Negotiation context
- It's been on market 26 days — a 2% lower offer ($88k) is reasonable based on typical stale-listing flexibility.
- 2 sale attempts; this cycle's ask has dropped $5k (5%) from the opening price — seller is motivated, your offer sets the floor, not the list.
Risks & watch-outs
- Watch-outs: flood insurance adds $427/mo.
- Climate carrying-cost: in FEMA flood zone AE (mandatory federal flood insurance); severe wildfire risk; extreme-heat days projected 6→14/yr by 2055 (HVAC capex compounding) — expect insurance premiums to compound above CPI over the hold.
Questions for the listing agent
- What's the actual annual flood-insurance premium (NFIP or private), and is the property in a SFHA with mandatory coverage?
- Is there a deadline driving the sale (1031 exchange, divorce, estate, relocation)? That informs how much negotiation room exists.
- Crime grade is F in this area — have there been break-ins, vandalism, or insurance claims at this property in the last 3 years? What carrier currently insures it and at what premium?
- What's the average days-on-market for RENTAL listings here right now (not sales)? A rising rental-DOM trend means longer vacancies and softer asking-rent achievability than the comps imply.
- What's the recent tenant-quality profile in this submarket — average credit score on applications, eviction rate, late-payment / NSF rate, and stable-employment percentage? A property-management company in the area should have these aggregated.
- How much new for-sale + rental construction is in the pipeline within 1–3 miles? Heavy new supply typically softens prices + rents 12–24 months out; constrained supply supports both.
Investment metrics
- 1% rule
- 1.89% ✓
- Cap rate
- 16.44%
- Cash-on-cash
- 36.24%
- DSCR
- 2.61
- GRM
- 4.4
CMA / ARV
- ARV (on-the-fly)
- $62,400
- Comps found
- 12
Show comp detail 12 sales within ~0.75 mi
| Address | Dist | Beds/Ba | Sqft | Sold | Price | $/sf | Match |
|---|---|---|---|---|---|---|---|
| 162 Casa Grande Dr | 0.01mi | 3/2.0 | 1,300 (+8%) | 4mo | $78,000 | $60 | 82 |
| 142 Casa Grande Dr | 0.02mi | 2/2.0 (-1) | 1,200 (0%) | 16mo | $40,000 | $33 | 81 |
| 69 Casa Grande Dr | 0.06mi | 2/2.0 (-1) | 1,120 (-7%) | 6mo | $80,000 | $71 | 76 |
| 90 Rio Vista Ln | 0.18mi | 2/2.0 (-1) | 1,200 (0%) | 14mo | $50,000 | $42 | 75 |
| 110 Casa Grande Dr Unit Rio Vista Estates | 0.03mi | 2/2.0 (-1) | 1,248 (+4%) | 21mo | $20,000 | $16 | 69 |
| 500 Casa Grande Dr #171 | 0.02mi | 2/2.0 (-1) | 1,152 (-4%) | 22mo | $85,490 | $74 | 69 |
| 90 Casa Grande Dr | 0.04mi | 2/2.0 (-1) | 1,032 (-14%) | 3mo | $13,000 | $13 | 67 |
| 103 Rio Vista Ln | 0.18mi | 2/2.0 (-1) | 1,248 (+4%) | 17mo | $45,000 | $36 | 66 |
| 63 Casa Grande Dr | 0.13mi | 3/2.0 | 1,296 (+8%) | 18mo | $80,000 | $62 | 66 |
| 106 Casa Grande Dr | 0.11mi | 2/2.0 (-1) | 1,268 (+6%) | 18mo | $18,000 | $14 | 65 |
| 49 Casa Grande Dr | 0.07mi | 3/2.0 | 1,344 (+12%) | 20mo | $69,900 | $52 | 60 |
| 45 Amber Ln | 0.38mi | 3/2.0 | 1,344 (+12%) | 18mo | $78,760 | $59 | 47 |
Match score weights: distance 35% · size 25% · config 20% · recency 20%. Top-matched comps best support the ARV.
Projected returns pro-forma
-3.0% appreciation · 0.98% rent growth · sell at horizon
- IRR
- 3.7%
- Equity multiple
- 1.14×
- Total profit
- $3,427
- Equity at exit
- $13,345
- IRR
- 10.5%
- Equity multiple
- 1.71×
- Total profit
- $17,873
- Equity at exit
- $7,738
Cash invested: $25,060 (down + closing). Projections, not guarantees.
Landlord ↔ Tenant lean methodology
- Overall (STATE)
- 18 Strongly Tenant-Friendly
- State California
- 18 Strongly Tenant-Friendly · D+13
- County
- — inherits STATE
- City
- — inherits STATE
ZIP-level market 96080
- Rents YoY
- 1.0%
- Active inventory
- 263
- Price-to-rent
- 4.4×
Monthly cashflow live
- Estimated rent
- $1,689 medium interval (Pro) →
- Mortgage (P&I)
- −$469
- Tax from tax record
- −$71 /mo · $854/yr
- Insurance
- −$37
- Flood insurance flood zone
- −$427 /mo · $5,118/yr
- HOA
- −$0
- Vacancy / Maint / Mgmt
- −$355
- Net cashflow
- $330
Break-even live
Sensitivity live
| Price | -10% $381 | -5% $356 | +0% $330 | +5% $305 | +10% $280 |
|---|---|---|---|---|---|
| Rent | -10% $197 | -5% $264 | +0% $330 | +5% $397 | +10% $464 |
| Rate | -1.0pp $375 | -0.5pp $353 | base $330 | +0.5pp $307 | +1.0pp $283 |
UW: 25.0% down · 7.5% · 30yr · 1.5% tax · 5.0% vac · 8.0% maint · 8.0% mgmt
Financing live
Cash to close
- Down payment
- $22,375
- Closing costs
- $2,685
- Reserves months
- —
- Total cash needed
- —
Loan-product check · same deal, 3 products live
Conventional
25% down · 7.5% · 30yr
- Down + closing
- —
- Monthly P&I
- —
- Monthly cashflow
- —
- DSCR
- —
- Eligible?
- —
Personal DTI + credit; lowest rate.
DSCR
20% down · 8.5% · 30yr
- Down + closing
- —
- Monthly P&I
- —
- Monthly cashflow
- —
- DSCR
- —
- Eligible?
- —
No personal income docs; deal must DSCR.
Hard money
10% down · 12.0% · 12mo
- Down + closing
- —
- Monthly P&I
- —
- Monthly cashflow
- —
- DSCR
- —
- Eligible?
- —
Short-term bridge; refi at stabilization.
Listing history 23 events
-
2026-06-21days on market $89,500 Active 26 DOM
-
2026-06-19days on market $89,500 Active 24 DOM
-
2026-06-18days on market $89,500 Active 23 DOM
-
2026-06-17days on market $89,500 Active 22 DOM
-
2026-06-16days on market $89,500 Active 21 DOM
-
2026-06-15days on market $89,500 Active 20 DOM
-
2026-06-14days on market $89,500 Active 18 DOM
-
2026-06-13price $89,500 Active 17 DOM
-
2026-06-12days on market $94,500 Active 17 DOM
-
2026-06-09days on market $94,500 Active 14 DOM
-
2026-06-08days on market $94,500 Active 13 DOM
-
2026-06-07days on market $94,500 Active 12 DOM
-
2026-06-05days on market $94,500 Active 9 DOM
-
2026-06-03days on market $94,500 Active 8 DOM
-
2026-06-02days on market $94,500 Active 7 DOM
-
2026-06-01days on market $94,500 Active 6 DOM
-
2026-05-31days on market $94,500 Active 5 DOM
-
2026-05-30days on market $94,500 Active 4 DOM
-
2026-05-27$94,500 Active
-
2026-05-05price $94,500
-
2026-04-01price $99,900
-
2026-02-05price $104,900
-
2025-12-26$110,000 Active
ⓘ Source: listings_history table (triggers on properties + properties_extension) + one-shot
backfill from property_details.listing_events for pre-trigger history.
Tax reassessment forecast CA · Resets to sale price
- Current annual tax
- $854 · $71/mo
- Projected year-2 tax
- $854 · $71/mo
- Expected delta
- $0/yr ($0/mo · 0.0%)
ⓘ Screening estimate from a state-policy table — verify with the county assessor before closing.
Climate risk First Street
- Flood 10/10 Extreme FEMA zone AE · 99% chance over 30 yrs
- Wildfire 8/10 Severe
- Heat 8/10 Severe 6 d/yr ≥105°F today · 14 d/yr by 30 yrs out
- Wind 1/10 Low
- Air quality 10/10 Extreme 32 unhealthy d/yr today · 34 by 30 yrs out
Nearby sold comps map
Loading sold comps map…
Walkable amenities ~0.75 mi
Loading nearby amenities…
Taxation est. · year 1
- Rental income
- $20,272
- − Mortgage interest
- −$5,013
- − Property taxes
- −$854
- − Insurance
- −$5,566
- − Repairs & maintenance
- −$1,622
- − Management
- −$1,622
- − Depreciation
- −$2,604
- Taxable income
- $2,992
- Est. tax owed @ 24.0%
- −$718
- After-tax cash flow
- $3,245/yr
For passive investors: Depreciation is non-cash, so a rental often shows a tax loss while cash-flowing — sheltering income. Rental losses are passive: they offset passive income freely, and up to $25,000/yr can offset ordinary (W-2) income if you actively participate and your MAGI is under $100k (phasing out to $0 by $150k); unused losses carry forward. On sale, claimed depreciation is recaptured at up to 25%, and gains may owe capital-gains tax (a 1031 exchange can defer both). Figures are a year-1 estimate at your 24.0% rate — not tax advice; consult a CPA.
Condition & rehab AI · 12 photos
This 2020 manufactured home is in excellent condition with new updates throughout, making it move-in ready and ideal for both resale and rental.
Value-add opportunities
- Both Landscaping and outdoor furniture — Enhances curb appeal and outdoor living space.
- Both Smart home integration — Improves convenience and energy efficiency for potential buyers/tenants.
Renovation cost estimate screening
Value-add ROI direction
- Both Landscaping and outdoor furniture — Enhances curb appeal and outdoor living space. ↑
- Both Smart home integration — Improves convenience and energy efficiency for potential buyers/tenants. ↑
ⓘ Cost ranges are severity-bucket heuristics (US national rule-of-thumb). Get contractor quotes + a written scope before underwriting a rehab budget.
Schools (NCES district)
- District
- Antelope Elementary
- NCES district ID
- 0602760
- Math proficiency
- 34% ▼ -11.00%
- Reading proficiency
- 44% ▼ -6.00%
- Median HH income
- $40,985
- Composite
- 32.77/100
- National rank
- #5630
- State rank
- #249 of 517 in CA
Livability — Red Bluff
- Score
- 58/100
- State rank
- #698
- US rank
- #21144
Category grades
Schools grade is shown separately in the Schools card above.
Census & demographics
- County
- Tehama County · 31,554 people
- City population
- 31,554
- Metro
- Red Bluff, CA
- Population (ZIP)
- 31,554
- Household income
- $66,076
- Rent vs Own
- Severe rent burden
- 981.0
Population outlook (Tehama County) Hauer SSP2
- Today (2025)
- 61,058 people
- By 2030
- 59,493 · -2.6%
- By 2040
- 56,076 · -8.2%
- By 2050
- 52,372 · -14.2%
- By 2075
- 43,895 · -28.1%
- By 2100
- 34,186 · -44.0%
Race, ethnicity, and origin ACS 2023
- Neighborhood character
- Predominantly White (71%)
- Race & ethnicity
- White 71% Hispanic / Latino 19% Two or more races 13% Native American 3% Black 2% Asian 1%
- Hispanic origin (detail)
- Mexican 17%
- Common ancestry
- Italian 2% Slovak 2% Lithuanian 2%
- Foreign-born
- 6% · Canada, Vietnam
- Languages at home
- 89% English-only · Spanish 9%
Political lean MEDSL · Tehama
- 2024 margin
- Solid R (+41.8) · D 27.9% · R 69.7% · Other 2.3%
- 2008→2024 swing
- -17.7pp toward R · 2008: -24.1pp · 2024: -41.8pp
- All cycles
- 2024: R+41.8 2020: R+35.6 2016: R+36.8 2012: R+27.4 2008: R+24.1
Not yet ingested
- Civics
- —
Market trends
- HPI YoY
- ▼ -139.80%
- Current HPI
- 246.877
- Rent YoY
- ▲ 0.98%
- Metro
- Red Bluff, CA
- State GDP YoY
- ▲ 3.21%
- F500 in state
- 116
Industry mix (Fortune 500 HQ in CA)
| Industry | F500 HQs | Revenue |
|---|---|---|
| Technology | 27 | $1,492B |
|
||
| Financial Services | 3 | $174B |
|
||
| Retail | 3 | $44B |
|
||
| Insurance | 3 | $26B |
|
||
| Media / Entertainment | 2 | $115B |
|
||
| Pharmaceuticals / Biotech | 2 | $62B |
|
||
Price history
-14.1% since first listed5 events — show timeline
- 2026-05-27 Listed $94,500 TCAOR
- 2026-05-05 Price Changed $94,500 TCAOR
- 2026-04-01 Price Changed $99,900 TCAOR
- 2026-02-05 Price Changed $104,900 TCAOR
- 2025-12-26 Listed $110,000 TCAOR
Property tax history
+0.0%/yrLatest (2025): $854 · -0.0% YoY. Source: county tax records.
Cash-flow waterfall
monthlySold comps — $/sqft
last 12 mo · ≤1 miLoading sold comps…