 Duplex
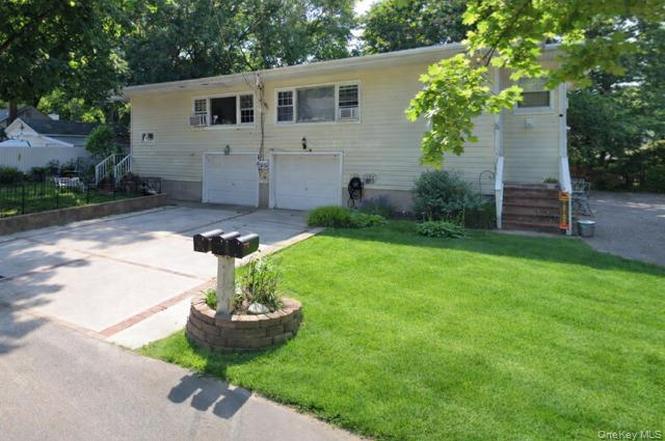
64 Eastport Dr · Sound Beach, NY
Flood risk 4/10 · Minor
- FEMA flood zone
- X (unshaded)
- Chance of flooding over 30 yrs
- 0.24%
- Est. flood insurance / yr
- $473 – $860
Fire risk 1/10 · Minimal
- Est. fire insurance / yr
- $691 – $1,283
Heat risk 5/10 · Moderate
- Hot days now (above 93°F)
- 7 days/yr
- Hot days in 30 yrs
- 17 days/yr
Wind risk 6/10 · Moderate
- Chance of severe wind over 30 yrs
- 77.0%
Air-quality risk 4/10 · Minor
- Unhealthy air days now
- 4 days/yr
- Unhealthy air days in 30 yrs
- 5 days/yr
Risk factors via First Street. Map © Google.
Why this score? — see what drove the D grade
The composite is a weighted blend of 9 inputs, each scored 0–100. Each bar is that input's sub-score; the figure is the points it added to the 100-point composite (weight × sub-score).
- Cash flow +12.0/30.0
- ARV discount +9.4/15.0
- Schools +5.9/10.0
- 1% rule +4.2/10.0
- DSCR +3.5/10.0
- Livability +3.5/5.0
- Rent growth +2.5/5.0
- Condition / age +2.5/5.0
- Appreciation +0.0/10.0
$699,000
🖨 Deal sheet 📄 Offer letter ✓ Due diligence
Multi-family units
County records classify this as Multi-Family (2-4 Unit). Listing-text estimate: 2 units. confirmed
Listing remarks
Welcome to 64 Eastport Drive, Sound Beach ! This waterfront community is located on the North part of the Town of Brookhaven in Suffolk County. This rare LEGAL TWO FAMILY home offers a blend of coastal living and exceptional versatility. This income- producing legal two family is thoughtfully maintained making it ideal for investors or extended family living. The property features two expansive units, one with 4 bedrooms, two bathrooms and the other with 5 bedrooms and two bathrooms, providing remarkable space and flexibility. Inside, you’ll find wood floors, stainless steel appliances, and modern updates to both kitchens and several bathrooms that enhance both comfort and functional
Key facts
- Modern updates
- Waterfront community
- Income producing
Tags
Neighborhood map
What this means for you Summary
Snapshot
- This is a 2 × 4-bed/2.0-bath units multifamily listed at $699k.
Deal economics
- At list price, monthly cash flow is $-166 ($-2k/yr) — negative. Per door: $-83/mo.
- To cash-flow at today's rent, offer at most $670k (4.2% below list).
- To meet the 1% rule (rent ≥ 1% of price), the offer needs to be $640k (8.4% below list).
- Recommended offer: $640k (8.4% below list) — sets the bar for 1% rule.
- Cap rate 6.0% vs local median 3.8% in Sound Beach — top-decile yield for the area; either an underpriced asset or a hidden risk that comps aren't pricing in. Stress-test before assuming the spread holds.
Location & tenants
- Location reads 70/100 on livability (#458 in NY) — a middle-class / working-renter tenant base. Strengths: employment A+, housing A+, crime B; Watch: amenities F, commute F, cost of living F.
- Rocky Point Union Free School District (suburban): math 67% / reading 64% proficiency, ranked #152 of 590 in NY (top 26%) — acceptable for families but not a draw, mixed tenant base, ~2y average lease; only 19% free/reduced lunch — higher-income household profile.
- Zoned schools: Rocky Point Middle School (math 52% / reading 67%, grade B, #161 of 729 statewide, top 24%, 638 students, 36% FRL); Rocky Point High School (math 93% / reading 70%, grade A, #484 of 1,100 statewide, top 44%, 923 students, 32% FRL).
- Market conditions: 70 active listings in the ZIP; 1,366 units permitted in Suffolk County in 2024 (216 in 5+ unit buildings).
Forward outlook
- Local home prices are declining (-3.0%/yr); year-one equity from $5k of loan paydown is wiped out by about $21k of value loss. Plan a longer hold.
- Suffolk County population projected to shrink 5% by 2050 — rents likely to lag national; underwrite the cash flow, not the appreciation.
Negotiation context
- Only 7 days on market — expect competitive offers; lowballing is unlikely to land.
- Current owner paid $388k; list at $699k implies a 80% gain — meaningful room to come down on a strong offer.
Risks & watch-outs
- Climate carrying-cost: major wind risk, 77% chance of damaging wind over 30y; extreme-heat days projected 7→17/yr by 2055 (HVAC capex compounding) — expect insurance premiums to compound above CPI over the hold.
Questions for the listing agent
- What do current leases actually rent for vs. the listed asking? Can we see a recent rent roll and the last 12 months of T-12 income?
- Can we see the unit-by-unit rent roll, current vacancy, and any below-market leases? What's the average tenancy length?
- What capital expenditures (roof, boiler, parking lot, exteriors) have been made in the last 5 years, and what's planned in the next 2?
- Built in 1968 — when were the roof, HVAC, electrical panel, plumbing, and water heater last replaced?
- Is there a deadline driving the sale (1031 exchange, divorce, estate, relocation)? That informs how much negotiation room exists.
- Schools are D-rated, which usually means shorter tenancies and higher turnover. Who's the typical renter profile here, and what's been the actual vacancy rate?
- The area grade is low — what's the realistic commute time and amenity access for the typical tenant pool here? Any planned neighborhood developments (good or bad) we should know about?
- What's the average days-on-market for RENTAL listings here right now (not sales)? A rising rental-DOM trend means longer vacancies and softer asking-rent achievability than the comps imply.
- What's the recent tenant-quality profile in this submarket — average credit score on applications, eviction rate, late-payment / NSF rate, and stable-employment percentage? A property-management company in the area should have these aggregated.
- How much new apartment / multifamily construction is in the pipeline within 1–3 miles? Heavy new supply (>2% of stock underway) typically softens rents 12–24 months out; light construction supports rent growth.
Investment metrics
- 1% rule
- 0.92% ✗
- Cap rate
- 6.01%
- Cash-on-cash
- -1.02%
- DSCR
- 0.95
- GRM
- 9.1
CMA / ARV
- ARV (on-the-fly)
- $728,990
- Comps found
- 1
Show comp detail 1 sale within ~0.75 mi
| Address | Dist | Beds/Ba | Sqft | Sold | Price | $/sf | Match |
|---|---|---|---|---|---|---|---|
| 64 Eastport Dr | 0.00mi | 9/4.0 (+1) | 2,710 (0%) | 1mo | $730,000 | $269 | 94 |
Match score weights: distance 35% · size 25% · config 20% · recency 20%. Top-matched comps best support the ARV.
Projected returns pro-forma
-3.0% appreciation · 3.0% rent growth · sell at horizon
- IRR
- -17.9%
- Equity multiple
- 0.37×
- Total profit
- $-123,476
- Equity at exit
- $104,223
- IRR
- -10.0%
- Equity multiple
- 0.39×
- Total profit
- $-119,730
- Equity at exit
- $60,437
Cash invested: $195,720 (down + closing). Projections, not guarantees.
Landlord ↔ Tenant lean methodology
- Overall (STATE)
- 15 Strongly Tenant-Friendly
- State New York
- 15 Strongly Tenant-Friendly · D+10
- County
- — inherits STATE
- City
- — inherits STATE
ZIP-level market 11789
- Home prices YoY
- -33.0%
- Active inventory
- 70
- Price-to-rent
- 18.2×
Monthly cashflow live
- Estimated rent
- $6,400 medium interval (Pro) →
- Mortgage (P&I)
- −$3,666
- Tax from tax record
- −$1,265 /mo · $15,176/yr
- Insurance
- −$291
- HOA
- −$0
- Vacancy / Maint / Mgmt
- −$1,344
- Net cashflow
- $-166
Break-even live
2-unit breakdown (identical units grouped — click to expand)
| Units | Beds | Baths | Est. rent |
|---|---|---|---|
| 2× units | 4 | 2 | $6,400 |
| #1 | 4 | 2 | $3,200 |
| #2 | 4 | 2 | $3,200 |
| Total (2 units) | $6,400 | ||
UW: 25.0% down · 7.5% · 30yr · 1.5% tax · 5.0% vac · 8.0% maint · 8.0% mgmt
Financing live
Cash to close
- Down payment
- $174,750
- Closing costs
- $20,970
- Reserves months
- —
- Total cash needed
- —
Loan-product check · same deal, 3 products live
Conventional
25% down · 7.5% · 30yr
- Down + closing
- —
- Monthly P&I
- —
- Monthly cashflow
- —
- DSCR
- —
- Eligible?
- —
Personal DTI + credit; lowest rate.
DSCR
20% down · 8.5% · 30yr
- Down + closing
- —
- Monthly P&I
- —
- Monthly cashflow
- —
- DSCR
- —
- Eligible?
- —
No personal income docs; deal must DSCR.
Hard money
10% down · 12.0% · 12mo
- Down + closing
- —
- Monthly P&I
- —
- Monthly cashflow
- —
- DSCR
- —
- Eligible?
- —
Short-term bridge; refi at stabilization.
Listing history 4 events
-
2026-02-05status Pending
-
2026-01-29$699,000 Active
-
2007-04-10soldstatus $388,000
-
2001-04-26soldstatus $262,500
ⓘ Source: listings_history table (triggers on properties + properties_extension) + one-shot
backfill from property_details.listing_events for pre-trigger history.
Tax reassessment forecast NY · Partial reset (capped growth)
- Current annual tax
- $15,176 · $1,265/mo
- Projected year-2 tax
- $15,176 · $1,265/mo
- Expected delta
- $0/yr ($0/mo · 0.0%)
ⓘ Screening estimate from a state-policy table — verify with the county assessor before closing.
Climate risk First Street
- Flood 4/10 Moderate FEMA zone X (unshaded) · 24% chance over 30 yrs
- Wildfire 1/10 Low
- Heat 5/10 Major 7 d/yr ≥93°F today · 17 d/yr by 30 yrs out
- Wind 6/10 Major 77% chance of damaging wind over 30 yrs
- Air quality 4/10 Moderate 4 unhealthy d/yr today · 5 by 30 yrs out
Nearby sold comps map
Loading sold comps map…
Walkable amenities ~0.75 mi
Loading nearby amenities…
Taxation est. · year 1
- Rental income
- $76,800
- − Mortgage interest
- −$39,155
- − Property taxes
- −$15,176
- − Insurance
- −$3,495
- − Repairs & maintenance
- −$6,144
- − Management
- −$6,144
- − Depreciation
- −$20,335
- Taxable loss
- −$13,649
- Est. tax savings @ 24.0%
- +$3,276
- After-tax cash flow
- $1,289/yr
For passive investors: Depreciation is non-cash, so a rental often shows a tax loss while cash-flowing — sheltering income. Rental losses are passive: they offset passive income freely, and up to $25,000/yr can offset ordinary (W-2) income if you actively participate and your MAGI is under $100k (phasing out to $0 by $150k); unused losses carry forward. On sale, claimed depreciation is recaptured at up to 25%, and gains may owe capital-gains tax (a 1031 exchange can defer both). Figures are a year-1 estimate at your 24.0% rate — not tax advice; consult a CPA.
Schools (NCES district)
- District
- Rocky Point Union Free School District
- NCES district ID
- 3624840
- Math proficiency
- 67% ▼ -4.00%
- Reading proficiency
- 64% ▼ -7.00%
- Median HH income
- $86,256
- Composite
- 59.12/100
- National rank
- #953
- State rank
- #152 of 590 in NY
Livability — Sound Beach
- Score
- 70/100
- State rank
- #458
- US rank
- #7991
Category grades
Schools grade is shown separately in the Schools card above.
Census & demographics
- Census place
- Sound Beach, NY
- City population
- 7,447
- Population (ZIP)
- 7,447
Population outlook (Suffolk County) Hauer SSP2
- Today (2025)
- 1,505,262 people
- By 2030
- 1,498,318 · -0.5%
- By 2040
- 1,471,101 · -2.3%
- By 2050
- 1,424,848 · -5.3%
- By 2075
- 1,337,157 · -11.2%
- By 2100
- 1,217,720 · -19.1%
Race, ethnicity, and origin ACS 2023
- Neighborhood character
- Predominantly White (82%)
- Race & ethnicity
- White 82% Two or more races 11% Hispanic / Latino 9% Black 3%
- Hispanic origin (detail)
- Puerto Rican 1%
- Common ancestry
- Romanian 9% Slovak 6% Italian 3%
- Foreign-born
- 7% · Canada, Jamaica, China
- Languages at home
- 92% English-only · Spanish 4% Russian/Polish/Slavic 1% Other Asian/Pacific 1%
Political lean MEDSL · Suffolk
- 2024 margin
- Lean R (+10.0) · D 45.0% · R 55.0%
- 2008→2024 swing
- -16.0pp toward R · 2008: 6.0pp · 2024: -10.0pp
- All cycles
- 2024: R+10.0 2020: R+0.0 2016: R+8.2 2012: D+2.9 2008: D+6.0
Not yet ingested
- Civics
- —
Market trends
- HPI YoY
- ▼ -180.99%
- Current HPI
- 366.6474
- Rent YoY
- —
- Metro
- —
- State GDP YoY
- ▲ 2.60%
- F500 in state
- 92
Industry mix (Fortune 500 HQ in NY)
| Industry | F500 HQs | Revenue |
|---|---|---|
| Financial Services | 10 | $950B |
|
||
| Consumer Goods | 9 | $162B |
|
||
| Insurance | 4 | $225B |
|
||
| Telecommunications | 2 | $144B |
|
||
| Pharmaceuticals | 2 | $112B |
|
||
| Media / Entertainment | 2 | $69B |
|
||
Price history
+166.3% since first listed4 events — show timeline
- 2026-02-05 Pending — OneKey® MLS as Distributed by MLS Grid
- 2026-01-29 Listed $699,000 OneKey® MLS as Distributed by MLS Grid
- 2007-04-10 Sold (Public Records) $388,000 Public Records
- 2001-04-26 Sold (Public Records) $262,500 Public Records
Property tax history
+0.1%/yrLatest (2025): $15,176 · +0.0% YoY. Source: county tax records.
Cash-flow waterfall
monthlySold comps — $/sqft
last 12 mo · ≤1 miLoading sold comps…