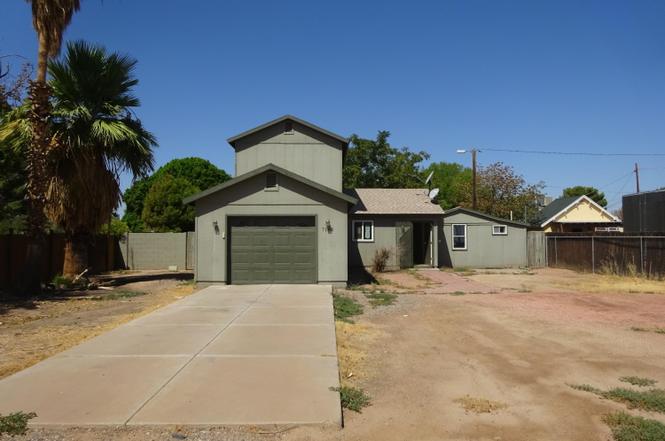
7148 N 48th Ave · Glendale, AZ
Flood risk 1/10 · Minimal
- FEMA flood zone
- X (shaded)
- Chance of flooding over 30 yrs
- 0.0%
- Est. flood insurance / yr
- $507 – $1,088
Fire risk 1/10 · Minimal
- Est. fire insurance / yr
- $610 – $1,132
Heat risk 9/10 · Severe
- Hot days now (above 112°F)
- 7 days/yr
- Hot days in 30 yrs
- 19 days/yr
Wind risk 1/10 · Minimal
- Chance of severe wind over 30 yrs
- —
Air-quality risk 2/10 · Minimal
- Unhealthy air days now
- 0 days/yr
- Unhealthy air days in 30 yrs
- 1 days/yr
Risk factors via First Street. Map © Google.
Why this score? — see what drove the C- grade
The composite is a weighted blend of 9 inputs, each scored 0–100. Each bar is that input's sub-score; the figure is the points it added to the 100-point composite (weight × sub-score).
- Cash flow +16.5/30.0
- ARV discount +15.0/15.0
- DSCR +5.1/10.0
- Livability +3.8/5.0
- 1% rule +3.6/10.0
- Condition / age +2.5/5.0
- Schools +2.3/10.0
- Rent growth +1.8/5.0
- Appreciation +0.0/10.0
$245,280
🖨 Deal sheet (PDF) 📄 Offer letter ✓ Due diligence
Listing remarks MLS
Renovated home from a 2 bedroom to a 5 bedroom. Buyer to verify room measurements.
Key facts
- Easy freeway access
- Top rated schools
- Outdoor oasis
Tags
Neighborhood map
What this means for you Summary
Snapshot
- This is a 5-bed/2.0-bath single-family listed at $245k.
Deal economics
- At list price, monthly cash flow is $145 ($2k/yr) — positive.
- The deal already cash-flows at list — no discount required.
- To meet the 1% rule (rent ≥ 1% of price), the offer needs to be $211k (14.1% below list).
- Recommended offer: $211k (14.1% below list) — sets the bar for 1% rule.
- Cap rate 7.0% vs local median 3.5% in Glendale — top-decile yield for the area; either an underpriced asset or a hidden risk that comps aren't pricing in. Stress-test before assuming the spread holds.
Location & tenants
- Location reads 76/100 on livability (#12 in AZ, #3,235 nationally) — a middle-class / working-renter tenant base. Strengths: commute A+, housing A+, amenities B; Watch: health & safety D+, crime F.
- Glendale Union High School District (4285) (urban): math 23% / reading 31% proficiency, ranked #130 of 249 in AZ (top 52%) — low school quality limits family demand, transient renter base, plan for 1-2y turnover.
- Zoned schools: Apollo High School (math 26% / reading 30%, grade F, #136 of 381 statewide, top 36%, 2,198 students, 57% FRL).
- Market conditions: Rents soft (-3.0%/yr); 220 active listings in the ZIP; 10 comparable units currently listed for rent nearby; rentals leasing fast (median 3d on market — plan ~1-2 weeks tenant-placement turnaround); 36,011 units permitted in Maricopa County in 2024 (12,801 in 5+ unit buildings).
- At $2,107/mo this rent would consume 47% of the median local household income ($54k/yr) (locally 3741% of renters already pay >50% of income on rent) — very limited rent-growth headroom before tenants either downsize or default.
Forward outlook
- Local home prices are declining (-3.0%/yr); year-one equity from $2k of loan paydown is wiped out by about $7k of value loss. Plan a longer hold.
- Maricopa County population projected at +38% by 2050 — long-run rental-demand tailwind backs the buy-and-hold thesis.
Negotiation context
- It's been on market 101 days — a 9% lower offer ($223k) is reasonable based on typical stale-listing flexibility.
- 11 sale attempts since 21y ago; this cycle's ask has dropped $47k (16%) from the opening price — seller is motivated, your offer sets the floor, not the list.
Risks & watch-outs
- Watch-outs: built in 1948 — expect roof / HVAC / electrical / plumbing capex.
- Climate carrying-cost: extreme-heat days projected 7→19/yr by 2055 (HVAC capex compounding) — expect insurance premiums to compound above CPI over the hold.
Questions for the listing agent
- It's been on market 101 days. Have you received any prior offers? Is the seller open to a 14% concession, seller financing, or rate buy-down credit?
- Built in 1948 — when were the roof, HVAC, electrical panel, plumbing, and water heater last replaced?
- Why hasn't it sold? Are there any deal-killer items the seller is aware of (foundation, flood, title, zoning, code violations)?
- Is there a deadline driving the sale (1031 exchange, divorce, estate, relocation)? That informs how much negotiation room exists.
- Crime grade is F in this area — have there been break-ins, vandalism, or insurance claims at this property in the last 3 years? What carrier currently insures it and at what premium?
- What's the average days-on-market for RENTAL listings here right now (not sales)? A rising rental-DOM trend means longer vacancies and softer asking-rent achievability than the comps imply.
- What's the recent tenant-quality profile in this submarket — average credit score on applications, eviction rate, late-payment / NSF rate, and stable-employment percentage? A property-management company in the area should have these aggregated.
- How much new for-sale + rental construction is in the pipeline within 1–3 miles? Heavy new supply typically softens prices + rents 12–24 months out; constrained supply supports both.
Investment metrics
- 1% rule
- 0.86% ✗
- Cap rate
- 7.00%
- Cash-on-cash
- 2.53%
- DSCR
- 1.11
- GRM
- 9.7
CMA / ARV
- ARV (on-the-fly)
- $357,840
- Comps found
- 9
Show comp detail 9 sales within ~0.75 mi
| Address | Dist | Beds/Ba | Sqft | Sold | Price | $/sf | Match |
|---|---|---|---|---|---|---|---|
| 7148 N 48th Ave | 0.00mi | 5/2.0 | 1,420 (0%) | 1mo | $240,000 | $169 | 100 |
| 4720 W Northview Ave | 0.19mi | 4/2.0 (-1) | 1,448 (+2%) | 12mo | $419,000 | $289 | 73 |
| 4938 W Mclellan Rd | 0.59mi | 5/2.0 | 1,458 (+3%) | 1mo | $370,000 | $254 | 67 |
| 4717 W Nicolet Ave | 0.14mi | 5/4.0 | 1,319 (-7%) | 21mo | $562,000 | $426 | 56 |
| 4913 W Maryland Ave | 0.71mi | 4/2.0 (-1) | 1,425 (+0%) | 10mo | $330,000 | $232 | 53 |
| 5301 W State Ave | 0.63mi | 4/2.0 (-1) | 1,530 (+8%) | 0mo | $385,000 | $252 | 52 |
| 5031 W Flynn Ln | 0.41mi | 4/1.0 (-1) | 1,304 (-8%) | 15mo | $322,000 | $247 | 46 |
| 4447 W Morten Ave | 0.59mi | 4/2.0 (-1) | 1,319 (-7%) | 21mo | $390,000 | $296 | 39 |
| 4349 W Morten Ave | 0.67mi | 4/2.0 (-1) | 1,600 (+13%) | 13mo | $369,995 | $231 | 32 |
Match score weights: distance 35% · size 25% · config 20% · recency 20%. Top-matched comps best support the ARV.
Projected returns pro-forma
-3.0% appreciation · 0.0% rent growth · sell at horizon
- IRR
- -15.4%
- Equity multiple
- 0.46×
- Total profit
- $-36,770
- Equity at exit
- $36,572
- IRR
- -12.5%
- Equity multiple
- 0.35×
- Total profit
- $-44,311
- Equity at exit
- $21,207
Cash invested: $68,678 (down + closing). Projections, not guarantees.
Landlord ↔ Tenant lean methodology
- Overall (STATE)
- 87 Strongly Landlord-Friendly
- State Arizona
- 87 Strongly Landlord-Friendly · R+3
- County
- — inherits STATE
- City
- — inherits STATE
ZIP-level market 85301
- Home prices YoY
- -10.6%
- Rents YoY
- -3.0%
- Active inventory
- 220
- Price-to-rent
- 9.7×
Monthly cashflow live
- Estimated rent
- $2,107 high interval (Pro) →
- Mortgage (P&I)
- −$1,286
- Tax from tax record
- −$131 /mo · $1,575/yr
- Insurance
- −$102
- HOA
- −$0
- Vacancy / Maint / Mgmt
- −$442
- Net cashflow
- $145
Break-even live
Sensitivity live
| Price | -10% $284 | -5% $214 | +0% $145 | +5% $75 | +10% $6 |
|---|---|---|---|---|---|
| Rent | -10% $-22 | -5% $62 | +0% $145 | +5% $228 | +10% $311 |
| Rate | -1.0pp $268 | -0.5pp $207 | base $145 | +0.5pp $81 | +1.0pp $17 |
UW: 25.0% down · 7.5% · 30yr · 1.5% tax · 5.0% vac · 8.0% maint · 8.0% mgmt
Financing live
Cash to close
- Down payment
- $61,320
- Closing costs
- $7,358
- Reserves months
- —
- Total cash needed
- —
Loan-product check · same deal, 3 products live
Conventional
25% down · 7.5% · 30yr
- Down + closing
- —
- Monthly P&I
- —
- Monthly cashflow
- —
- DSCR
- —
- Eligible?
- —
Personal DTI + credit; lowest rate.
DSCR
20% down · 8.5% · 30yr
- Down + closing
- —
- Monthly P&I
- —
- Monthly cashflow
- —
- DSCR
- —
- Eligible?
- —
No personal income docs; deal must DSCR.
Hard money
10% down · 12.0% · 12mo
- Down + closing
- —
- Monthly P&I
- —
- Monthly cashflow
- —
- DSCR
- —
- Eligible?
- —
Short-term bridge; refi at stabilization.
Rent comps 10 comps
| Address | Beds | Baths | Sqft | Rent | $/sqft | DOM | Units | Dist |
|---|---|---|---|---|---|---|---|---|
| 5037 W Krall St Glendale, AZ | 4.0 | 2.0 | 1449 | $2,026 | $1.40 | 6d | 1 | 0.54mi |
| 6734 N 43rd Ave Glendale, AZ | 4.0 | 2.0 | 1576 | $2,700 | $1.71 | 4d | 1 | 0.74mi |
| 7854 N 47th Ave Glendale, AZ | 4.0 | 2.5 | 1656 | $1,800 | $1.09 | 0d | 1 | 0.78mi |
| 7776 N 55th Dr Glendale, AZ | 4.0 | 2.0 | 1842 | $2,200 | $1.19 | 0d | 1 | 1.08mi |
| 4032 W Stella Ln Phoenix, AZ | 4.0 | 2.0 | 1526 | $2,200 | $1.44 | 0d | 1 | 1.21mi |
| 3724 W Gardenia Ave Phoenix, AZ | 4.0 | 2.0 | 1536 | $2,795 | $1.82 | 0d | 1 | 1.36mi |
| 8037 N 40th Ave Phoenix, AZ | 4.0 | 2.0 | 1595 | $2,200 | $1.38 | 13d | 1 | 1.38mi |
| 3627 W Northview Ave Phoenix, AZ | 5.0 | 2.0 | 1844 | $1,895 | $1.03 | 0d | 1 | 1.49mi |
| 4303 W Solano Dr N Glendale, AZ | 4.0 | 2.5 | 1700 | $1,795 | $1.06 | 3d | 1 | 1.49mi |
| 3816 W Northern Ave Phoenix, AZ | 4.0 | 2.0 | 1600 | $1,796 | $1.12 | 3d | 1 | 1.49mi |
Listing history 34 events
-
2026-05-20status Pending
-
2026-05-19soldstatus Closed
-
2026-04-21status Pending
-
2026-04-17soldstatus Closed
-
2026-02-27status Pending
-
2026-02-24status Active
-
2026-01-28status Pending
-
2026-01-13price $245,280
-
2025-12-14price $268,640
-
2025-12-10status Active
-
2025-11-20status Active
-
2025-10-10status Pending
-
2025-10-10historical
-
2025-10-09historical
-
2025-08-21$292,000 Active
-
2022-06-02soldstatus $295,000
-
2013-04-22soldstatus $45,000 Closed 82-char remark
Show marketing remark (82 chars)
Renovated home from a 2 bedroom to a 5 bedroom. Buyer to verify room measurements.
-
2013-04-18soldstatus $45,000
-
2013-04-05historical 82-char remark
Show marketing remark (82 chars)
Renovated home from a 2 bedroom to a 5 bedroom. Buyer to verify room measurements.
-
2013-04-05$45,000 82-char remark
Show marketing remark (82 chars)
Renovated home from a 2 bedroom to a 5 bedroom. Buyer to verify room measurements.
-
2010-02-04historical
-
2010-01-22$112,000
-
2009-11-30historical
-
2009-06-30$122,900
-
2008-12-31historical
-
2008-03-06$165,000
-
2006-12-21historical
-
2006-10-29$149,900
-
2006-10-11historical
-
2006-09-15$157,900
-
2006-02-06soldstatus $119,900
-
2005-11-30soldstatus $120,000
-
2005-11-01historical
-
2005-09-03$129,900
ⓘ Source: listings_history table (triggers on properties + properties_extension) + one-shot
backfill from property_details.listing_events for pre-trigger history.
Tax reassessment forecast AZ · Resets to sale price
- Current annual tax
- $1,575 · $131/mo
- Projected year-2 tax
- $1,619 · $135/mo
- Expected delta
- +$44/yr (+$4/mo · 2.8%)
ⓘ Screening estimate from a state-policy table — verify with the county assessor before closing.
Climate risk First Street
- Flood 1/10 Low FEMA zone X (shaded) · 0% chance over 30 yrs
- Wildfire 1/10 Low
- Heat 9/10 Extreme 7 d/yr ≥112°F today · 19 d/yr by 30 yrs out
- Wind 1/10 Low
- Air quality 2/10 Low 0 unhealthy d/yr today · 1 by 30 yrs out
Nearby sold comps map
Loading sold comps map…
Walkable amenities ~0.75 mi
Loading nearby amenities…
Taxation est. · year 1
- Rental income
- $25,284
- − Mortgage interest
- −$13,739
- − Property taxes
- −$1,575
- − Insurance
- −$1,226
- − Repairs & maintenance
- −$2,023
- − Management
- −$2,023
- − Depreciation
- −$7,135
- Taxable loss
- −$2,437
- Est. tax savings @ 24.0%
- +$585
- After-tax cash flow
- $2,323/yr
For passive investors: Depreciation is non-cash, so a rental often shows a tax loss while cash-flowing — sheltering income. Rental losses are passive: they offset passive income freely, and up to $25,000/yr can offset ordinary (W-2) income if you actively participate and your MAGI is under $100k (phasing out to $0 by $150k); unused losses carry forward. On sale, claimed depreciation is recaptured at up to 25%, and gains may owe capital-gains tax (a 1031 exchange can defer both). Figures are a year-1 estimate at your 24.0% rate — not tax advice; consult a CPA.
Schools (NCES district)
- District
- Glendale Union High School District (4285)
- NCES district ID
- 0403450
- Math proficiency
- 23% ▼ -38.00%
- Reading proficiency
- 31% ▼ -19.00%
- Median HH income
- $40,846
- Composite
- 22.81/100
- National rank
- #8020
- State rank
- #130 of 249 in AZ
Livability — Glendale
- Score
- 76/100
- State rank
- #12
- US rank
- #3235
Category grades
Schools grade is shown separately in the Schools card above.
Census & demographics
- Census place
- Glendale, AZ
- County
- Maricopa County · 4,537,380 people
- City population
- 294,586
- Metro
- Phoenix-Mesa-Chandler, AZ
- Population (ZIP)
- 68,178
- Household income
- $53,827
- Rent vs Own
- Severe rent burden
- 3741.0
Population outlook (Maricopa County) Hauer SSP2
- Today (2025)
- 4,979,203 people
- By 2030
- 5,378,229 · +8.0%
- By 2040
- 6,156,598 · +23.6%
- By 2050
- 6,872,376 · +38.0%
- By 2075
- 8,401,270 · +68.7%
- By 2100
- 9,247,439 · +85.7%
Race, ethnicity, and origin ACS 2023
- Neighborhood character
- Majority Hispanic (63%)
- Race & ethnicity
- Hispanic / Latino 63% Two or more races 37% White 22% Black 8% Asian 2% Native American 2%
- Hispanic origin (detail)
- Mexican 57% Cuban 1%
- Common ancestry
- Slovak 1% Italian 1%
- Foreign-born
- 26% · Canada, Vietnam, Philippines
- Languages at home
- 46% English-only · Spanish 48% Arabic 1% Other Indo-European 1%
Political lean MEDSL · Maricopa
- 2024 margin
- Toss-up / Even · D 47.7% · R 51.2% · Other 1.1%
- 2008→2024 swing
- +7.1pp toward D · 2008: -10.6pp · 2024: -3.5pp
- All cycles
- 2024: R+3.5 2020: D+2.2 2016: R+3.5 2012: R+12.0 2008: R+10.6
Not yet ingested
- Civics
- —
Market trends
- HPI YoY
- ▼ -50.49%
- Current HPI
- 427.3069
- Rent YoY
- ▼ -2.98%
- Metro
- Phoenix-Mesa-Chandler, AZ
- State GDP YoY
- ▲ 4.54%
- F500 in state
- 20
Industry mix (Fortune 500 HQ in AZ)
| Industry | F500 HQs | Revenue |
|---|---|---|
| Technology | 2 | $13B |
|
||
| Mining / Metals | 1 | $23B |
|
||
| Environmental Services | 1 | $16B |
|
||
| Metals / Steel | 1 | $14B |
|
||
| Technology Distribution | 1 | $9B |
|
||
| Homebuilding | 1 | $8B |
|
||
Price history
+88.8% since first listed34 events — show timeline
- 2026-05-20 Pending — ARMLS
- 2026-05-19 Sold (MLS) — ARMLS
- 2026-04-21 Pending — ARMLS
- 2026-04-17 Sold (MLS) — ARMLS
- 2026-02-27 Pending — ARMLS
- 2026-02-24 Relisted — ARMLS
- 2026-01-28 Pending — ARMLS
- 2026-01-13 Price Changed $245,280 ARMLS
- 2025-12-14 Price Changed $268,640 ARMLS
- 2025-12-10 Relisted — ARMLS
- 2025-11-20 Relisted — ARMLS
- 2025-10-10 Pending — ARMLS
- 2025-10-10 Listing Removed — ARMLS
- 2025-10-09 Listing Removed — ARMLS
- 2025-08-21 Listed $292,000 ARMLS
- 2022-06-02 Sold (Public Records) $295,000 Public Records
- 2013-04-22 Sold (MLS) $45,000 ARMLS
- 2013-04-18 Sold (Public Records) $45,000 Public Records
- 2013-04-05 Listed $45,000 ARMLS
- 2013-04-05 Listing Removed — ARMLS
- 2010-02-04 Listing Removed — ARMLS
- 2010-01-22 Listed $112,000 ARMLS
- 2009-11-30 Listing Removed — ARMLS
- 2009-06-30 Listed $122,900 ARMLS
- 2008-12-31 Listing Removed — ARMLS
- 2008-03-06 Listed $165,000 ARMLS
- 2006-12-21 Listing Removed — ARMLS
- 2006-10-29 Listed $149,900 ARMLS
- 2006-10-11 Listing Removed — ARMLS
- 2006-09-15 Listed $157,900 ARMLS
- 2006-02-06 Sold (Public Records) $119,900 Public Records
- 2005-11-30 Sold (MLS) $120,000 ARMLS
- 2005-11-01 Listing Removed — ARMLS
- 2005-09-03 Listed $129,900 ARMLS
Property tax history
+5.5%/yrLatest (2025): $1,575 · +4.1% YoY. Source: county tax records.
Cash-flow waterfall
monthlySold comps — $/sqft
last 12 mo · ≤1 miLoading sold comps…