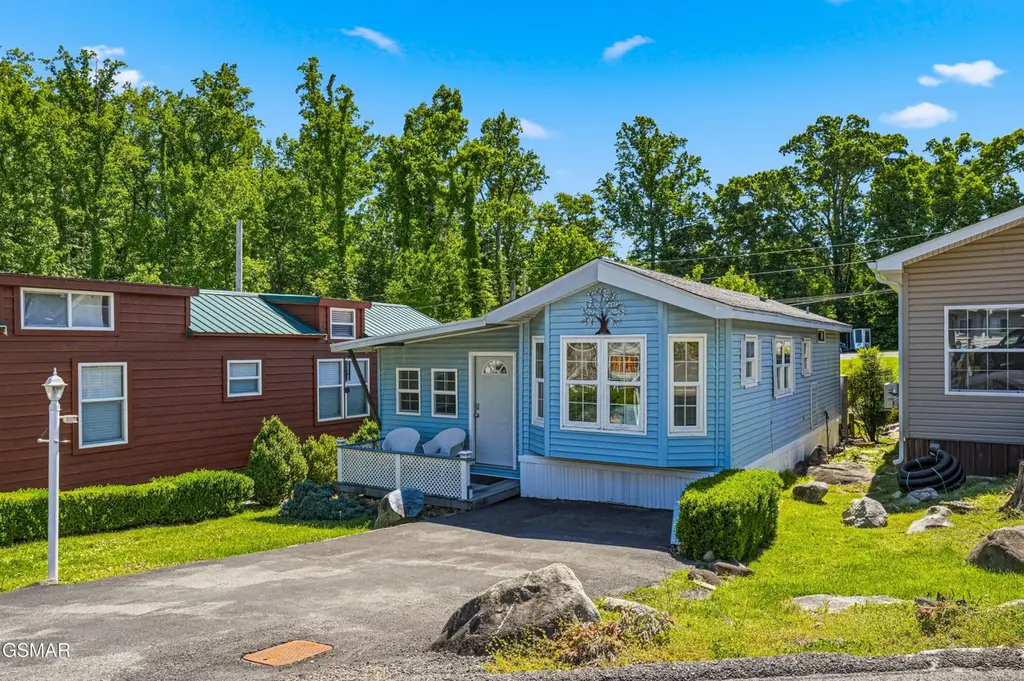
5355 Parkway Pkwy #25 · Cosby, TN
Flood risk 1/10 · Minimal
- FEMA flood zone
- X (unshaded)
- Chance of flooding over 30 yrs
- 0.0%
- Est. flood insurance / yr
- $507 – $1,088
Fire risk 4/10 · Minor
- Est. fire insurance / yr
- $949 – $1,763
Heat risk 4/10 · Minor
- Hot days now (above 85°F)
- 9 days/yr
- Hot days in 30 yrs
- 25 days/yr
Wind risk 2/10 · Minimal
- Chance of severe wind over 30 yrs
- —
Air-quality risk 2/10 · Minimal
- Unhealthy air days now
- 1 days/yr
- Unhealthy air days in 30 yrs
- 2 days/yr
Risk factors via First Street. Map © Google.
Why this score? — see what drove the B+ grade
The composite is a weighted blend of 9 inputs, each scored 0–100. Each bar is that input's sub-score; the figure is the points it added to the 100-point composite (weight × sub-score).
- Cash flow +30.0/30.0
- 1% rule +10.0/10.0
- DSCR +10.0/10.0
- Appreciation +10.0/10.0
- ARV discount +7.5/15.0
- Condition / age +3.8/5.0
- Rent growth +2.5/5.0
- Schools +2.5/10.0
- Livability +2.5/5.0
$159,900
🖨 Deal sheet 📄 Offer letter ✓ Due diligence
Listing remarks
Escape to the Smokies with this immaculate, move-in-ready Chariot Eagle Park Model featuring a spacious 12' x 38' addition! The main park model includes two dedicated bedrooms with queen and double beds, a twin size cabinet Murphy bed, a full bath, a large dining area with a maple table and four chairs, and a fully equipped kitchen featuring a glass-top electric stove, large microwave, and a refrigerator with an ice maker. For maximum comfort, the home boasts upgraded double-pane insulated windows, ceiling fans throughout, central heat and air, and a tankless hot water heater for endless hot water. The impressive addition functions as the ultimate entertainment hub, highlighted by a cozy, t
Key facts
- Move in ready
- Fully furnished
- Large walnut top bar
Tags
Property features AI
Finance
- HOA & community: Homeowners association with monthly fee of $235; HOA covers cable TV, internet, grounds maintenance, sewer, trash, and water; Community amenities include clubhouse, gated entry, playground, pool, tennis courts, picnic area, recreation facilities, and security
Exterior
- Utilities: Public water; Shared septic
- Home design: Manufactured home; Single-story
- Construction: Built as a manufactured home
- Exterior features: Porch; Landscaped lot
Interior
- Kitchen: Electric range; Microwave; Refrigerator
- Bathrooms: 1 full bathroom
- Heating & cooling: Central heating; Central air; Wall unit(s) for cooling
- Interior features: Ceiling fan(s); Double pane windows; Furnished; Gas log fireplace (1)
- Laundry & utility: Washer; Dryer
Neighborhood map
What this means for you Summary
Snapshot
- This is a 2-bed/1.0-bath manufactured listed at $160k. Condition is rated good.
Deal economics
- At list price, monthly cash flow is $4k ($46k/yr) — positive.
- The deal already cash-flows at list — no discount required.
- Meets the 1% rule at list price ($7k rent vs $160k).
- Recommended offer: $158k (1.5% below list) — sets the bar for market timing.
- Cap rate 34.9% vs local median 2.3% in Cosby — top-decile yield for the area; either an underpriced asset or a hidden risk that comps aren't pricing in. Stress-test before assuming the spread holds.
Location & tenants
- Location reads: area grade B — affects rentability + tenant quality, not the cash-flow math above.
- Sevier County (rural): math 31% / reading 28% proficiency, ranked #62 of 139 in TN (top 45%) — low school quality limits family demand, transient renter base, plan for 1-2y turnover.
- Market conditions: 168 active listings in the ZIP; 1 comparable units currently listed for rent nearby; 1,594 units permitted in Sevier County in 2024 (456 in 5+ unit buildings).
Forward outlook
- In year one you build about $17k of equity ($1k loan paydown + $16k appreciation (10.0% local appreciation)).
- Sevier County population projected at +22% by 2050 — long-run rental-demand tailwind backs the buy-and-hold thesis.
- At projected returns (10.0% appreciation + 3.0% rent growth), your $45k cash investment doubles in ~1 year — after that, you're playing with house money.
- By year 3, paydown + projected appreciation supports a ~$43k cash-out refi (75% LTV) — recoverable capital for the next deal without selling this one.
Negotiation context
- It's been on market 24 days — a 2% lower offer ($158k) is reasonable based on typical stale-listing flexibility.
Questions for the listing agent
- What does the HOA fee cover, when was the last increase, and are there any pending special assessments or reserve-fund shortfalls?
- Is there a deadline driving the sale (1031 exchange, divorce, estate, relocation)? That informs how much negotiation room exists.
- What's the average days-on-market for RENTAL listings here right now (not sales)? A rising rental-DOM trend means longer vacancies and softer asking-rent achievability than the comps imply.
- What's the recent tenant-quality profile in this submarket — average credit score on applications, eviction rate, late-payment / NSF rate, and stable-employment percentage? A property-management company in the area should have these aggregated.
- How much new for-sale + rental construction is in the pipeline within 1–3 miles? Heavy new supply typically softens prices + rents 12–24 months out; constrained supply supports both.
Investment metrics
- 1% rule
- 4.08% ✓
- Cap rate
- 34.89%
- Cash-on-cash
- 102.14%
- DSCR
- 5.54
- GRM
- 2.0
CMA / ARV
- ARV (on-the-fly)
- $98,496
- Comps found
- 2
Show comp detail 2 sales within ~0.75 mi
| Address | Dist | Beds/Ba | Sqft | Sold | Price | $/sf | Match |
|---|---|---|---|---|---|---|---|
| 5355 East Pkwy #28 | 0.07mi | 2/2.0 | 920 (+6%) | 12mo | $75,000 | $82 | 72 |
| 5355 E Parkway #131 | 0.14mi | 1/1.0 (-1) | 748 (-13%) | 23mo | $85,000 | $114 | 46 |
Match score weights: distance 35% · size 25% · config 20% · recency 20%. Top-matched comps best support the ARV.
Projected returns pro-forma
10.0% appreciation · 3.0% rent growth · sell at horizon
- IRR
- —
- Equity multiple
- 8.37×
- Total profit
- $330,038
- Equity at exit
- $144,051
- IRR
- —
- Equity multiple
- 18.46×
- Total profit
- $781,526
- Equity at exit
- $310,651
Cash invested: $44,772 (down + closing). Projections, not guarantees.
Landlord ↔ Tenant lean methodology
- Overall (STATE)
- 87 Strongly Landlord-Friendly
- State Tennessee
- 87 Strongly Landlord-Friendly · R+13
- County
- — inherits STATE
- City
- — inherits STATE
ZIP-level market 37722
- Home prices YoY
- 27.9%
- Active inventory
- 168
- Price-to-rent
- 2.0×
Monthly cashflow live
- Estimated rent
- $6,520 medium interval (Pro) →
- Mortgage (P&I)
- −$839
- Tax est. 1.5%
- −$200 /mo · $2,398/yr
- Insurance
- −$67
- HOA
- −$235
- Vacancy / Maint / Mgmt
- −$1,369
- Net cashflow
- $3,811
Break-even live
UW: 25.0% down · 7.5% · 30yr · 1.5% tax · 5.0% vac · 8.0% maint · 8.0% mgmt
Financing live
Cash to close
- Down payment
- $39,975
- Closing costs
- $4,797
- Reserves months
- —
- Total cash needed
- —
Loan-product check · same deal, 3 products live
Conventional
25% down · 7.5% · 30yr
- Down + closing
- —
- Monthly P&I
- —
- Monthly cashflow
- —
- DSCR
- —
- Eligible?
- —
Personal DTI + credit; lowest rate.
DSCR
20% down · 8.5% · 30yr
- Down + closing
- —
- Monthly P&I
- —
- Monthly cashflow
- —
- DSCR
- —
- Eligible?
- —
No personal income docs; deal must DSCR.
Hard money
10% down · 12.0% · 12mo
- Down + closing
- —
- Monthly P&I
- —
- Monthly cashflow
- —
- DSCR
- —
- Eligible?
- —
Short-term bridge; refi at stabilization.
Rent comps 1 comps
| Address | Beds | Baths | Sqft | Rent | $/sqft | DOM | Units | Dist |
|---|---|---|---|---|---|---|---|---|
| 4949 Ledford Rd Unit 1051743P Cosby, TN | 1.0 | 1.0 | 667 | $6,520 | $9.78 | 13d | 1 | 0.96mi |
HOA detail
- Monthly dues
- $235 · $2,820/yr
- Likely covers
- waterelectric
Listing history 16 events
-
2026-06-19days on market $159,900 Active 24 DOM
-
2026-06-18days on market $159,900 Active 23 DOM
-
2026-06-17days on market $159,900 Active 22 DOM
-
2026-06-16days on market $159,900 Active 21 DOM
-
2026-06-15days on market $159,900 Active 20 DOM
-
2026-06-14days on market $159,900 Active 18 DOM
-
2026-06-13days on market $159,900 Active 17 DOM
-
2026-06-10days on market $159,900 Active 15 DOM
-
2026-06-09days on market $159,900 Active 14 DOM
-
2026-06-08days on market $159,900 Active 13 DOM
-
2026-06-07days on market $159,900 Active 12 DOM
-
2026-06-02days on market $159,900 Active 7 DOM
-
2026-06-01days on market $159,900 Active 6 DOM
-
2026-05-31days on market $159,900 Active 5 DOM
-
2026-05-30days on market $159,900 Active 4 DOM
-
2026-05-23$159,900 Active
ⓘ Source: listings_history table (triggers on properties + properties_extension) + one-shot
backfill from property_details.listing_events for pre-trigger history.
Climate risk First Street
- Flood 1/10 Low FEMA zone X (unshaded) · 0% chance over 30 yrs
- Wildfire 4/10 Moderate
- Heat 4/10 Moderate 9 d/yr ≥85°F today · 25 d/yr by 30 yrs out
- Wind 2/10 Low
- Air quality 2/10 Low 1 unhealthy d/yr today · 2 by 30 yrs out
Nearby sold comps map
Loading sold comps map…
Walkable amenities ~0.75 mi
Loading nearby amenities…
Taxation est. · year 1
- Rental income
- $78,240
- − Mortgage interest
- −$8,957
- − Property taxes
- −$2,398
- − Insurance
- −$800
- − Repairs & maintenance
- −$6,259
- − Management
- −$6,259
- − HOA
- −$2,820
- − Depreciation
- −$4,652
- Taxable income
- $46,095
- Est. tax owed @ 24.0%
- −$11,063
- After-tax cash flow
- $34,666/yr
For passive investors: Depreciation is non-cash, so a rental often shows a tax loss while cash-flowing — sheltering income. Rental losses are passive: they offset passive income freely, and up to $25,000/yr can offset ordinary (W-2) income if you actively participate and your MAGI is under $100k (phasing out to $0 by $150k); unused losses carry forward. On sale, claimed depreciation is recaptured at up to 25%, and gains may owe capital-gains tax (a 1031 exchange can defer both). Figures are a year-1 estimate at your 24.0% rate — not tax advice; consult a CPA.
Condition & rehab AI · 30 photos
This move-in-ready manufactured home is in good condition with a good condition score of 75. It has a good exterior, interior, and HVAC system. The home has a good curb appeal and is ready for a new owner or renter.
Value-add opportunities
- Both Paint the exterior siding — A fresh coat of paint can enhance the home's curb appeal and increase its value.
- Both Replace the front door — A new front door can improve the home's curb appeal and increase its value.
- Rental Clean the air filters — Clean air filters can improve the HVAC system's efficiency and reduce energy costs, making it more attractive to renters.
Renovation cost estimate screening
Value-add ROI direction
- Both Paint the exterior siding — A fresh coat of paint can enhance the home's curb appeal and increase its value. ↑
- Both Replace the front door — A new front door can improve the home's curb appeal and increase its value. ↑
- Rental Clean the air filters — Clean air filters can improve the HVAC system's efficiency and reduce energy costs, making it more attractive to renters. ↑
ⓘ Cost ranges are severity-bucket heuristics (US national rule-of-thumb). Get contractor quotes + a written scope before underwriting a rehab budget.
Schools (NCES district)
- District
- Sevier County
- NCES district ID
- 4703780
- Math proficiency
- 31% ▼ -6.00%
- Reading proficiency
- 28% ▼ -4.00%
- Median HH income
- $42,730
- Composite
- 25.12/100
- National rank
- #7527
- State rank
- #62 of 139 in TN
Livability — Cosby
No livability data for this city. (Only ~50 U.S. cities are tracked.)
Census & demographics
- Population (ZIP)
- 7,430
Population outlook (Sevier County) Hauer SSP2
- Today (2025)
- 107,903 people
- By 2030
- 113,633 · +5.3%
- By 2040
- 123,969 · +14.9%
- By 2050
- 132,123 · +22.4%
- By 2075
- 148,524 · +37.6%
- By 2100
- 153,436 · +42.2%
Race, ethnicity, and origin ACS 2023
- Neighborhood character
- Predominantly White (91%)
- Race & ethnicity
- White 91% Hispanic / Latino 6% Two or more races 4% Native American 2%
- Hispanic origin (detail)
- Puerto Rican 1% Cuban 1%
- Common ancestry
- Slovak 5% Romanian 1% Iranian 1%
- Foreign-born
- 4% · Canada, Guatemala, China
- Languages at home
- 95% English-only · Spanish 4%
Political lean MEDSL · Sevier
- 2024 margin
- Solid R (+61.1) · D 18.9% · R 80.1% · Other 1.0%
- 2008→2024 swing
- -13.1pp toward R · 2008: -48.1pp · 2024: -61.1pp
- All cycles
- 2024: R+61.1 2020: R+57.6 2016: R+61.7 2012: R+54.8 2008: R+48.1
Not yet ingested
- Civics
- —
Market trends
- HPI YoY
- ▲ 85.12%
- Current HPI
- 390.2959
- Rent YoY
- —
- Metro
- —
- State GDP YoY
- ▲ 2.78%
- F500 in state
- 22
Industry mix (Fortune 500 HQ in TN)
| Industry | F500 HQs | Revenue |
|---|---|---|
| Healthcare | 3 | $91B |
|
||
| Retail | 3 | $72B |
|
||
| Transportation / Logistics | 1 | $88B |
|
||
| Paper / Packaging | 1 | $19B |
|
||
| Insurance | 1 | $13B |
|
||
| Energy | 1 | $12B |
|
||
Price history
1 event — show timeline
- 2026-05-23 Listed $159,900 GSMAR
Cash-flow waterfall
monthlySold comps — $/sqft
last 12 mo · ≤1 miLoading sold comps…