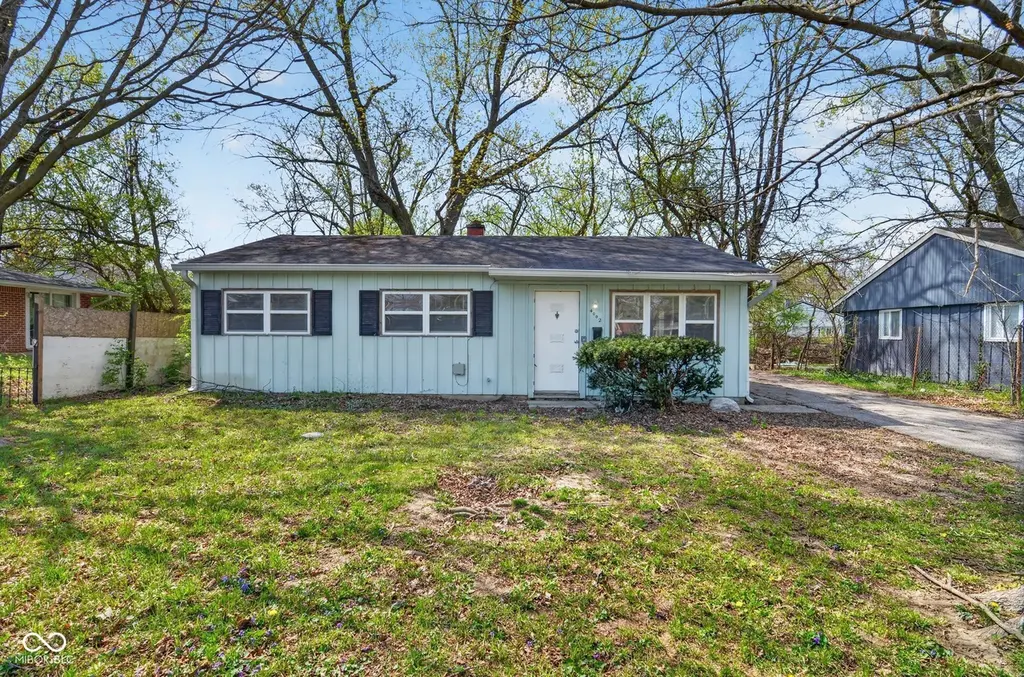
4002 N Mitthoefer Rd · Indianapolis city (balance), IN
Flood risk 1/10 · Minimal
- FEMA flood zone
- X (unshaded)
- Chance of flooding over 30 yrs
- 0.0%
- Est. flood insurance / yr
- $507 – $1,088
Fire risk 1/10 · Minimal
- Est. fire insurance / yr
- $717 – $1,331
Heat risk 3/10 · Minor
- Hot days now (above 101°F)
- 7 days/yr
- Hot days in 30 yrs
- 18 days/yr
Wind risk 2/10 · Minimal
- Chance of severe wind over 30 yrs
- 0.0%
Air-quality risk 3/10 · Minor
- Unhealthy air days now
- 3 days/yr
- Unhealthy air days in 30 yrs
- 4 days/yr
Risk factors via First Street. Map © Google.
Why this score? — see what drove the B- grade
The composite is a weighted blend of 9 inputs, each scored 0–100. Each bar is that input's sub-score; the figure is the points it added to the 100-point composite (weight × sub-score).
- Cash flow +26.4/30.0
- ARV discount +15.0/15.0
- DSCR +9.0/10.0
- 1% rule +7.3/10.0
- Rent growth +3.1/5.0
- Livability +2.5/5.0
- Condition / age +2.5/5.0
- Schools +1.4/10.0
- Appreciation +0.0/10.0
$124,900
🖨 Deal sheet 📄 Offer letter ✓ Due diligence
Listing remarks MLS
Welcome to this lovely move in ready ranch home nestled in the established Glicks East 38th Street Addition. Perfectly sized for first-time homebuyers or savvy investors, this 3-bedroom, 1-bathroom home offers a functional layout and a low-maintenance lifestyle. Inside, you'll find a cozy living area that flows naturally into the eat-in kitchen, providing a central hub for daily living. The home is equipped with central air and a forced-air heating system for year-round comfort. Situated on a generous 7,100+ square foot lot, the property features a large, level backyard that is fully fenced-ideal for outdoor gatherings, gardening, or pets. An additional storage shed provides plenty of space for tools and equipment.
Key facts
- Eat in kitchen
- Cozy living area
- Functional layout
Tags
Neighborhood map
What this means for you Summary
Snapshot
- This is a 3-bed/1.0-bath single-family listed at $125k.
Deal economics
- At list price, monthly cash flow is $328 ($4k/yr) — positive.
- The deal already cash-flows at list — no discount required.
- Meets the 1% rule at list price ($2k rent vs $125k).
- Recommended offer: $117k (6.0% below list) — sets the bar for market timing.
- Cap rate 9.4% vs local median 4.4% in Indianapolis city (balance) — top-decile yield for the area; either an underpriced asset or a hidden risk that comps aren't pricing in. Stress-test before assuming the spread holds.
Location & tenants
- Location reads: area grade B — affects rentability + tenant quality, not the cash-flow math above.
- Indianapolis Public Schools (urban): math 14% / reading 20% proficiency, ranked #286 of 301 in IN (top 95%) — low school quality limits family demand, transient renter base, plan for 1-2y turnover; 77% free/reduced lunch — lower-income household profile, screen leases tightly.
- Market conditions: Rents rising (+2.6%/yr); 54 active listings in the ZIP; 15 comparable units currently listed for rent nearby; rentals at typical pace (median 24d on market — plan ~3-4 weeks tenant-placement turnaround); 1,906 units permitted in Marion County in 2024 (621 in 5+ unit buildings).
- This rent runs 31% of the median local income ($59k/yr) — at the standard rent-burdened threshold; future hikes will face affordability resistance.
Forward outlook
- Local home prices are declining (-3.0%/yr); year-one equity from $864 of loan paydown is wiped out by about $4k of value loss. Plan a longer hold.
- Marion County population projected at +18% by 2050 — long-run rental-demand tailwind backs the buy-and-hold thesis.
Negotiation context
- It's been on market 63 days — a 6% lower offer ($117k) is reasonable based on typical stale-listing flexibility.
- 8 sale attempts since 14y ago; this cycle's ask has dropped $10k (7%) from the opening price — seller is motivated, your offer sets the floor, not the list.
- Current owner paid $80k; list at $125k implies a 57% gain — meaningful room to come down on a strong offer.
Questions for the listing agent
- It's been on market 63 days. Have you received any prior offers? Is the seller open to a 6% concession, seller financing, or rate buy-down credit?
- Built in 1963 — when were the roof, HVAC, electrical panel, plumbing, and water heater last replaced?
- Why hasn't it sold? Are there any deal-killer items the seller is aware of (foundation, flood, title, zoning, code violations)?
- Is there a deadline driving the sale (1031 exchange, divorce, estate, relocation)? That informs how much negotiation room exists.
- What's the average days-on-market for RENTAL listings here right now (not sales)? A rising rental-DOM trend means longer vacancies and softer asking-rent achievability than the comps imply.
- What's the recent tenant-quality profile in this submarket — average credit score on applications, eviction rate, late-payment / NSF rate, and stable-employment percentage? A property-management company in the area should have these aggregated.
- How much new for-sale + rental construction is in the pipeline within 1–3 miles? Heavy new supply typically softens prices + rents 12–24 months out; constrained supply supports both.
Investment metrics
- 1% rule
- 1.23% ✓
- Cap rate
- 9.44%
- Cash-on-cash
- 11.24%
- DSCR
- 1.50
- GRM
- 6.8
CMA / ARV
- ARV (median comp)
- $151,508
- List price
- $124,900
- Delta
- -17.56%
- Verdict
- UNDERPRICED
- Comps
- 20 within 1.0 mi
Show comp detail 12 sales within ~0.75 mi
| Address | Dist | Beds/Ba | Sqft | Sold | Price | $/sf | Match |
|---|---|---|---|---|---|---|---|
| 3943 N Mitthoefer Rd | 0.08mi | 3/1.0 | 936 (+1%) | 6mo | $149,900 | $160 | 90 |
| 3944 Strathmore Dr | 0.23mi | 3/1.0 | 925 (0%) | 12mo | $162,900 | $176 | 80 |
| 3901 Della Ct | 0.19mi | 3/1.5 | 925 (0%) | 15mo | $150,000 | $162 | 77 |
| 9707 E 39th St | 0.39mi | 3/1.0 | 925 (0%) | 7mo | $103,000 | $111 | 76 |
| 9920 Catalina Dr | 0.27mi | 3/1.0 | 925 (0%) | 15mo | $145,000 | $157 | 74 |
| 4101 Baker Dr | 0.41mi | 3/1.0 | 900 (-3%) | 4mo | $122,000 | $136 | 73 |
| 3920 Strathmore Dr | 0.25mi | 3/1.0 | 925 (0%) | 20mo | $125,000 | $135 | 72 |
| 3926 Downes Dr | 0.30mi | 3/2.0 | 925 (0%) | 15mo | $140,000 | $151 | 70 |
| 9526 Burrwood Ct | 0.58mi | 3/1.0 | 925 (0%) | 10mo | $185,000 | $200 | 65 |
| 9420 Conried Dr | 0.56mi | 3/1.0 | 900 (-3%) | 6mo | $119,000 | $132 | 64 |
| 9513 E 39th Pl | 0.48mi | 3/1.5 | 925 (0%) | 15mo | $160,000 | $173 | 63 |
| 3640 Newgate Ln | 0.59mi | 2/1.5 (-1) | 1,048 (+13%) | 20mo | $89,500 | $85 | 26 |
Match score weights: distance 35% · size 25% · config 20% · recency 20%. Top-matched comps best support the ARV.
Projected returns pro-forma
-3.0% appreciation · 2.56% rent growth · sell at horizon
- IRR
- -0.0%
- Equity multiple
- 1.00×
- Total profit
- $-10
- Equity at exit
- $18,623
- IRR
- 9.2%
- Equity multiple
- 1.69×
- Total profit
- $24,261
- Equity at exit
- $10,799
Cash invested: $34,972 (down + closing). Projections, not guarantees.
Landlord ↔ Tenant lean methodology
- Overall (STATE)
- 90 Strongly Landlord-Friendly
- State Indiana
- 90 Strongly Landlord-Friendly · R+11
- County
- — inherits STATE
- City
- — inherits STATE
ZIP-level market 46235
- Home prices YoY
- -4.3%
- Rents YoY
- 2.6%
- Active inventory
- 54
- Price-to-rent
- 6.8×
Monthly cashflow live
- Estimated rent
- $1,541 high interval (Pro) →
- Mortgage (P&I)
- −$655
- Tax from tax record
- −$183 /mo · $2,191/yr
- Insurance
- −$52
- HOA
- −$0
- Vacancy / Maint / Mgmt
- −$324
- Net cashflow
- $328
Break-even live
UW: 25.0% down · 7.5% · 30yr · 1.5% tax · 5.0% vac · 8.0% maint · 8.0% mgmt
Financing live
Cash to close
- Down payment
- $31,225
- Closing costs
- $3,747
- Reserves months
- —
- Total cash needed
- —
Loan-product check · same deal, 3 products live
Conventional
25% down · 7.5% · 30yr
- Down + closing
- —
- Monthly P&I
- —
- Monthly cashflow
- —
- DSCR
- —
- Eligible?
- —
Personal DTI + credit; lowest rate.
DSCR
20% down · 8.5% · 30yr
- Down + closing
- —
- Monthly P&I
- —
- Monthly cashflow
- —
- DSCR
- —
- Eligible?
- —
No personal income docs; deal must DSCR.
Hard money
10% down · 12.0% · 12mo
- Down + closing
- —
- Monthly P&I
- —
- Monthly cashflow
- —
- DSCR
- —
- Eligible?
- —
Short-term bridge; refi at stabilization.
Rent comps 15 comps
| Address | Beds | Baths | Sqft | Rent | $/sqft | DOM | Units | Dist |
|---|---|---|---|---|---|---|---|---|
| 10101 Montery Rd Indianapolis, IN | 2.0 | 1.0 | 627 | $1,439 | $2.30 | 2d | 10 | 0.15mi |
| 3962 Strathmore Dr Indianapolis, IN | 3.0 | 1.0 | 925 | $1,250 | $1.35 | 24d | 1 | 0.19mi |
| 9438 Conried Dr Indianapolis, IN | 3.0 | 1.0 | 1094 | $1,445 | $1.32 | 4d | 1 | 0.50mi |
| 3645 Wingate Ct Indianapolis, IN | 3.0 | 1.0–2.0 | 774 | $1,500 | $1.94 | 24d | 6 | 0.65mi |
| 9060 E 39th Pl Indianapolis, IN | 1.0–2.0 | 1.0–1.5 | 820 | $1,040 | $1.27 | 24d | 1 | 0.83mi |
| 3519 Jerome Ct Indianapolis, IN | 4.0 | 1.0 | 1107 | $1,995 | $1.80 | 24d | 1 | 0.85mi |
| 3525 Luewan Ct Indianapolis, IN | 4.0 | 1.0 | 1107 | $1,750 | $1.58 | 24d | 1 | 0.89mi |
| 9226 E 36th Pl Indianapolis, IN | 3.0 | 1.0 | 1073 | $1,250 | $1.16 | 7d | 1 | 0.90mi |
| 3665 Coneflower Way Indianapolis, IN | 3.0 | 2.0 | 1030 | $1,375 | $1.33 | 44d | 1 | 1.02mi |
| 8862 Bel Air Ct Indianapolis, IN | 3.0 | 1.0 | 1073 | $1,264 | $1.18 | 18d | 1 | 1.07mi |
| 3938 Biscayne Rd Indianapolis, IN | 3.0 | 1.0 | 1000 | $1,895 | $1.90 | 3d | 1 | 1.16mi |
| 8724 Montery Rd Indianapolis, IN | 3.0 | 1.0 | 925 | $1,500 | $1.62 | 44d | 1 | 1.18mi |
| 3809 Biscayne Rd Indianapolis, IN | 2.0 | 1.5 | 992 | $1,020 | $1.03 | 15d | 1 | 1.18mi |
| 3631 Decamp Dr Indianapolis, IN | 3.0 | 1.0 | 1000 | $1,335 | $1.33 | 24d | 1 | 1.21mi |
| 4315 Aspen Way Indianapolis, IN | 3.0 | 1.0 | 1080 | $1,380 | $1.28 | 44d | 1 | 1.49mi |
Listing history 32 events
-
2026-06-18days on market $124,900 Active 63 DOM
-
2026-06-17days on market $124,900 Active 62 DOM
-
2026-06-16days on market $124,900 Active 61 DOM
-
2026-06-15days on market $124,900 Active 60 DOM
-
2026-06-13days on market $124,900 Active 58 DOM
-
2026-06-13days on market $124,900 Active 57 DOM
-
2026-06-09days on market $124,900 Active 54 DOM
-
2026-06-08days on market $124,900 Active 53 DOM
-
2026-06-07days on market $124,900 Active 52 DOM
-
2026-06-03days on market $124,900 Active 48 DOM
-
2026-06-02days on market $124,900 Active 47 DOM
-
2026-06-01days on market $124,900 Active 46 DOM
-
2026-05-31price $124,900 Active 45 DOM
-
2026-05-31days on market $129,900 Active 45 DOM
-
2026-05-15price $129,900 727-char remark
Show marketing remark (727 chars)
Welcome to this lovely move in ready ranch home nestled in the established Glicks East 38th Street Addition. Perfectly sized for first-time homebuyers or savvy investors, this 3-bedroom, 1-bathroom home offers a functional layout and a low-maintenance lifestyle. Inside, you'll find a cozy living area that flows naturally into the eat-in kitchen, providing a central hub for daily living. The home is equipped with central air and a forced-air heating system for year-round comfort. Situated on a generous 7,100+ square foot lot, the property features a large, level backyard that is fully fenced-ideal for outdoor gatherings, gardening, or pets. An additional storage shed provides plenty of space for tools and equipment.
-
2026-04-16$134,900 Active 727-char remark
Show marketing remark (727 chars)
Welcome to this lovely move in ready ranch home nestled in the established Glicks East 38th Street Addition. Perfectly sized for first-time homebuyers or savvy investors, this 3-bedroom, 1-bathroom home offers a functional layout and a low-maintenance lifestyle. Inside, you'll find a cozy living area that flows naturally into the eat-in kitchen, providing a central hub for daily living. The home is equipped with central air and a forced-air heating system for year-round comfort. Situated on a generous 7,100+ square foot lot, the property features a large, level backyard that is fully fenced-ideal for outdoor gatherings, gardening, or pets. An additional storage shed provides plenty of space for tools and equipment.
-
2021-09-07soldstatus $79,500 Closed 211-char remark
Show marketing remark (211 chars)
CALLING ALL INVESTORS!! Long term tenant occupied. Tenant rights apply, please do not disturb tenants. Serious interest only for showings please. Property is being sold in AS IS condition. No repairs to be made.
-
2021-08-15status Pending 211-char remark
Show marketing remark (211 chars)
CALLING ALL INVESTORS!! Long term tenant occupied. Tenant rights apply, please do not disturb tenants. Serious interest only for showings please. Property is being sold in AS IS condition. No repairs to be made.
-
2021-08-06status Active 211-char remark
Show marketing remark (211 chars)
CALLING ALL INVESTORS!! Long term tenant occupied. Tenant rights apply, please do not disturb tenants. Serious interest only for showings please. Property is being sold in AS IS condition. No repairs to be made.
-
2021-08-05historical 211-char remark
Show marketing remark (211 chars)
CALLING ALL INVESTORS!! Long term tenant occupied. Tenant rights apply, please do not disturb tenants. Serious interest only for showings please. Property is being sold in AS IS condition. No repairs to be made.
-
2021-08-04status Active 211-char remark
Show marketing remark (211 chars)
CALLING ALL INVESTORS!! Long term tenant occupied. Tenant rights apply, please do not disturb tenants. Serious interest only for showings please. Property is being sold in AS IS condition. No repairs to be made.
-
2021-07-27historical 211-char remark
Show marketing remark (211 chars)
CALLING ALL INVESTORS!! Long term tenant occupied. Tenant rights apply, please do not disturb tenants. Serious interest only for showings please. Property is being sold in AS IS condition. No repairs to be made.
-
2021-07-25status Active 211-char remark
Show marketing remark (211 chars)
CALLING ALL INVESTORS!! Long term tenant occupied. Tenant rights apply, please do not disturb tenants. Serious interest only for showings please. Property is being sold in AS IS condition. No repairs to be made.
-
2021-07-11historical 211-char remark
Show marketing remark (211 chars)
CALLING ALL INVESTORS!! Long term tenant occupied. Tenant rights apply, please do not disturb tenants. Serious interest only for showings please. Property is being sold in AS IS condition. No repairs to be made.
-
2021-07-01$85,000 Active 211-char remark
Show marketing remark (211 chars)
CALLING ALL INVESTORS!! Long term tenant occupied. Tenant rights apply, please do not disturb tenants. Serious interest only for showings please. Property is being sold in AS IS condition. No repairs to be made.
-
2018-03-01$35,000 Active
-
2018-03-01$35,000 Active
-
2018-03-01historical
-
2018-02-28soldstatus $35,000 Sold
-
2013-04-29historical
-
2013-04-24soldstatus $14,576
-
2012-01-11$17,000
ⓘ Source: listings_history table (triggers on properties + properties_extension) + one-shot
backfill from property_details.listing_events for pre-trigger history.
Tax reassessment forecast IN · Partial reset (capped growth)
- Current annual tax
- $2,191 · $183/mo
- Projected year-2 tax
- $2,191 · $183/mo
- Expected delta
- $0/yr ($0/mo · 0.0%)
ⓘ Screening estimate from a state-policy table — verify with the county assessor before closing.
Climate risk First Street
- Flood 1/10 Low FEMA zone X (unshaded) · 0% chance over 30 yrs
- Wildfire 1/10 Low
- Heat 3/10 Moderate 7 d/yr ≥101°F today · 18 d/yr by 30 yrs out
- Wind 2/10 Low 0% chance of damaging wind over 30 yrs
- Air quality 3/10 Moderate 3 unhealthy d/yr today · 4 by 30 yrs out
Nearby sold comps map
Loading sold comps map…
Walkable amenities ~0.75 mi
Loading nearby amenities…
Taxation est. · year 1
- Rental income
- $18,490
- − Mortgage interest
- −$6,996
- − Property taxes
- −$2,191
- − Insurance
- −$624
- − Repairs & maintenance
- −$1,479
- − Management
- −$1,479
- − Depreciation
- −$3,633
- Taxable income
- $2,086
- Est. tax owed @ 24.0%
- −$501
- After-tax cash flow
- $3,431/yr
For passive investors: Depreciation is non-cash, so a rental often shows a tax loss while cash-flowing — sheltering income. Rental losses are passive: they offset passive income freely, and up to $25,000/yr can offset ordinary (W-2) income if you actively participate and your MAGI is under $100k (phasing out to $0 by $150k); unused losses carry forward. On sale, claimed depreciation is recaptured at up to 25%, and gains may owe capital-gains tax (a 1031 exchange can defer both). Figures are a year-1 estimate at your 24.0% rate — not tax advice; consult a CPA.
Schools (NCES district)
- District
- Indianapolis Public Schools
- NCES district ID
- 1804770
- Math proficiency
- 14% ▼ -7.00%
- Reading proficiency
- 20% ▼ -3.00%
- Median HH income
- $32,034
- Composite
- 13.69/100
- National rank
- #9499
- State rank
- #286 of 301 in IN
Livability — Indianapolis city (balance)
No livability data for this city. (Only ~50 U.S. cities are tracked.)
Census & demographics
- Census place
- Indianapolis city (balance), IN
- County
- Marion County · 998,460 people
- City population
- 881,119
- Metro
- Indianapolis-Carmel-Anderson, IN
- Population (ZIP)
- 36,317
- Household income
- $58,951
- Rent vs Own
- Severe rent burden
- 1901.0
Population outlook (Marion County) Hauer SSP2
- Today (2025)
- 1,025,572 people
- By 2030
- 1,065,727 · +3.9%
- By 2040
- 1,141,577 · +11.3%
- By 2050
- 1,208,920 · +17.9%
- By 2075
- 1,367,288 · +33.3%
- By 2100
- 1,438,201 · +40.2%
Race, ethnicity, and origin ACS 2023
- Neighborhood character
- Diverse neighborhood (Simpson 0.62)
- Race & ethnicity
- Black 57% White 18% Hispanic / Latino 17% Two or more races 11%
- Hispanic origin (detail)
- Mexican 11% Puerto Rican 2%
- Common ancestry
- Hispanic 3% Slovak 1% Romanian 1%
- Foreign-born
- 11% · Canada
- Languages at home
- 80% English-only · Spanish 15% French/Haitian/Cajun 4%
Political lean MEDSL · Marion
- 2024 margin
- Strong D (+27.7) · D 63.0% · R 35.3% · Other 1.7%
- 2008→2024 swing
- -0.7pp no change · 2008: 28.4pp · 2024: 27.7pp
- All cycles
- 2024: D+27.7 2020: D+29.1 2016: D+22.8 2012: D+22.2 2008: D+28.4
Not yet ingested
- Civics
- —
Market trends
- HPI YoY
- ▼ -12.41%
- Current HPI
- 275.1505
- Rent YoY
- ▲ 2.56%
- Metro
- Indianapolis-Carmel-Anderson, IN
- State GDP YoY
- ▲ 2.90%
- F500 in state
- 18
Industry mix (Fortune 500 HQ in IN)
| Industry | F500 HQs | Revenue |
|---|---|---|
| Industrial Machinery | 2 | $37B |
|
||
| Healthcare | 1 | $177B |
|
||
| Pharmaceuticals | 1 | $45B |
|
||
| Metals / Steel | 1 | $18B |
|
||
| Agriculture | 1 | $17B |
|
||
| Packaging | 1 | $12B |
|
||
Price history
+664.1% since first listed18 events — show timeline
- 2026-05-15 Price Changed $129,900 MIBOR as Distributed by MLS Grid
- 2026-04-16 Listed $134,900 MIBOR as Distributed by MLS Grid
- 2021-09-07 Sold (MLS) $79,500 MIBOR as Distributed by MLS Grid
- 2021-08-15 Pending — MIBOR as Distributed by MLS Grid
- 2021-08-06 Relisted — MIBOR as Distributed by MLS Grid
- 2021-08-05 Listing Removed — MIBOR as Distributed by MLS Grid
- 2021-08-04 Relisted — MIBOR as Distributed by MLS Grid
- 2021-07-27 Listing Removed — MIBOR as Distributed by MLS Grid
- 2021-07-25 Relisted — MIBOR as Distributed by MLS Grid
- 2021-07-11 Listing Removed — MIBOR as Distributed by MLS Grid
- 2021-07-01 Listed $85,000 MIBOR as Distributed by MLS Grid
- 2018-03-01 Listed $35,000 MIBOR as Distributed by MLS Grid
- 2018-03-01 Listed $35,000 MIBOR as Distributed by MLS Grid
- 2018-03-01 Listing Removed — MIBOR as Distributed by MLS Grid
- 2018-02-28 Sold (MLS) $35,000 MIBOR as Distributed by MLS Grid
- 2013-04-29 Listing Removed — MIBOR as Distributed by MLS Grid
- 2013-04-24 Sold (MLS) $14,576 MIBOR as Distributed by MLS Grid
- 2012-01-11 Listed $17,000 MIBOR as Distributed by MLS Grid
Property tax history
+7.1%/yrLatest (2025): $2,191 · -2.6% YoY. Source: county tax records.
Cash-flow waterfall
monthlySold comps — $/sqft
last 12 mo · ≤1 miLoading sold comps…