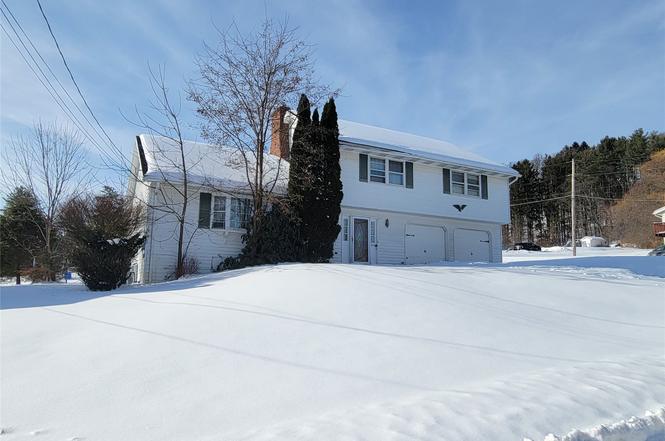
1033 Holly Ln · Endwell, NY
Flood risk 1/10 · Minimal
- FEMA flood zone
- X
- Chance of flooding over 30 yrs
- 0.0%
- Est. flood insurance / yr
- $473 – $860
Fire risk 2/10 · Minimal
- Est. fire insurance / yr
- $691 – $1,283
Heat risk 3/10 · Minor
- Hot days now (above 94°F)
- 7 days/yr
- Hot days in 30 yrs
- 16 days/yr
Wind risk 2/10 · Minimal
- Chance of severe wind over 30 yrs
- 1.0%
Air-quality risk 2/10 · Minimal
- Unhealthy air days now
- 0 days/yr
- Unhealthy air days in 30 yrs
- 1 days/yr
Risk factors via First Street. Map © Google.
Why this score? — see what drove the C grade
The composite is a weighted blend of 9 inputs, each scored 0–100. Each bar is that input's sub-score; the figure is the points it added to the 100-point composite (weight × sub-score).
- Cash flow +16.5/30.0
- ARV discount +15.0/15.0
- 1% rule +6.9/10.0
- DSCR +5.1/10.0
- Rent growth +4.3/5.0
- Schools +4.3/10.0
- Livability +3.7/5.0
- Condition / age +2.5/5.0
- Appreciation +0.0/10.0
$169,900
🖨 Deal sheet (PDF) 📄 Offer letter ✓ Due diligence
Listing remarks
Opportunity awaits with this 4-bedroom, 2-bath home situated on a beautiful corner lot with a fully fenced yard. The spacious lot offers excellent curb appeal potential and room for outdoor entertaining, gardening, or play areas. Its prime location adds to the property’s overall appeal and long-term value. This home is ready for renovation and is best suited for cash buyers or those utilizing a rehab loan. With thoughtful updates and improvements, this property could be transformed into a stunning residence or profitable investment. Whether you're an experienced investor, contractor, or buyer looking to customize a home from the ground up, this is a chance to create equity and maximiz
Key facts
- Outdoor entertaining
- Play areas
- Fully fenced yard
Tags
Neighborhood map
What this means for you Summary
Snapshot
- This is a 4-bed/2.0-bath single-family listed at $170k.
Deal economics
- At list price, monthly cash flow is $100 ($1k/yr) — positive.
- The deal already cash-flows at list — no discount required.
- Meets the 1% rule at list price ($2k rent vs $170k).
- Cap rate 7.0% vs local median 4.0% in Endwell — top-decile yield for the area; either an underpriced asset or a hidden risk that comps aren't pricing in. Stress-test before assuming the spread holds.
Location & tenants
- Location reads 73/100 on livability (#303 in NY, #4,992 nationally) — a middle-class / working-renter tenant base. Strengths: housing A+, health & safety A+, cost of living A; Watch: crime D-, amenities F, commute F.
- Union-Endicott Central School District (suburban): math 43% / reading 57% proficiency, ranked #387 of 590 in NY (top 66%) — acceptable for families but not a draw, mixed tenant base, ~2y average lease.
- Zoned schools: George F Johnson Elementary School (math 35% / reading 47%, grade F, #1,410 of 2,108 statewide, top 67%, 596 students, 44% FRL); Jennie F Snapp Middle School (math 31% / reading 51%, grade F, #402 of 729 statewide, top 56%, 822 students, 65% FRL); Union-Endicott High School (math 91% / reading 90%, grade A+, #231 of 1,100 statewide, top 21%, 999 students, 41% FRL).
- Market conditions: Rents rising fast (+7.1%/yr); 217 active listings in the ZIP; 2 comparable units currently listed for rent nearby; 340 units permitted in Broome County in 2024 (269 in 5+ unit buildings).
- This rent runs 37% of the median local income ($66k/yr) — at the standard rent-burdened threshold; future hikes will face affordability resistance.
Forward outlook
- Local home prices are declining (-3.0%/yr); year-one equity from $1k of loan paydown is wiped out by about $5k of value loss. Plan a longer hold.
- Broome County population projected at -13% by 2050 — secular population decline; favor cash flow + early exit over multi-decade hold.
- At projected returns (-3.0% appreciation + 7.1% rent growth), your $48k cash investment doubles in ~10 years — after that, you're playing with house money.
Negotiation context
- Only 2 days on market — expect competitive offers; lowballing is unlikely to land.
Risks & watch-outs
- Watch-outs: property tax is 3.8% of price.
Questions for the listing agent
- Built in 1970 — when were the roof, HVAC, electrical panel, plumbing, and water heater last replaced?
- Property tax is high relative to price — has the assessment been appealed recently, and will the sale trigger a re-assessment?
- Is there a deadline driving the sale (1031 exchange, divorce, estate, relocation)? That informs how much negotiation room exists.
- Schools are A-rated — typically a magnet for longer-tenancy family renters. What's the average tenant stay here, and is there a school-zone premium baked into asking?
- Crime grade is D in this area — have there been break-ins, vandalism, or insurance claims at this property in the last 3 years? What carrier currently insures it and at what premium?
- What's the average days-on-market for RENTAL listings here right now (not sales)? A rising rental-DOM trend means longer vacancies and softer asking-rent achievability than the comps imply.
- What's the recent tenant-quality profile in this submarket — average credit score on applications, eviction rate, late-payment / NSF rate, and stable-employment percentage? A property-management company in the area should have these aggregated.
- How much new for-sale + rental construction is in the pipeline within 1–3 miles? Heavy new supply typically softens prices + rents 12–24 months out; constrained supply supports both.
Investment metrics
- 1% rule
- 1.19% ✓
- Cap rate
- 7.00%
- Cash-on-cash
- 2.52%
- DSCR
- 1.11
- GRM
- 7.0
CMA / ARV
- ARV (on-the-fly)
- $245,674
- Comps found
- 12
Show comp detail 12 sales within ~0.75 mi
| Address | Dist | Beds/Ba | Sqft | Sold | Price | $/sf | Match |
|---|---|---|---|---|---|---|---|
| 2715 Manhattan Dr | 0.28mi | 3/2.0 (-1) | 1,766 (+3%) | 11mo | $265,000 | $150 | 68 |
| 1037 Elmwood Dr | 0.28mi | 3/2.0 (-1) | 1,848 (+8%) | 4mo | $240,000 | $130 | 66 |
| 2944 Northwood Dr | 0.33mi | 3/2.0 (-1) | 1,697 (-1%) | 15mo | $213,000 | $126 | 65 |
| 1024 Edgebrook Dr | 0.37mi | 3/2.0 (-1) | 1,707 (-1%) | 18mo | $275,000 | $161 | 62 |
| 1067 Elton Dr | 0.62mi | 4/2.0 | 1,700 (-1%) | 11mo | $325,000 | $191 | 60 |
| 1117 Ivon Ave | 0.48mi | 3/3.0 (-1) | 1,688 (-2%) | 11mo | $242,000 | $143 | 57 |
| 909 Farm To Market Rd | 0.58mi | 3/2.0 (-1) | 1,823 (+6%) | 2mo | $289,000 | $159 | 56 |
| 1124 Frost Rd | 0.55mi | 3/2.0 (-1) | 1,633 (-5%) | 7mo | $204,000 | $125 | 55 |
| 1117 Elton Dr | 0.65mi | 3/2.0 (-1) | 1,600 (-7%) | 10mo | $240,000 | $150 | 45 |
| 2028 Ford Rd | 0.55mi | 3/2.0 (-1) | 1,906 (+11%) | 8mo | $256,000 | $134 | 44 |
| 2007 Bernard Blvd | 0.71mi | 4/1.5 | 1,918 (+12%) | 16mo | $231,000 | $120 | 33 |
| 927 Farm To Market Rd | 0.58mi | 3/2.0 (-1) | 1,958 (+14%) | 19mo | $260,000 | $133 | 29 |
Match score weights: distance 35% · size 25% · config 20% · recency 20%. Top-matched comps best support the ARV.
Projected returns pro-forma
-3.0% appreciation · 7.09% rent growth · sell at horizon
- IRR
- -6.6%
- Equity multiple
- 0.74×
- Total profit
- $-12,288
- Equity at exit
- $25,333
- IRR
- 8.3%
- Equity multiple
- 1.78×
- Total profit
- $37,073
- Equity at exit
- $14,690
Cash invested: $47,572 (down + closing). Projections, not guarantees.
Landlord ↔ Tenant lean methodology
- Overall (STATE)
- 15 Strongly Tenant-Friendly
- State New York
- 15 Strongly Tenant-Friendly · D+10
- County
- — inherits STATE
- City
- — inherits STATE
ZIP-level market 13760
- Home prices YoY
- -32.7%
- Rents YoY
- 7.1%
- Active inventory
- 217
- Price-to-rent
- 7.0×
Monthly cashflow live
- Estimated rent
- $2,021 medium interval (Pro) →
- Mortgage (P&I)
- −$891
- Tax from tax record
- −$535 /mo · $6,420/yr
- Insurance
- −$71
- HOA
- −$0
- Vacancy / Maint / Mgmt
- −$424
- Net cashflow
- $100
Break-even live
Sensitivity live
| Price | -10% $196 | -5% $148 | +0% $100 | +5% $52 | +10% $4 |
|---|---|---|---|---|---|
| Rent | -10% $-60 | -5% $20 | +0% $100 | +5% $180 | +10% $259 |
| Rate | -1.0pp $185 | -0.5pp $143 | base $100 | +0.5pp $56 | +1.0pp $11 |
UW: 25.0% down · 7.5% · 30yr · 1.5% tax · 5.0% vac · 8.0% maint · 8.0% mgmt
Financing live
Cash to close
- Down payment
- $42,475
- Closing costs
- $5,097
- Reserves months
- —
- Total cash needed
- —
Loan-product check · same deal, 3 products live
Conventional
25% down · 7.5% · 30yr
- Down + closing
- —
- Monthly P&I
- —
- Monthly cashflow
- —
- DSCR
- —
- Eligible?
- —
Personal DTI + credit; lowest rate.
DSCR
20% down · 8.5% · 30yr
- Down + closing
- —
- Monthly P&I
- —
- Monthly cashflow
- —
- DSCR
- —
- Eligible?
- —
No personal income docs; deal must DSCR.
Hard money
10% down · 12.0% · 12mo
- Down + closing
- —
- Monthly P&I
- —
- Monthly cashflow
- —
- DSCR
- —
- Eligible?
- —
Short-term bridge; refi at stabilization.
Rent comps 2 comps
| Address | Beds | Baths | Sqft | Rent | $/sqft | DOM | Units | Dist |
|---|---|---|---|---|---|---|---|---|
| 723 Prescott Ave Endicott, NY | 3.0 | 2.0 | 1544 | $2,200 | $1.42 | 45d | 1 | 1.38mi |
| 409 Milan Ave Endicott, NY | 5.0 | 2.0 | 2240 | $2,350 | $1.05 | 45d | 1 | 1.50mi |
Listing history 4 events
-
2026-02-12status Pending
-
2026-02-09$169,900 Active
-
2005-02-07soldstatus $165,000
-
1998-12-21soldstatus $127,000
ⓘ Source: listings_history table (triggers on properties + properties_extension) + one-shot
backfill from property_details.listing_events for pre-trigger history.
Tax reassessment forecast NY · Partial reset (capped growth)
- Current annual tax
- $6,420 · $535/mo
- Projected year-2 tax
- $6,420 · $535/mo
- Expected delta
- $0/yr ($0/mo · 0.0%)
ⓘ Screening estimate from a state-policy table — verify with the county assessor before closing.
Climate risk First Street
- Flood 1/10 Low FEMA zone X · 0% chance over 30 yrs
- Wildfire 2/10 Low
- Heat 3/10 Moderate 7 d/yr ≥94°F today · 16 d/yr by 30 yrs out
- Wind 2/10 Low 100% chance of damaging wind over 30 yrs
- Air quality 2/10 Low 0 unhealthy d/yr today · 1 by 30 yrs out
Nearby sold comps map
Loading sold comps map…
Walkable amenities ~0.75 mi
Loading nearby amenities…
Taxation est. · year 1
- Rental income
- $24,251
- − Mortgage interest
- −$9,517
- − Property taxes
- −$6,420
- − Insurance
- −$850
- − Repairs & maintenance
- −$1,940
- − Management
- −$1,940
- − Depreciation
- −$4,943
- Taxable loss
- −$1,358
- Est. tax savings @ 24.0%
- +$326
- After-tax cash flow
- $1,523/yr
For passive investors: Depreciation is non-cash, so a rental often shows a tax loss while cash-flowing — sheltering income. Rental losses are passive: they offset passive income freely, and up to $25,000/yr can offset ordinary (W-2) income if you actively participate and your MAGI is under $100k (phasing out to $0 by $150k); unused losses carry forward. On sale, claimed depreciation is recaptured at up to 25%, and gains may owe capital-gains tax (a 1031 exchange can defer both). Figures are a year-1 estimate at your 24.0% rate — not tax advice; consult a CPA.
Schools (NCES district)
- District
- Union-Endicott Central School District
- NCES district ID
- 3610710
- Math proficiency
- 43% ▼ -9.00%
- Reading proficiency
- 57% ▲ 11.00%
- Median HH income
- $49,265
- Composite
- 42.66/100
- National rank
- #3176
- State rank
- #387 of 590 in NY
Livability — Endwell
- Score
- 73/100
- State rank
- #303
- US rank
- #4992
Category grades
Schools grade is shown separately in the Schools card above.
Census & demographics
- County
- Broome County · 126,805 people
- Metro
- Binghamton, NY
- Population (ZIP)
- 42,896
- Household income
- $66,095
- Rent vs Own
- Severe rent burden
- 1480.0
Population outlook (Broome County) Hauer SSP2
- Today (2025)
- 187,989 people
- By 2030
- 183,066 · -2.6%
- By 2040
- 172,228 · -8.4%
- By 2050
- 163,161 · -13.2%
- By 2075
- 153,641 · -18.3%
- By 2100
- 140,851 · -25.1%
Race, ethnicity, and origin ACS 2023
- Neighborhood character
- Predominantly White (84%)
- Race & ethnicity
- White 84% Two or more races 7% Hispanic / Latino 6% Black 4% Asian 2%
- Hispanic origin (detail)
- Puerto Rican 2%
- Common ancestry
- Romanian 6% Lithuanian 2% Slovak 2%
- Foreign-born
- 5% · Canada, China
- Languages at home
- 94% English-only · Spanish 2% Other Indo-European 1% Russian/Polish/Slavic 1%
Political lean MEDSL · Broome
- 2024 margin
- Toss-up / Even · D 50.2% · R 49.8%
- 2008→2024 swing
- -7.6pp toward R · 2008: 8.0pp · 2024: 0.4pp
- All cycles
- 2024: D+0.4 2020: D+3.5 2016: R+3.7 2012: D+4.6 2008: D+8.0
Not yet ingested
- Civics
- —
Market trends
- HPI YoY
- ▼ -131.29%
- Current HPI
- 270.2661
- Rent YoY
- ▲ 7.09%
- Metro
- Binghamton, NY
- State GDP YoY
- ▲ 2.60%
- F500 in state
- 92
Industry mix (Fortune 500 HQ in NY)
| Industry | F500 HQs | Revenue |
|---|---|---|
| Financial Services | 10 | $950B |
|
||
| Consumer Goods | 9 | $162B |
|
||
| Insurance | 4 | $225B |
|
||
| Telecommunications | 2 | $144B |
|
||
| Pharmaceuticals | 2 | $112B |
|
||
| Media / Entertainment | 2 | $69B |
|
||
Price history
+33.8% since first listed4 events — show timeline
- 2026-02-12 Pending — GBAOR
- 2026-02-09 Listed $169,900 GBAOR
- 2005-02-07 Sold (Public Records) $165,000 Public Records
- 1998-12-21 Sold (Public Records) $127,000 Public Records
Property tax history
+4.8%/yrLatest (2025): $6,420 · +3.2% YoY. Source: county tax records.
Cash-flow waterfall
monthlySold comps — $/sqft
last 12 mo · ≤1 miLoading sold comps…