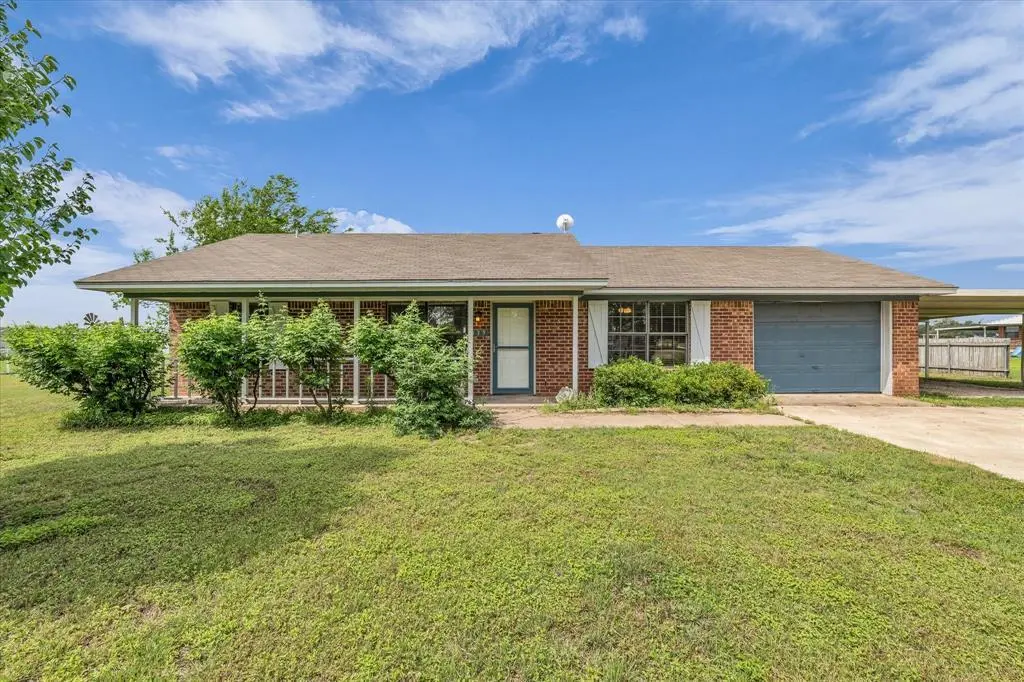
339 S Pleasant Hill Rd · Waco, TX
Flood risk 1/10 · Minimal
- FEMA flood zone
- X (unshaded)
- Chance of flooding over 30 yrs
- 0.0%
- Est. flood insurance / yr
- $507 – $1,088
Fire risk 4/10 · Minor
- Est. fire insurance / yr
- $1,222 – $2,270
Heat risk 7/10 · Major
- Hot days now (above 110°F)
- 7 days/yr
- Hot days in 30 yrs
- 26 days/yr
Wind risk 6/10 · Moderate
- Chance of severe wind over 30 yrs
- 60.0%
Air-quality risk 2/10 · Minimal
- Unhealthy air days now
- 0 days/yr
- Unhealthy air days in 30 yrs
- 1 days/yr
Risk factors via First Street. Map © Google.
Why this score? — see what drove the C- grade
The composite is a weighted blend of 9 inputs, each scored 0–100. Each bar is that input's sub-score; the figure is the points it added to the 100-point composite (weight × sub-score).
- ARV discount +13.7/15.0
- Cash flow +13.6/30.0
- Appreciation +5.2/10.0
- DSCR +4.1/10.0
- Livability +3.7/5.0
- Schools +3.4/10.0
- 1% rule +3.0/10.0
- Rent growth +2.5/5.0
- Condition / age +2.5/5.0
$298,000
🖨 Deal sheet 📄 Offer letter ✓ Due diligence
Listing remarks
Make this home your slice of Texas country living! Tucked away on a spacious 0.73 acre lot, this 3 bedroom, 2 bathroom home brings all the good vibes. . peaceful mornings, starry nights, and plenty of space to live life your way. Inside, you’ll find a cozy and welcoming layout filled with natural light and an easy flow between the main living spaces. . perfect for movie nights, hosting friends, or just kicking back after a long day. The kitchen is ready for everything from quick breakfasts to Sunday dinners, offering ample storage and prep space. Enjoy a relaxing sunroom or transform it into the perfect bonus flex space to fit your lifestyle. Outside, you’ll love the wide open
Key facts
- 0.73 acre lot
- Garage
- Built 1992
Property features AI
Finance
- Other: Lot is approximately 0.73 acre; Will not subdivide; Directions: GPS - 339 S Pleasant Hill Rd Axtell, TX; County: McLennan
- Financial info: Accepts Cash, Conventional, FHA, and VA financing; No second mortgage
- HOA & community: No association
Exterior
- Parking: Attached garage (1 car); Carport (2 spaces); Covered parking for 3 vehicles; Driveway
- Utilities: Co-op water; Septic system; No municipal utility district
- Home design: Single-family residence; Attached property; Built in 1992; Composition roof; Slab foundation; Subdivision: Tomas De La Vega
- Construction: Composition roof; Slab foundation; Built in 1992; Single-family construction
- Exterior features: Covered front porch; Glass-enclosed patio; Patio; Partial pipe fencing; Shed(s) on the property
Interior
- Kitchen: Dishwasher; Microwave
- Bedrooms: Three bedrooms (primary bedroom on level 1)
- Flooring: Tile flooring; Vinyl flooring
- Bathrooms: Two full bathrooms
- Heating & cooling: Central heating; Central air conditioning
- Interior features: One-level home; Window coverings; Other interior features; Four total rooms (living, dining, primary bedroom, primary bath)
- Laundry & utility: Full-size washer/dryer area; Washer hookup
Neighborhood map
What this means for you Summary
Snapshot
- This is a 3-bed/2.0-bath single-family listed at $298k.
Deal economics
- At list price, monthly cash flow is $15 ($186/yr) — positive.
- The deal already cash-flows at list — no discount required.
- To meet the 1% rule (rent ≥ 1% of price), the offer needs to be $240k (19.6% below list).
- Recommended offer: $240k (19.6% below list) — sets the bar for 1% rule.
- Cap rate 6.4% vs local median 3.9% in Waco — top-decile yield for the area; either an underpriced asset or a hidden risk that comps aren't pricing in. Stress-test before assuming the spread holds.
Location & tenants
- Location reads 74/100 on livability (#166 in TX, #4,378 nationally) — a middle-class / working-renter tenant base. Strengths: cost of living A+, housing A+, health & safety A+; Watch: crime D, commute F, employment D-.
- Axtell ISD (rural): math 33% / reading 46% proficiency, ranked #425 of 826 in TX (top 52%) — families likely to look elsewhere, expect single-tenant / working-renter base with shorter leases.
- Zoned schools: Axtell El (math 37% / reading 52%, grade F, #1,155 of 4,322 statewide, top 29%, 397 students, 51% FRL) — zoned schools at 51% FRL track the district average.
- Market conditions: 33 active listings in the ZIP; 1 comparable units currently listed for rent nearby; 1,014 units permitted in McLennan County in 2024 (200 in 5+ unit buildings).
Forward outlook
- In year one you build about $3k of equity ($2k loan paydown + $1k appreciation (0.3% local appreciation)).
- McLennan County population projected at +17% by 2050 — long-run rental-demand tailwind backs the buy-and-hold thesis.
- By year 9, paydown + projected appreciation supports a ~$33k cash-out refi (75% LTV) — recoverable capital for the next deal without selling this one.
Negotiation context
- It's been on market 49 days — a 3% lower offer ($289k) is reasonable based on typical stale-listing flexibility.
- 9 sale attempts since 10y ago; this cycle's ask is 12343% above the opening price — seller raised mid-cycle; expect resistance to lowballs.
Risks & watch-outs
- Climate carrying-cost: major wind risk, 60% chance of damaging wind over 30y; extreme-heat days projected 7→26/yr by 2055 (HVAC capex compounding) — expect insurance premiums to compound above CPI over the hold.
Questions for the listing agent
- It's been on market 49 days. Have you received any prior offers? Is the seller open to a 20% concession, seller financing, or rate buy-down credit?
- Is there a deadline driving the sale (1031 exchange, divorce, estate, relocation)? That informs how much negotiation room exists.
- Schools are D-rated, which usually means shorter tenancies and higher turnover. Who's the typical renter profile here, and what's been the actual vacancy rate?
- Crime grade is D in this area — have there been break-ins, vandalism, or insurance claims at this property in the last 3 years? What carrier currently insures it and at what premium?
- What's the average days-on-market for RENTAL listings here right now (not sales)? A rising rental-DOM trend means longer vacancies and softer asking-rent achievability than the comps imply.
- What's the recent tenant-quality profile in this submarket — average credit score on applications, eviction rate, late-payment / NSF rate, and stable-employment percentage? A property-management company in the area should have these aggregated.
- How much new for-sale + rental construction is in the pipeline within 1–3 miles? Heavy new supply typically softens prices + rents 12–24 months out; constrained supply supports both.
Investment metrics
- 1% rule
- 0.80% ✗
- Cap rate
- 6.36%
- Cash-on-cash
- 0.22%
- DSCR
- 1.01
- GRM
- 10.4
CMA / ARV
- ARV (median comp)
- $345,964
- List price
- $298,000
- Delta
- -13.86%
- Verdict
- UNDERPRICED
- Comps
- 6 within 1.0 mi
Projected returns pro-forma
0.35% appreciation · 3.0% rent growth · sell at horizon
- IRR
- -0.7%
- Equity multiple
- 0.97×
- Total profit
- $-2,872
- Equity at exit
- $91,782
- IRR
- 4.6%
- Equity multiple
- 1.52×
- Total profit
- $43,213
- Equity at exit
- $114,609
Cash invested: $83,440 (down + closing). Projections, not guarantees.
Landlord ↔ Tenant lean methodology
- Overall (STATE)
- 87 Strongly Landlord-Friendly
- State Texas
- 87 Strongly Landlord-Friendly · R+5
- County
- — inherits STATE
- City
- — inherits STATE
ZIP-level market 76624
- Home prices YoY
- 0.2%
- Active inventory
- 33
- Price-to-rent
- 10.4×
Monthly cashflow live
- Estimated rent
- $2,395 medium interval (Pro) →
- Mortgage (P&I)
- −$1,563
- Tax from tax record
- −$190 /mo · $2,276/yr
- Insurance
- −$124
- HOA
- −$0
- Vacancy / Maint / Mgmt
- −$503
- Net cashflow
- $15
Break-even live
UW: 25.0% down · 7.5% · 30yr · 1.5% tax · 5.0% vac · 8.0% maint · 8.0% mgmt
Financing live
Cash to close
- Down payment
- $74,500
- Closing costs
- $8,940
- Reserves months
- —
- Total cash needed
- —
Loan-product check · same deal, 3 products live
Conventional
25% down · 7.5% · 30yr
- Down + closing
- —
- Monthly P&I
- —
- Monthly cashflow
- —
- DSCR
- —
- Eligible?
- —
Personal DTI + credit; lowest rate.
DSCR
20% down · 8.5% · 30yr
- Down + closing
- —
- Monthly P&I
- —
- Monthly cashflow
- —
- DSCR
- —
- Eligible?
- —
No personal income docs; deal must DSCR.
Hard money
10% down · 12.0% · 12mo
- Down + closing
- —
- Monthly P&I
- —
- Monthly cashflow
- —
- DSCR
- —
- Eligible?
- —
Short-term bridge; refi at stabilization.
Rent comps 1 comps
| Address | Beds | Baths | Sqft | Rent | $/sqft | DOM | Units | Dist |
|---|---|---|---|---|---|---|---|---|
| 339 S Pleasant Hill Rd Unit NA Axtell, TX | 3.0 | 2.0 | 1170 | $2,395 | $2.05 | 43d | 1 | 0.03mi |
Listing history 31 events
-
2026-06-18days on market $298,000 Active 49 DOM
-
2026-06-17days on market $298,000 Active 48 DOM
-
2026-06-16days on market $298,000 Active 47 DOM
-
2026-06-15days on market $298,000 Active 46 DOM
-
2026-06-14days on market $298,000 Active 44 DOM
-
2026-06-13days on market $298,000 Active 43 DOM
-
2026-06-10days on market $298,000 Active 41 DOM
-
2026-06-09days on market $298,000 Active 40 DOM
-
2026-06-08days on market $298,000 Active 39 DOM
-
2026-06-07pricedays on market $298,000 Active 38 DOM
-
2026-06-02days on market $319,000 Active 33 DOM
-
2026-06-01days on market $319,000 Active 32 DOM
-
2026-05-31days on market $319,000 Active 31 DOM
-
2026-05-30days on market $319,000 Active 30 DOM
-
2026-05-17$2,395
-
2026-04-30$319,000 Active 1147-char remark
-
2026-04-17historical $2,500
-
2026-03-10$2,500
-
2026-03-10historical $2,500
-
2026-03-08$2,500
-
2026-01-19historical $2,500
-
2025-12-31$2,500
-
2025-12-31historical $2,500
-
2025-11-01$2,500
-
2025-11-01historical $2,500
-
2025-09-26$2,500
-
2016-10-18historical
-
2016-04-18$198,500
-
2009-05-11soldstatus
-
2008-03-31soldstatus
-
2001-03-16soldstatus
ⓘ Source: listings_history table (triggers on properties + properties_extension) + one-shot
backfill from property_details.listing_events for pre-trigger history.
Tax reassessment forecast TX · Resets to sale price
- Current annual tax
- $2,276 · $190/mo
- Projected year-2 tax
- $5,453 · $454/mo
- Expected delta
- +$3,177/yr (+$265/mo · 139.6%)
ⓘ Screening estimate from a state-policy table — verify with the county assessor before closing.
Climate risk First Street
- Flood 1/10 Low FEMA zone X (unshaded) · 0% chance over 30 yrs
- Wildfire 4/10 Moderate
- Heat 7/10 Severe 7 d/yr ≥110°F today · 26 d/yr by 30 yrs out
- Wind 6/10 Major 60% chance of damaging wind over 30 yrs
- Air quality 2/10 Low 0 unhealthy d/yr today · 1 by 30 yrs out
Nearby sold comps map
Loading sold comps map…
Walkable amenities ~0.75 mi
Loading nearby amenities…
Taxation est. · year 1
- Rental income
- $28,740
- − Mortgage interest
- −$16,693
- − Property taxes
- −$2,276
- − Insurance
- −$1,490
- − Repairs & maintenance
- −$2,299
- − Management
- −$2,299
- − Depreciation
- −$8,669
- Taxable loss
- −$4,986
- Est. tax savings @ 24.0%
- +$1,197
- After-tax cash flow
- $1,382/yr
For passive investors: Depreciation is non-cash, so a rental often shows a tax loss while cash-flowing — sheltering income. Rental losses are passive: they offset passive income freely, and up to $25,000/yr can offset ordinary (W-2) income if you actively participate and your MAGI is under $100k (phasing out to $0 by $150k); unused losses carry forward. On sale, claimed depreciation is recaptured at up to 25%, and gains may owe capital-gains tax (a 1031 exchange can defer both). Figures are a year-1 estimate at your 24.0% rate — not tax advice; consult a CPA.
Schools (NCES district)
- District
- Axtell ISD
- NCES district ID
- 4809150
- Math proficiency
- 33% ▼ -11.00%
- Reading proficiency
- 46% ▼ -2.00%
- Median HH income
- $48,524
- Composite
- 33.89/100
- National rank
- #5346
- State rank
- #425 of 826 in TX
Livability — Waco
- Score
- 74/100
- State rank
- #166
- US rank
- #4378
Category grades
Schools grade is shown separately in the Schools card above.
Census & demographics
- City population
- 125,319
- Population (ZIP)
- 2,679
Population outlook (McLennan County) Hauer SSP2
- Today (2025)
- 264,191 people
- By 2030
- 273,578 · +3.6%
- By 2040
- 291,506 · +10.3%
- By 2050
- 308,044 · +16.6%
- By 2075
- 349,648 · +32.3%
- By 2100
- 364,779 · +38.1%
Race, ethnicity, and origin ACS 2023
- Neighborhood character
- Predominantly White (74%)
- Race & ethnicity
- White 74% Two or more races 21% Hispanic / Latino 10% Black 4%
- Hispanic origin (detail)
- Mexican 10%
- Common ancestry
- Romanian 3% Danish 2% Serbian 2%
- Foreign-born
- 3% · Canada
- Languages at home
- 97% English-only · Spanish 2%
Political lean MEDSL · McLennan
- 2024 margin
- Solid R (+30.9) · D 34.0% · R 64.9% · Other 1.0%
- 2008→2024 swing
- -7.0pp toward R · 2008: -23.9pp · 2024: -30.9pp
- All cycles
- 2024: R+30.9 2020: R+23.4 2016: R+27.1 2012: R+29.8 2008: R+23.9
Not yet ingested
- Civics
- —
Market trends
- HPI YoY
- ▲ 0.35%
- Current HPI
- 146.68
- Rent YoY
- —
- Metro
- —
- State GDP YoY
- ▲ 3.95%
- F500 in state
- 110
Industry mix (Fortune 500 HQ in TX)
| Industry | F500 HQs | Revenue |
|---|---|---|
| Energy | 16 | $1,198B |
|
||
| Technology | 5 | $198B |
|
||
| Engineering / Construction | 4 | $72B |
|
||
| Energy Services | 3 | $60B |
|
||
| Utilities | 3 | $41B |
|
||
| Healthcare | 2 | $330B |
|
||
Price history
-98.8% since first listed20 events — show timeline
- 2026-06-16 Listed for Rent $2,395 RENTALBEAST
- 2026-06-15 Rental Removed $2,395 Avail
- 2026-06-03 Price Changed $298,000 NTREIS
- 2026-05-17 Listed for Rent $2,395 Avail
- 2026-04-30 Listed $319,000 NTREIS
- 2026-04-17 Rental Removed $2,500 Avail
- 2026-03-10 Listed for Rent $2,500 Avail
- 2026-03-10 Rental Removed $2,500 RENTALBEAST
- 2026-03-08 Listed for Rent $2,500 RENTALBEAST
- 2026-01-19 Rental Removed $2,500 RENTALBEAST
- 2025-12-31 Listed for Rent $2,500 RENTALBEAST
- 2025-12-31 Rental Removed $2,500 Avail
- 2025-11-01 Listed for Rent $2,500 Avail
- 2025-11-01 Rental Removed $2,500 PROPERTYWARE
- 2025-09-26 Listed for Rent $2,500 PROPERTYWARE
- 2016-10-18 Listing Removed — NTREIS
- 2016-04-18 Listed $198,500 NTREIS
- 2009-05-11 Sold (Public Records) — Public Records
- 2008-03-31 Sold (Public Records) — Public Records
- 2001-03-16 Sold (Public Records) — Public Records
Property tax history
+3.4%/yrLatest (2025): $2,276 · +9.9% YoY. Source: county tax records.
Cash-flow waterfall
monthlySold comps — $/sqft
last 12 mo · ≤1 miLoading sold comps…