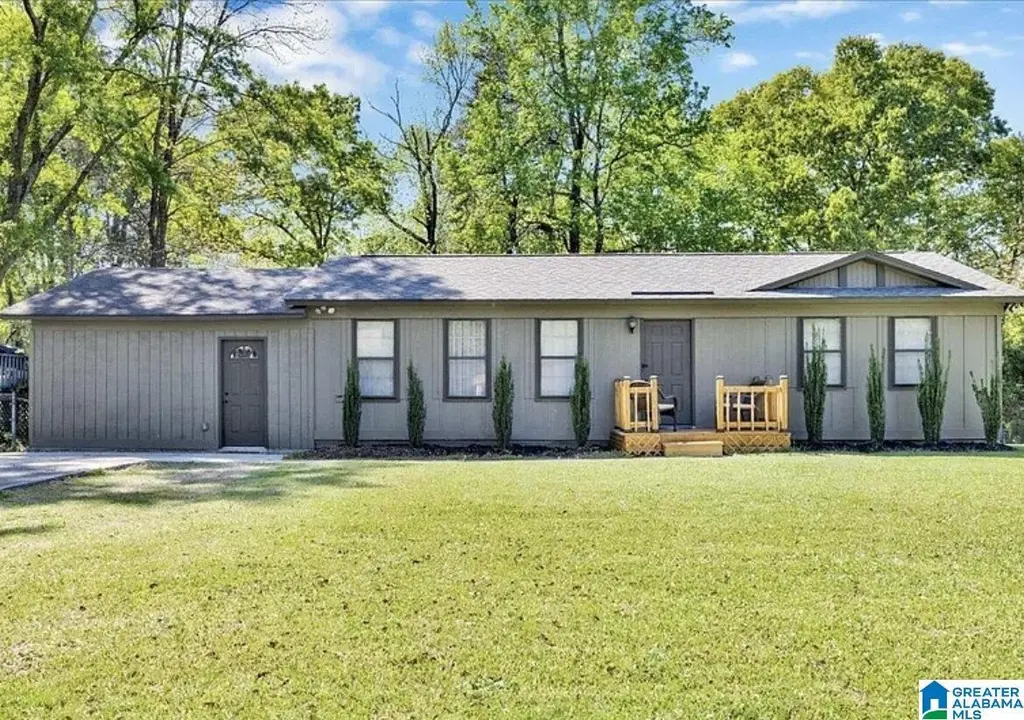
3020 Brandice Cir · Adamsville, AL
Flood risk 1/10 · Minimal
- FEMA flood zone
- X (unshaded)
- Chance of flooding over 30 yrs
- 0.0%
- Est. flood insurance / yr
- $507 – $1,088
Fire risk 3/10 · Minor
- Est. fire insurance / yr
- $916 – $1,700
Heat risk 6/10 · Moderate
- Hot days now (above 107°F)
- 7 days/yr
- Hot days in 30 yrs
- 19 days/yr
Wind risk 6/10 · Moderate
- Chance of severe wind over 30 yrs
- 27.0%
Air-quality risk 3/10 · Minor
- Unhealthy air days now
- 3 days/yr
- Unhealthy air days in 30 yrs
- 5 days/yr
Risk factors via First Street. Map © Google.
Why this score? — see what drove the D- grade
The composite is a weighted blend of 9 inputs, each scored 0–100. Each bar is that input's sub-score; the figure is the points it added to the 100-point composite (weight × sub-score).
- ARV discount +15.0/15.0
- Cash flow +10.0/30.0
- DSCR +2.9/10.0
- Livability +2.6/5.0
- Rent growth +2.5/5.0
- Condition / age +2.5/5.0
- 1% rule +1.8/10.0
- Schools +1.8/10.0
- Appreciation +0.1/10.0
$165,900
🖨 Deal sheet 📄 Offer letter ✓ Due diligence
Listing remarks MLS
Charming 3-bedroom, 1-bath home with thoughtful updates throughout! Enjoy an added den created from the enclosed 2-car carport great for extra living space or entertaining. This home features a newly remodeled bathroom, fresh exterior paint, and a brand-new front porch that adds great curb appeal. Step outside to a large backyard with plenty of space for gatherings, gardening, or relaxing. A must-see! This isn’t a trailer it’s a house…
Key facts
- Added den
- Large backyard
- Fresh exterior paint
Tags
Neighborhood map
What this means for you Summary
Snapshot
- This is a 3-bed/1.0-bath single-family listed at $166k.
Deal economics
- At list price, monthly cash flow is $-100 ($-1k/yr) — negative.
- To cash-flow at today's rent, offer at most $148k (10.6% below list).
- To meet the 1% rule (rent ≥ 1% of price), the offer needs to be $112k (32.5% below list).
- Recommended offer: $112k (32.5% below list) — sets the bar for 1% rule.
Location & tenants
- Location reads 51/100 on livability (#522 in AL) — a working-class tenant base; expect higher turnover. Strengths: cost of living A+, housing A+; Watch: schools F, crime F, amenities F.
- Jefferson County (suburban): math 9% / reading 32% proficiency, ranked #104 of 129 in AL (top 81%) — low school quality limits family demand, transient renter base, plan for 1-2y turnover.
- Market conditions: 59 active listings in the ZIP; 3 comparable units currently listed for rent nearby; rentals at typical pace (median 24d on market — plan ~3-4 weeks tenant-placement turnaround); 2,114 units permitted in Jefferson County in 2024 (556 in 5+ unit buildings).
Forward outlook
- Local home prices are declining (-3.0%/yr); year-one equity from $1k of loan paydown is wiped out by about $5k of value loss. Plan a longer hold.
- Jefferson County population projected to shrink 4% by 2050 — rents likely to lag national; underwrite the cash flow, not the appreciation.
Negotiation context
- It's been on market 77 days — a 6% lower offer ($156k) is reasonable based on typical stale-listing flexibility.
- 2 sale attempts since 5y ago with the ask held roughly flat each time — persistent listings suggest the price (not the market) is what's stuck; bring a comps-based counter.
- Current owner paid $99k; list at $166k implies a 68% gain — meaningful room to come down on a strong offer.
Risks & watch-outs
- Climate carrying-cost: major wind risk, 27% chance of damaging wind over 30y; extreme-heat days projected 7→19/yr by 2055 (HVAC capex compounding) — expect insurance premiums to compound above CPI over the hold.
Questions for the listing agent
- What do current leases actually rent for vs. the listed asking? Can we see a recent rent roll and the last 12 months of T-12 income?
- It's been on market 77 days. Have you received any prior offers? Is the seller open to a 32% concession, seller financing, or rate buy-down credit?
- Built in 1978 — when were the roof, HVAC, electrical panel, plumbing, and water heater last replaced?
- Why hasn't it sold? Are there any deal-killer items the seller is aware of (foundation, flood, title, zoning, code violations)?
- Is there a deadline driving the sale (1031 exchange, divorce, estate, relocation)? That informs how much negotiation room exists.
- Schools are F-rated, which usually means shorter tenancies and higher turnover. Who's the typical renter profile here, and what's been the actual vacancy rate?
- Crime grade is F in this area — have there been break-ins, vandalism, or insurance claims at this property in the last 3 years? What carrier currently insures it and at what premium?
- The area grade is low — what's the realistic commute time and amenity access for the typical tenant pool here? Any planned neighborhood developments (good or bad) we should know about?
- What's the average days-on-market for RENTAL listings here right now (not sales)? A rising rental-DOM trend means longer vacancies and softer asking-rent achievability than the comps imply.
- What's the recent tenant-quality profile in this submarket — average credit score on applications, eviction rate, late-payment / NSF rate, and stable-employment percentage? A property-management company in the area should have these aggregated.
- How much new for-sale + rental construction is in the pipeline within 1–3 miles? Heavy new supply typically softens prices + rents 12–24 months out; constrained supply supports both.
Investment metrics
- 1% rule
- 0.68% ✗
- Cap rate
- 5.57%
- Cash-on-cash
- -2.58%
- DSCR
- 0.89
- GRM
- 12.3
CMA / ARV
- ARV (median comp)
- $200,822
- List price
- $165,900
- Delta
- -17.39%
- Verdict
- UNDERPRICED
- Comps
- 16 within 1.0 mi
Show comp detail 1 sale within ~0.75 mi
| Address | Dist | Beds/Ba | Sqft | Sold | Price | $/sf | Match |
|---|---|---|---|---|---|---|---|
| 2917 Valleyview Cir | 0.70mi | 3/2.0 | 1,100 (+9%) | 7mo | $180,000 | $164 | 42 |
Match score weights: distance 35% · size 25% · config 20% · recency 20%. Top-matched comps best support the ARV.
Projected returns pro-forma
-3.0% appreciation · 3.0% rent growth · sell at horizon
- IRR
- -20.7%
- Equity multiple
- 0.28×
- Total profit
- $-33,319
- Equity at exit
- $24,736
- IRR
- -14.0%
- Equity multiple
- 0.19×
- Total profit
- $-37,530
- Equity at exit
- $14,344
Cash invested: $46,452 (down + closing). Projections, not guarantees.
Landlord ↔ Tenant lean methodology
- Overall (STATE)
- 90 Strongly Landlord-Friendly
- State Alabama
- 90 Strongly Landlord-Friendly · R+15
- County
- — inherits STATE
- City
- — inherits STATE
ZIP-level market 35005
- Home prices YoY
- -3.9%
- Active inventory
- 59
- Price-to-rent
- 12.3×
Monthly cashflow live
- Estimated rent
- $1,121 medium interval (Pro) →
- Mortgage (P&I)
- −$870
- Tax from tax record
- −$46 /mo · $550/yr
- Insurance
- −$69
- HOA
- −$0
- Vacancy / Maint / Mgmt
- −$235
- Net cashflow
- $-100
Break-even live
UW: 25.0% down · 7.5% · 30yr · 1.5% tax · 5.0% vac · 8.0% maint · 8.0% mgmt
Financing live
Cash to close
- Down payment
- $41,475
- Closing costs
- $4,977
- Reserves months
- —
- Total cash needed
- —
Loan-product check · same deal, 3 products live
Conventional
25% down · 7.5% · 30yr
- Down + closing
- —
- Monthly P&I
- —
- Monthly cashflow
- —
- DSCR
- —
- Eligible?
- —
Personal DTI + credit; lowest rate.
DSCR
20% down · 8.5% · 30yr
- Down + closing
- —
- Monthly P&I
- —
- Monthly cashflow
- —
- DSCR
- —
- Eligible?
- —
No personal income docs; deal must DSCR.
Hard money
10% down · 12.0% · 12mo
- Down + closing
- —
- Monthly P&I
- —
- Monthly cashflow
- —
- DSCR
- —
- Eligible?
- —
Short-term bridge; refi at stabilization.
Rent comps 3 comps
| Address | Beds | Baths | Sqft | Rent | $/sqft | DOM | Units | Dist |
|---|---|---|---|---|---|---|---|---|
| 2856 Valleyview Cir Adamsville, AL | 3.0 | 1.0 | 962 | $1,050 | $1.09 | 43d | 1 | 0.85mi |
| 4985 Karen Ln Adamsville, AL | 3.0 | 1.5 | 1008 | $1,095 | $1.09 | 23d | 1 | 1.03mi |
| 1411 Bucks Dr Adamsville, AL | 3.0 | 1.0 | 1392 | $1,331 | $0.96 | 10d | 1 | 1.46mi |
Listing history 21 events
-
2026-06-18days on market $165,900 Active 77 DOM
-
2026-06-17days on market $165,900 Active 76 DOM
-
2026-06-16days on market $165,900 Active 75 DOM
-
2026-06-15days on market $165,900 Active 74 DOM
-
2026-06-13pricedays on market $165,900 Active 72 DOM
-
2026-06-10days on market $169,900 Active 69 DOM
-
2026-06-09days on market $169,900 Active 68 DOM
-
2026-06-08days on market $169,900 Active 67 DOM
-
2026-06-07days on market $169,900 Active 66 DOM
-
2026-06-03days on market $169,900 Active 62 DOM
-
2026-06-02days on market $169,900 Active 61 DOM
-
2026-06-01days on market $169,900 Active 60 DOM
-
2026-05-31days on market $169,900 Active 59 DOM
-
2026-04-02$169,900 Active 458-char remark
Show marketing remark (458 chars)
Charming 3-bedroom, 1-bath home with thoughtful updates throughout! Enjoy an added den created from the enclosed 2-car carport great for extra living space or entertaining. This home features a newly remodeled bathroom, fresh exterior paint, and a brand-new front porch that adds great curb appeal. Step outside to a large backyard with plenty of space for gatherings, gardening, or relaxing. A must-see! This isn’t a trailer it’s a house…
-
2025-10-28price $167,900
-
2021-06-25soldstatus $98,900
-
2021-06-22soldstatus $98,900 Sold
-
2021-05-18historical Contingent
-
2021-05-15$92,900 Active
-
1999-04-06soldstatus $63,000
-
1993-05-25soldstatus $50,000
ⓘ Source: listings_history table (triggers on properties + properties_extension) + one-shot
backfill from property_details.listing_events for pre-trigger history.
Tax reassessment forecast AL · Resets to sale price
- Current annual tax
- $550 · $46/mo
- Projected year-2 tax
- $680 · $57/mo
- Expected delta
- +$130/yr (+$11/mo · 23.6%)
ⓘ Screening estimate from a state-policy table — verify with the county assessor before closing.
Climate risk First Street
- Flood 1/10 Low FEMA zone X (unshaded) · 0% chance over 30 yrs
- Wildfire 3/10 Moderate
- Heat 6/10 Major 7 d/yr ≥107°F today · 19 d/yr by 30 yrs out
- Wind 6/10 Major 27% chance of damaging wind over 30 yrs
- Air quality 3/10 Moderate 3 unhealthy d/yr today · 5 by 30 yrs out
Nearby sold comps map
Loading sold comps map…
Walkable amenities ~0.75 mi
Loading nearby amenities…
Taxation est. · year 1
- Rental income
- $13,446
- − Mortgage interest
- −$9,293
- − Property taxes
- −$550
- − Insurance
- −$830
- − Repairs & maintenance
- −$1,076
- − Management
- −$1,076
- − Depreciation
- −$4,826
- Taxable loss
- −$4,204
- Est. tax savings @ 24.0%
- +$1,009
- After-tax cash flow
- $-188/yr
For passive investors: Depreciation is non-cash, so a rental often shows a tax loss while cash-flowing — sheltering income. Rental losses are passive: they offset passive income freely, and up to $25,000/yr can offset ordinary (W-2) income if you actively participate and your MAGI is under $100k (phasing out to $0 by $150k); unused losses carry forward. On sale, claimed depreciation is recaptured at up to 25%, and gains may owe capital-gains tax (a 1031 exchange can defer both). Figures are a year-1 estimate at your 24.0% rate — not tax advice; consult a CPA.
Schools (NCES district)
- District
- Jefferson County
- NCES district ID
- 0101920
- Math proficiency
- 9% ▼ -24.00%
- Reading proficiency
- 32% ▼ -5.00%
- Median HH income
- $51,712
- Composite
- 18.4/100
- National rank
- #8937
- State rank
- #104 of 129 in AL
Livability — Adamsville
- Score
- 51/100
- State rank
- #522
- US rank
- #25480
Category grades
Schools grade is shown separately in the Schools card above.
Census & demographics
- City population
- 10,982
- Population (ZIP)
- 8,143
Population outlook (Jefferson County) Hauer SSP2
- Today (2025)
- 669,185 people
- By 2030
- 669,694 · +0.1%
- By 2040
- 661,388 · -1.2%
- By 2050
- 643,086 · -3.9%
- By 2075
- 577,267 · -13.7%
- By 2100
- 474,758 · -29.1%
Race, ethnicity, and origin ACS 2023
- Neighborhood character
- Majority Black (60%)
- Race & ethnicity
- Black 60% White 38% Asian 2%
- Common ancestry
- Serbian 2% Lithuanian 1%
- Foreign-born
- 1%
- Languages at home
- 98% English-only · Other Indo-European 1% Spanish 1%
Political lean MEDSL · Jefferson
- 2024 margin
- D (+10.4) · D 54.6% · R 44.2% · Other 1.2%
- 2008→2024 swing
- +5.4pp toward D · 2008: 5.1pp · 2024: 10.4pp
- All cycles
- 2024: D+10.4 2020: D+13.2 2016: D+7.2 2012: D+6.0 2008: D+5.1
Not yet ingested
- Civics
- —
Market trends
- HPI YoY
- ▼ -9.72%
- Current HPI
- 237.5788
- Rent YoY
- —
- Metro
- —
- State GDP YoY
- ▲ 2.94%
- F500 in state
- 4
Industry mix (Fortune 500 HQ in AL)
| Industry | F500 HQs | Revenue |
|---|---|---|
| Financial Services | 1 | $8B |
|
||
| Healthcare | 1 | $5B |
|
||
Price history
+239.8% since first listed8 events — show timeline
- 2026-04-02 Listed $169,900 Greater Alabama MLS
- 2025-10-28 Price Changed $167,900 Greater Alabama MLS
- 2021-06-25 Sold (Public Records) $98,900 Public Records
- 2021-06-22 Sold (MLS) $98,900 Greater Alabama MLS
- 2021-05-18 Contingent — Greater Alabama MLS
- 2021-05-15 Listed $92,900 Greater Alabama MLS
- 1999-04-06 Sold (Public Records) $63,000 Public Records
- 1993-05-25 Sold (Public Records) $50,000 Public Records
Property tax history
-7.2%/yrLatest (2025): $550 · +4.6% YoY. Source: county tax records.
Cash-flow waterfall
monthlySold comps — $/sqft
last 12 mo · ≤1 miLoading sold comps…