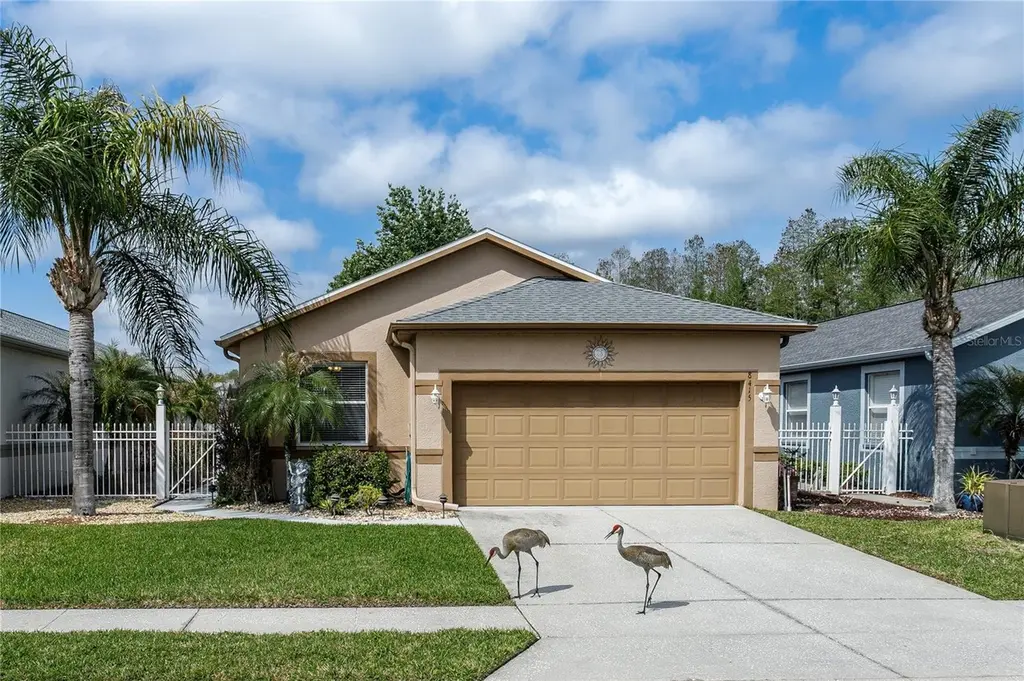
8415 Tarocco Ct · Connerton, FL
Flood risk 1/10 · Minimal
- FEMA flood zone
- X (unshaded)
- Chance of flooding over 30 yrs
- 0.0%
- Est. flood insurance / yr
- $507 – $1,088
Fire risk 4/10 · Minor
- Est. fire insurance / yr
- $947 – $1,759
Heat risk 10/10 · Severe
- Hot days now (above 109°F)
- 7 days/yr
- Hot days in 30 yrs
- 26 days/yr
Wind risk 9/10 · Severe
- Chance of severe wind over 30 yrs
- 99.0%
Air-quality risk 2/10 · Minimal
- Unhealthy air days now
- 1 days/yr
- Unhealthy air days in 30 yrs
- 1 days/yr
Risk factors via First Street. Map © Google.
Why this score? — see what drove the D- grade
The composite is a weighted blend of 9 inputs, each scored 0–100. Each bar is that input's sub-score; the figure is the points it added to the 100-point composite (weight × sub-score).
- Cash flow +9.5/30.0
- ARV discount +7.0/15.0
- Schools +4.3/10.0
- Appreciation +4.2/10.0
- 1% rule +3.7/10.0
- Livability +3.3/5.0
- DSCR +2.7/10.0
- Rent growth +2.5/5.0
- Condition / age +2.5/5.0
$344,900
🖨 Deal sheet 📄 Offer letter ✓ Due diligence
Listing remarks
One or more photo(s) has been virtually staged. MOVE-IN-READY HOME-Experience the Active 55+ lifestyle in the highly sought-after GATED golf community -THE GROVES GOLF AND COUNTRY CLUB. Nestled on a quiet cul-de-sac, this beautifully maintained 3/2/2 single-family HOME offers a private screened-in LANAI with views of the NATURE PRESERVE. The interior of this home has been FRESHLY PAINTED. The exterior is due to be painted by the HOA. The new buyer will be able to choose the color. The private courtyard has been cleaned and fresh mulch has been added for a finished look. Immaculate cared for courtyard-home welcomes you with a spacious open floor plan, high ceilings, and a light-filled living
Key facts
- Solid wood cabinetry
- Quartz counter space
- Stainless appliances
Tags
Property features AI
Finance
- Other: Property in CDD; Lot approx. 0.14 acres (landscaped, level, near golf course, paved, in county)
- Financial info: Lease restrictions apply
- HOA & community: HOA (Greenacre Properties) — required association approval; Monthly HOA approximately $246.80 (quarterly fee listed $740.41); HOA amenities include clubhouse, fitness center, gated community, golf course access, park, pool, recreation facilities, security, spa/hot tub, storage, tennis, pickleball and shuffleboard courts, street lights, sidewalks, and fence restrictions; Senior community; Pets allowed (cats and dogs); Association fee covers cable TV, pool, internet, grounds maintenance, management, recreational facilities, security, and escrow reserves
Exterior
- Parking: Driveway; Garage door opener; Attached 2-car garage
- Security: Gated community; Smoke detector(s)
- Utilities: Public water; Public sewer; Cable connected; Electricity connected; Phone available; Sewer connected; Water connected; Underground utilities; Sprinkler meter
- Home design: Single family residence; One story; MPUD zoning; Faces west; Residential property
- Construction: Block and stucco construction; Shingle roof; Slab foundation; Built as part of a planned community
- Exterior features: Covered rear porch with screened porch; Porch; Hurricane shutters; Private mailbox; Rain gutters; Sidewalk; Sprinkler (metered); Irrigation equipment; Fenced (other)
Interior
- Kitchen: Dishwasher; Disposal; Microwave; Range; Refrigerator; Water softener; Electric water heater
- Bedrooms: 3 bedrooms
- Flooring: Ceramic tile
- Bathrooms: 2 full bathrooms
- Heating & cooling: Central heating (electric); Central air conditioning
- Interior features: Ceiling fans; Crown molding; Eat-in kitchen; High ceilings; Living room/dining room combo; Open floorplan; Solid surface counters; Solid wood cabinets; Split bedroom floorplan; Walk-in closet(s)
- Laundry & utility: Washer hookup; Dryer hookup (electric); Inside laundry room
Neighborhood map
What this means for you Summary
Snapshot
- This is a 3-bed/2.0-bath single-family listed at $345k.
Deal economics
- At list price, monthly cash flow is $-242 ($-3k/yr) — negative.
- To cash-flow at today's rent, offer at most $302k (12.4% below list).
- To meet the 1% rule (rent ≥ 1% of price), the offer needs to be $301k (12.7% below list).
- Recommended offer: $301k (12.7% below list) — sets the bar for 1% rule.
- Cap rate 5.4% vs local median 4.3% in Connerton — meaningfully above typical; check what's discounted (condition, days-on-market, listing class) to confirm the premium yield is real.
Location & tenants
- Location reads 66/100 on livability (#596 in FL) — a middle-class / working-renter tenant base. Strengths: crime A+, employment A+, housing A+; Watch: schools D+, amenities F, commute F.
- Pasco (suburban): math 50% / reading 52% proficiency, ranked #32 of 73 in FL (top 44%) — acceptable for families but not a draw, mixed tenant base, ~2y average lease.
- Market conditions: 285 active listings in the ZIP; 8 comparable units currently listed for rent nearby; rentals at typical pace (median 18d on market — plan ~3-4 weeks tenant-placement turnaround); high-income renter base; 6,765 units permitted in Pasco County in 2024 (1,250 in 5+ unit buildings).
- This rent runs 31% of the median local income ($115k/yr) — at the standard rent-burdened threshold; future hikes will face affordability resistance.
Forward outlook
- Local home prices are declining (-1.5%/yr); year-one equity from $2k of loan paydown is wiped out by about $5k of value loss. Plan a longer hold.
- Pasco County population projected at +29% by 2050 — long-run rental-demand tailwind backs the buy-and-hold thesis.
Negotiation context
- It's been on market 83 days — a 6% lower offer ($324k) is reasonable based on typical stale-listing flexibility.
- 2 sale attempts with the ask held roughly flat each time — persistent listings suggest the price (not the market) is what's stuck; bring a comps-based counter.
Risks & watch-outs
- Climate carrying-cost: severe wind risk, 99% chance of damaging wind over 30y; extreme-heat days projected 7→26/yr by 2055 (HVAC capex compounding) — expect insurance premiums to compound above CPI over the hold.
Questions for the listing agent
- What do current leases actually rent for vs. the listed asking? Can we see a recent rent roll and the last 12 months of T-12 income?
- It's been on market 83 days. Have you received any prior offers? Is the seller open to a 13% concession, seller financing, or rate buy-down credit?
- What does the HOA fee cover, when was the last increase, and are there any pending special assessments or reserve-fund shortfalls?
- Why hasn't it sold? Are there any deal-killer items the seller is aware of (foundation, flood, title, zoning, code violations)?
- Is there a deadline driving the sale (1031 exchange, divorce, estate, relocation)? That informs how much negotiation room exists.
- Schools are D-rated, which usually means shorter tenancies and higher turnover. Who's the typical renter profile here, and what's been the actual vacancy rate?
- The area grade is low — what's the realistic commute time and amenity access for the typical tenant pool here? Any planned neighborhood developments (good or bad) we should know about?
- What's the average days-on-market for RENTAL listings here right now (not sales)? A rising rental-DOM trend means longer vacancies and softer asking-rent achievability than the comps imply.
- What's the recent tenant-quality profile in this submarket — average credit score on applications, eviction rate, late-payment / NSF rate, and stable-employment percentage? A property-management company in the area should have these aggregated.
- How much new for-sale + rental construction is in the pipeline within 1–3 miles? Heavy new supply typically softens prices + rents 12–24 months out; constrained supply supports both.
Investment metrics
- 1% rule
- 0.87% ✗
- Cap rate
- 5.45%
- Cash-on-cash
- -3.01%
- DSCR
- 0.87
- GRM
- 9.5
CMA / ARV
- ARV (on-the-fly)
- $341,120
- Comps found
- 12
Show comp detail 12 sales within ~0.75 mi
| Address | Dist | Beds/Ba | Sqft | Sold | Price | $/sf | Match |
|---|---|---|---|---|---|---|---|
| 20907 Diamonte Dr | 0.07mi | 3/2.0 | 1,688 (+1%) | 3mo | $340,000 | $201 | 92 |
| 21422 Diamonte Dr | 0.13mi | 3/2.0 | 1,688 (+1%) | 2mo | $328,000 | $194 | 90 |
| 8432 Tarocco Ct | 0.06mi | 3/2.0 | 1,746 (+5%) | 6mo | $425,000 | $243 | 84 |
| 20904 Tangor Rd | 0.34mi | 3/2.0 | 1,646 (-1%) | 0mo | $285,000 | $173 | 82 |
| 20907 Tangor Rd | 0.30mi | 3/2.0 | 1,680 (+1%) | 2mo | $345,000 | $205 | 82 |
| 8128 Ambersweet Pl | 0.24mi | 2/2.0 (-1) | 1,666 (+0%) | 4mo | $379,900 | $228 | 80 |
| 8144 Ambersweet Pl | 0.21mi | 2/2.0 (-1) | 1,588 (-5%) | 2mo | $310,000 | $195 | 76 |
| 8205 Ponkan Rd | 0.22mi | 2/2.0 (-1) | 1,749 (+5%) | 1mo | $340,000 | $194 | 75 |
| 21005 Wistful Yearn Dr | 0.54mi | 3/2.0 | 1,614 (-3%) | 7mo | $350,000 | $217 | 64 |
| 9264 Bella Vita Cir | 0.73mi | 3/2.0 | 1,768 (+6%) | 3mo | $400,000 | $226 | 53 |
| 7850 Genoa Ln | 0.61mi | 3/2.0 | 1,884 (+13%) | 3mo | $444,400 | $236 | 47 |
| 7640 Blue Spring Dr | 0.72mi | 4/2.0 (+1) | 1,810 (+9%) | 8mo | $350,000 | $193 | 40 |
Match score weights: distance 35% · size 25% · config 20% · recency 20%. Top-matched comps best support the ARV.
Projected returns pro-forma
-1.54% appreciation · 3.0% rent growth · sell at horizon
- IRR
- -12.5%
- Equity multiple
- 0.49×
- Total profit
- $-49,518
- Equity at exit
- $74,429
- IRR
- -5.2%
- Equity multiple
- 0.56×
- Total profit
- $-42,478
- Equity at exit
- $70,862
Cash invested: $96,572 (down + closing). Projections, not guarantees.
Landlord ↔ Tenant lean methodology
- Overall (STATE)
- 87 Strongly Landlord-Friendly
- State Florida
- 87 Strongly Landlord-Friendly · R+3
- County
- — inherits STATE
- City
- — inherits STATE
ZIP-level market 34637
- Home prices YoY
- -1.2%
- Active inventory
- 285
- Price-to-rent
- 9.5×
Monthly cashflow live
- Estimated rent
- $3,012 high interval (Pro) →
- Mortgage (P&I)
- −$1,809
- Tax from tax record
- −$423 /mo · $5,080/yr
- Insurance
- −$144
- HOA
- −$246
- Vacancy / Maint / Mgmt
- −$632
- Net cashflow
- $-242
Break-even live
UW: 25.0% down · 7.5% · 30yr · 1.5% tax · 5.0% vac · 8.0% maint · 8.0% mgmt
Financing live
Cash to close
- Down payment
- $86,225
- Closing costs
- $10,347
- Reserves months
- —
- Total cash needed
- —
Loan-product check · same deal, 3 products live
Conventional
25% down · 7.5% · 30yr
- Down + closing
- —
- Monthly P&I
- —
- Monthly cashflow
- —
- DSCR
- —
- Eligible?
- —
Personal DTI + credit; lowest rate.
DSCR
20% down · 8.5% · 30yr
- Down + closing
- —
- Monthly P&I
- —
- Monthly cashflow
- —
- DSCR
- —
- Eligible?
- —
No personal income docs; deal must DSCR.
Hard money
10% down · 12.0% · 12mo
- Down + closing
- —
- Monthly P&I
- —
- Monthly cashflow
- —
- DSCR
- —
- Eligible?
- —
Short-term bridge; refi at stabilization.
Rent comps 8 comps
| Address | Beds | Baths | Sqft | Rent | $/sqft | DOM | Units | Dist |
|---|---|---|---|---|---|---|---|---|
| 21030 Green Wing Ct Land O Lakes, FL | 4.0 | 2.5 | 1945 | $2,185 | $1.12 | 24d | 1 | 0.60mi |
| 7655 Citrus Blossom Dr Land O Lakes, FL | 4.0 | 2.0 | 2070 | $3,100 | $1.50 | 11d | 1 | 0.70mi |
| 7442 Citrus Blossom Dr Land O Lakes, FL | 4.0 | 2.0 | 2067 | $2,470 | $1.19 | 24d | 1 | 0.92mi |
| 20191 Sabal Palm Ct Land O' Lakes, FL | 1.0–3.0 | 1.0–2.5 | 1404 | $3,338 | $2.38 | 3d | 20 | 0.99mi |
| 20716 Eustis Rd Land O Lakes, FL | 3.0 | 2.0 | 1455 | $2,050 | $1.41 | 2d | 1 | 1.03mi |
| 8862 Gallantree Pl Unit 8862-Townhouse Land O' Lakes, FL | 3.0 | 2.5 | 1601 | $2,195 | $1.37 | 12d | 1 | 1.31mi |
| 22310 Blazing Star Run Land O Lakes, FL | 4.0 | 2.5 | 1870 | $2,650 | $1.42 | 18d | 1 | 1.33mi |
| 8710 Preston Woods Ct Land O Lakes, FL | 3.0 | 2.0 | 1684 | $2,850 | $1.69 | 18d | 1 | 1.38mi |
HOA detail
- Monthly dues
- $246 · $2,952/yr
- Likely covers
- security
Listing history 17 events
-
2026-06-18days on market $344,900 Active 83 DOM
-
2026-06-17days on market $344,900 Active 82 DOM
-
2026-06-16days on market $344,900 Active 81 DOM
-
2026-06-15days on market $344,900 Active 80 DOM
-
2026-06-13days on market $344,900 Active 78 DOM
-
2026-06-09days on market $344,900 Active 74 DOM
-
2026-06-08days on market $344,900 Active 73 DOM
-
2026-06-07days on market $344,900 Active 72 DOM
-
2026-06-04days on market $344,900 Active 69 DOM
-
2026-06-03days on market $344,900 Active 68 DOM
-
2026-06-02days on market $344,900 Active 67 DOM
-
2026-06-01days on market $344,900 Active 66 DOM
-
2026-05-31days on market $344,900 Active 65 DOM
-
2026-03-27$344,900 Active
-
2026-03-21historical
-
2025-12-12price $349,900
-
2025-09-30$364,900 Active
ⓘ Source: listings_history table (triggers on properties + properties_extension) + one-shot
backfill from property_details.listing_events for pre-trigger history.
Tax reassessment forecast FL · Resets to sale price
- Current annual tax
- $5,080 · $423/mo
- Projected year-2 tax
- $5,080 · $423/mo
- Expected delta
- $0/yr ($0/mo · 0.0%)
ⓘ Screening estimate from a state-policy table — verify with the county assessor before closing.
Climate risk First Street
- Flood 1/10 Low FEMA zone X (unshaded) · 0% chance over 30 yrs
- Wildfire 4/10 Moderate
- Heat 10/10 Extreme 7 d/yr ≥109°F today · 26 d/yr by 30 yrs out
- Wind 9/10 Extreme 99% chance of damaging wind over 30 yrs
- Air quality 2/10 Low 1 unhealthy d/yr today · 1 by 30 yrs out
Nearby sold comps map
Loading sold comps map…
Walkable amenities ~0.75 mi
Loading nearby amenities…
Taxation est. · year 1
- Rental income
- $36,141
- − Mortgage interest
- −$19,320
- − Property taxes
- −$5,080
- − Insurance
- −$1,724
- − Repairs & maintenance
- −$2,891
- − Management
- −$2,891
- − HOA
- −$2,952
- − Depreciation
- −$10,033
- Taxable loss
- −$8,752
- Est. tax savings @ 24.0%
- +$2,100
- After-tax cash flow
- $-810/yr
For passive investors: Depreciation is non-cash, so a rental often shows a tax loss while cash-flowing — sheltering income. Rental losses are passive: they offset passive income freely, and up to $25,000/yr can offset ordinary (W-2) income if you actively participate and your MAGI is under $100k (phasing out to $0 by $150k); unused losses carry forward. On sale, claimed depreciation is recaptured at up to 25%, and gains may owe capital-gains tax (a 1031 exchange can defer both). Figures are a year-1 estimate at your 24.0% rate — not tax advice; consult a CPA.
Schools (NCES district)
- District
- Pasco
- NCES district ID
- 1201530
- Math proficiency
- 50% ▼ -10.00%
- Reading proficiency
- 52% ▼ -5.00%
- Median HH income
- $45,039
- Composite
- 43.14/100
- National rank
- #3074
- State rank
- #32 of 73 in FL
Livability — Connerton
- Score
- 66/100
- State rank
- #596
- US rank
- #11437
Category grades
Schools grade is shown separately in the Schools card above.
Census & demographics
- County
- Pasco County · 524,098 people
- City population
- 11,398
- Metro
- Tampa-St. Petersburg-Clearwater, FL
- Population (ZIP)
- 13,049
- Household income
- $115,214
- Rent vs Own
- Severe rent burden
- 96.0
Population outlook (Pasco County) Hauer SSP2
- Today (2025)
- 570,045 people
- By 2030
- 605,844 · +6.3%
- By 2040
- 674,806 · +18.4%
- By 2050
- 736,022 · +29.1%
- By 2075
- 862,900 · +51.4%
- By 2100
- 906,364 · +59.0%
Race, ethnicity, and origin ACS 2023
- Neighborhood character
- Predominantly White (70%)
- Race & ethnicity
- White 70% Hispanic / Latino 16% Two or more races 10% Black 7% Asian 5%
- Hispanic origin (detail)
- Mexican 1% Puerto Rican 10% Cuban 1%
- Common ancestry
- Romanian 5% Italian 3% Iranian 2%
- Foreign-born
- 8% · Canada
- Languages at home
- 85% English-only · Spanish 8% Other Indo-European 4% Tagalog/Filipino 1%
Political lean MEDSL · Pasco
- 2024 margin
- Strong R (+25.2) · D 36.9% · R 62.1% · Other 1.0%
- 2008→2024 swing
- -21.6pp toward R · 2008: -3.6pp · 2024: -25.2pp
- All cycles
- 2024: R+25.2 2020: R+20.1 2016: R+21.6 2012: R+6.7 2008: R+3.6
Not yet ingested
- Civics
- —
Market trends
- HPI YoY
- ▼ -1.54%
- Current HPI
- 126.1415
- Rent YoY
- —
- Metro
- Tampa-St. Petersburg-Clearwater, FL
- State GDP YoY
- ▲ 3.28%
- F500 in state
- 36
Industry mix (Fortune 500 HQ in FL)
| Industry | F500 HQs | Revenue |
|---|---|---|
| Industrial Technology | 2 | $29B |
|
||
| Insurance | 2 | $17B |
|
||
| Retail | 1 | $60B |
|
||
| Technology Distribution | 1 | $58B |
|
||
| Homebuilding | 1 | $35B |
|
||
| Technology Manufacturing | 1 | $35B |
|
||
Price history
-5.5% since first listed4 events — show timeline
- 2026-03-27 Listed $344,900 Stellar MLS as Distributed by MLS Grid
- 2026-03-21 Listing Removed — Stellar MLS as Distributed by MLS Grid
- 2025-12-12 Price Changed $349,900 Stellar MLS as Distributed by MLS Grid
- 2025-09-30 Listed $364,900 Stellar MLS as Distributed by MLS Grid
Property tax history
+9.3%/yrLatest (2025): $5,080 · +3.3% YoY. Source: county tax records.
Cash-flow waterfall
monthlySold comps — $/sqft
last 12 mo · ≤1 miLoading sold comps…