 Duplex
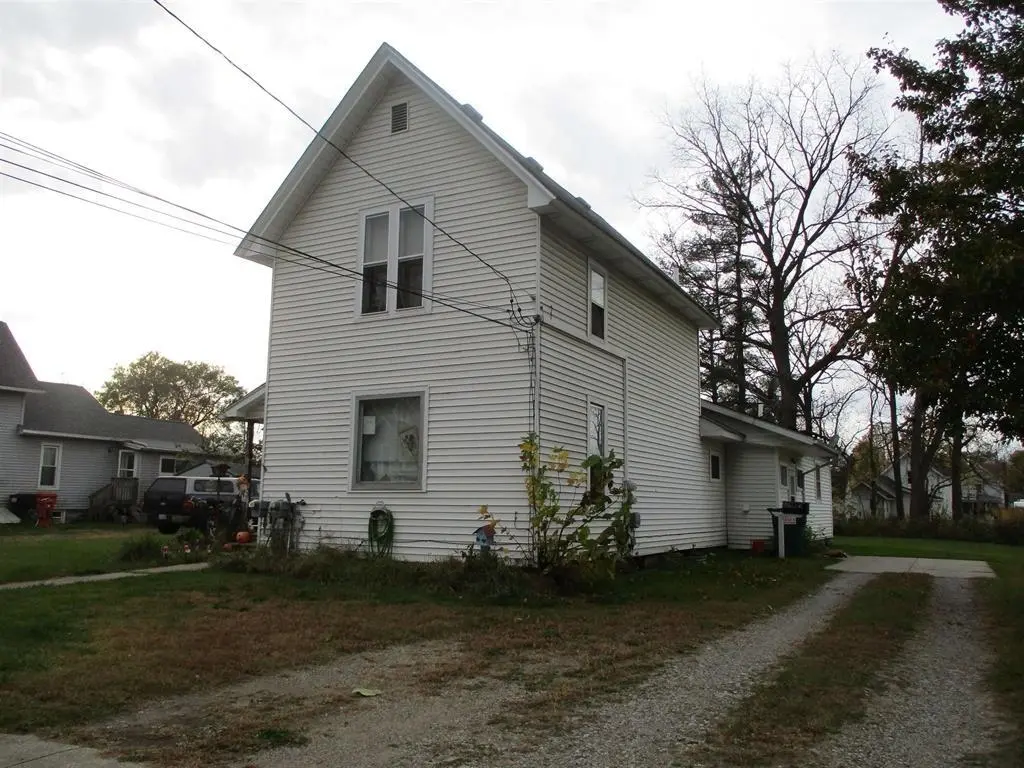
608 Oakwood St · Owosso, MI
Flood risk 1/10 · Minimal
- FEMA flood zone
- X (unshaded)
- Chance of flooding over 30 yrs
- 0.0%
- Est. flood insurance / yr
- $473 – $860
Fire risk 1/10 · Minimal
- Est. fire insurance / yr
- $784 – $1,456
Heat risk 2/10 · Minimal
- Hot days now (above 98°F)
- 7 days/yr
- Hot days in 30 yrs
- 15 days/yr
Wind risk 2/10 · Minimal
- Chance of severe wind over 30 yrs
- —
Air-quality risk 2/10 · Minimal
- Unhealthy air days now
- 1 days/yr
- Unhealthy air days in 30 yrs
- 2 days/yr
Risk factors via First Street. Map © Google.
Why this score? — see what drove the B grade
The composite is a weighted blend of 9 inputs, each scored 0–100. Each bar is that input's sub-score; the figure is the points it added to the 100-point composite (weight × sub-score).
- Cash flow +30.0/30.0
- ARV discount +12.3/15.0
- DSCR +10.0/10.0
- 1% rule +9.1/10.0
- Livability +3.8/5.0
- Rent growth +2.5/5.0
- Condition / age +2.5/5.0
- Schools +2.3/10.0
- Appreciation +0.0/10.0
$129,900
🖨 Deal sheet (PDF) 📄 Offer letter ✓ Due diligence
Multi-family units
County records classify this as Multi-Family (2-4 Unit). Listing-text estimate: 2 units. confirmed
Listing remarks MLS
Duplex , 1 unit front . 1 unit behind. Front unit totally remodeled . Back unit updated a few years ago. Both units in great condition. Live in front unit and rent back. Back unit is rented at present and front unit is vacant.
Key facts
- Back unit updated
- 9,148 sq ft lot
- Built 1940
Tags
Property features AI
Finance
- Other: Pets allowed (dogs OK)
Exterior
- Utilities: Public water; Public sewer
- Home design: Residential income, multi-family property; One and one-half stories
- Construction: Vinyl siding; Block foundation; Built with block basement/crawl space
- Exterior features: Front porch
Interior
- Kitchen: Oven; Range; Refrigerator; Electric water heater
- Bathrooms: 2 full bathrooms
- Heating & cooling: Forced air heating (natural gas); Separate meters; Ceiling fan(s) for cooling
- Interior features: Electric water heater; Oven; Refrigerator; Range; Has basement with crawl space and block construction
Neighborhood map
What this means for you Summary
Snapshot
- This is a 2 × 2-bed/1.0-bath units multifamily listed at $130k.
Deal economics
- At list price, monthly cash flow is $541 ($6k/yr) — positive. Per door: $270/mo.
- The deal already cash-flows at list — no discount required.
- Meets the 1% rule at list price ($2k rent vs $130k).
- Recommended offer: $126k (3.0% below list) — sets the bar for market timing.
- Cap rate 11.3% vs local median 4.3% in Owosso — top-decile yield for the area; either an underpriced asset or a hidden risk that comps aren't pricing in. Stress-test before assuming the spread holds.
Location & tenants
- Location reads 76/100 on livability (#147 in MI, #3,704 nationally) — a middle-class / working-renter tenant base. Strengths: cost of living A+, housing A+, health & safety A+; Watch: crime D-, commute F, employment D-.
- Owosso Public Schools (town): math 21% / reading 33% proficiency, ranked #401 of 540 in MI (top 74%) — low school quality limits family demand, transient renter base, plan for 1-2y turnover.
- Zoned schools: Emerson School (math 26% / reading 26%, grade F, #967 of 1,397 statewide, top 70%, 452 students, 71% FRL); Owosso Middle School (math 15% / reading 36%, grade F, #385 of 493 statewide, top 78%, 643 students, 63% FRL); Owosso High School (math 32% / reading 52%, grade F, #264 of 713 statewide, top 41%, 843 students, 61% FRL).
- Market conditions: 168 active listings in the ZIP; 74 units permitted in Shiawassee County in 2024 (0 in 5+ unit buildings).
Forward outlook
- Local home prices are declining (-3.0%/yr); year-one equity from $898 of loan paydown is wiped out by about $4k of value loss. Plan a longer hold.
- Shiawassee County population projected at -25% by 2050 — secular population decline; favor cash flow + early exit over multi-decade hold.
- At projected returns (-3.0% appreciation + 3.0% rent growth), your $36k cash investment doubles in ~7 years — after that, you're playing with house money.
Negotiation context
- It's been on market 35 days — a 3% lower offer ($126k) is reasonable based on typical stale-listing flexibility.
- 4 sale attempts since 2y ago with the ask held roughly flat each time — persistent listings suggest the price (not the market) is what's stuck; bring a comps-based counter.
Risks & watch-outs
- Watch-outs: built in 1940 — expect roof / HVAC / electrical / plumbing capex.
Questions for the listing agent
- It's been on market 35 days. Have you received any prior offers? Is the seller open to a 3% concession, seller financing, or rate buy-down credit?
- Can we see the unit-by-unit rent roll, current vacancy, and any below-market leases? What's the average tenancy length?
- What capital expenditures (roof, boiler, parking lot, exteriors) have been made in the last 5 years, and what's planned in the next 2?
- Built in 1940 — when were the roof, HVAC, electrical panel, plumbing, and water heater last replaced?
- Is there a deadline driving the sale (1031 exchange, divorce, estate, relocation)? That informs how much negotiation room exists.
- Schools are D-rated, which usually means shorter tenancies and higher turnover. Who's the typical renter profile here, and what's been the actual vacancy rate?
- Crime grade is D in this area — have there been break-ins, vandalism, or insurance claims at this property in the last 3 years? What carrier currently insures it and at what premium?
- What's the average days-on-market for RENTAL listings here right now (not sales)? A rising rental-DOM trend means longer vacancies and softer asking-rent achievability than the comps imply.
- What's the recent tenant-quality profile in this submarket — average credit score on applications, eviction rate, late-payment / NSF rate, and stable-employment percentage? A property-management company in the area should have these aggregated.
- How much new apartment / multifamily construction is in the pipeline within 1–3 miles? Heavy new supply (>2% of stock underway) typically softens rents 12–24 months out; light construction supports rent growth.
Investment metrics
- 1% rule
- 1.41% ✓
- Cap rate
- 11.29%
- Cash-on-cash
- 17.84%
- DSCR
- 1.79
- GRM
- 5.9
CMA / ARV
- ARV (on-the-fly)
- $145,520
- Comps found
- 5
Show comp detail 5 sales within ~0.75 mi
| Address | Dist | Beds/Ba | Sqft | Sold | Price | $/sf | Match |
|---|---|---|---|---|---|---|---|
| 218 S Oak St | 0.40mi | 4/2.0 | 1,768 (+3%) | 1mo | $150,000 | $85 | 75 |
| 609 Broadway Ave | 0.19mi | 3/2.0 (-1) | 1,770 (+3%) | 8mo | $81,000 | $46 | 74 |
| 426 E Mason St | 0.61mi | 4/2.0 | 1,604 (-6%) | 11mo | $135,000 | $84 | 52 |
| 632 Grand Ave | 0.32mi | 3/3.0 (-1) | 1,458 (-15%) | 9mo | $153,000 | $105 | 44 |
| 720 E Oliver St | 0.71mi | 5/2.5 (+1) | 1,460 (-15%) | 22mo | $139,000 | $95 | 17 |
Match score weights: distance 35% · size 25% · config 20% · recency 20%. Top-matched comps best support the ARV.
Projected returns pro-forma
-3.0% appreciation · 3.0% rent growth · sell at horizon
- IRR
- 9.4%
- Equity multiple
- 1.37×
- Total profit
- $13,432
- Equity at exit
- $19,369
- IRR
- 18.6%
- Equity multiple
- 2.54×
- Total profit
- $56,193
- Equity at exit
- $11,231
Cash invested: $36,372 (down + closing). Projections, not guarantees.
Landlord ↔ Tenant lean methodology
- Overall (STATE)
- 62 Landlord-Friendly
- State Michigan
- 62 Landlord-Friendly · EVEN
- County
- — inherits STATE
- City
- — inherits STATE
ZIP-level market 48867
- Active inventory
- 168
- Price-to-rent
- 11.8×
Monthly cashflow live
- Estimated rent
- $1,835 medium interval (Pro) →
- Mortgage (P&I)
- −$681
- Tax from tax record
- −$173 /mo · $2,082/yr
- Insurance
- −$54
- HOA
- −$0
- Lot rent
- −$0
- Vacancy / Maint / Mgmt
- −$385
- Net cashflow
- $541
Break-even live
Sensitivity live
| Price | -10% $614 | -5% $578 | +0% $541 | +5% $504 | +10% $467 |
|---|---|---|---|---|---|
| Rent | -10% $396 | -5% $468 | +0% $541 | +5% $613 | +10% $686 |
| Rate | -1.0pp $606 | -0.5pp $574 | base $541 | +0.5pp $507 | +1.0pp $473 |
2-unit breakdown (identical units grouped — click to expand)
| Units | Beds | Baths | Est. rent |
|---|---|---|---|
| 2× units | 2 | 1 | $1,836 |
| #1 | 2 | 1 | $918 |
| #2 | 2 | 1 | $918 |
| Total (2 units) | $1,835 | ||
UW: 25.0% down · 7.5% · 30yr · 1.5% tax · 5.0% vac · 8.0% maint · 8.0% mgmt
Financing live
Cash to close
- Down payment
- $32,475
- Closing costs
- $3,897
- Reserves months
- —
- Total cash needed
- —
Loan-product check · same deal, 3 products live
Conventional
25% down · 7.5% · 30yr
- Down + closing
- —
- Monthly P&I
- —
- Monthly cashflow
- —
- DSCR
- —
- Eligible?
- —
Personal DTI + credit; lowest rate.
DSCR
20% down · 8.5% · 30yr
- Down + closing
- —
- Monthly P&I
- —
- Monthly cashflow
- —
- DSCR
- —
- Eligible?
- —
No personal income docs; deal must DSCR.
Hard money
10% down · 12.0% · 12mo
- Down + closing
- —
- Monthly P&I
- —
- Monthly cashflow
- —
- DSCR
- —
- Eligible?
- —
Short-term bridge; refi at stabilization.
Listing history 26 events
-
2026-06-22days on market $129,900 Active 35 DOM
-
2026-06-21days on market $129,900 Active 34 DOM
-
2026-06-21days on market $129,900 Active 33 DOM
-
2026-06-18days on market $129,900 Active 31 DOM
-
2026-06-17days on market $129,900 Active 30 DOM
-
2026-06-16days on market $129,900 Active 29 DOM
-
2026-06-15days on market $129,900 Active 28 DOM
-
2026-06-13days on market $129,900 Active 26 DOM
-
2026-06-12days on market $129,900 Active 25 DOM
-
2026-06-09days on market $129,900 Active 22 DOM
-
2026-06-08days on market $129,900 Active 21 DOM
-
2026-06-07days on market $129,900 Active 20 DOM
-
2026-06-07days on market $129,900 Active 19 DOM
-
2026-06-04days on market $129,900 Active 16 DOM
-
2026-06-02days on market $129,900 Active 15 DOM
-
2026-06-01days on market $129,900 Active 14 DOM
-
2026-05-31days on market $129,900 Active 13 DOM
-
2026-05-31days on market $129,900 Active 12 DOM
-
2026-05-18$129,900 Active
-
2026-05-17$129,900 Active 228-char remark
Show marketing remark (228 chars)
Duplex , 1 unit front . 1 unit behind. Front unit totally remodeled . Back unit updated a few years ago. Both units in great condition. Live in front unit and rent back. Back unit is rented at present and front unit is vacant.
-
2025-04-16historical
-
2025-04-16historical
-
2025-03-27price $99,900
-
2025-03-27price $99,900
-
2024-11-03$110,000 Active
-
2024-11-03$110,000 Active
ⓘ Source: listings_history table (triggers on properties + properties_extension) + one-shot
backfill from property_details.listing_events for pre-trigger history.
Tax reassessment forecast MI · Partial reset (capped growth)
- Current annual tax
- $2,082 · $173/mo
- Projected year-2 tax
- $2,082 · $173/mo
- Expected delta
- $0/yr ($0/mo · 0.0%)
ⓘ Screening estimate from a state-policy table — verify with the county assessor before closing.
Climate risk First Street
- Flood 1/10 Low FEMA zone X (unshaded) · 0% chance over 30 yrs
- Wildfire 1/10 Low
- Heat 2/10 Low 7 d/yr ≥98°F today · 15 d/yr by 30 yrs out
- Wind 2/10 Low
- Air quality 2/10 Low 1 unhealthy d/yr today · 2 by 30 yrs out
Nearby sold comps map
Loading sold comps map…
Walkable amenities ~0.75 mi
Loading nearby amenities…
Taxation est. · year 1
- Rental income
- $22,020
- − Mortgage interest
- −$7,276
- − Property taxes
- −$2,082
- − Insurance
- −$650
- − Repairs & maintenance
- −$1,762
- − Management
- −$1,762
- − Depreciation
- −$3,779
- Taxable income
- $4,710
- Est. tax owed @ 24.0%
- −$1,131
- After-tax cash flow
- $5,360/yr
For passive investors: Depreciation is non-cash, so a rental often shows a tax loss while cash-flowing — sheltering income. Rental losses are passive: they offset passive income freely, and up to $25,000/yr can offset ordinary (W-2) income if you actively participate and your MAGI is under $100k (phasing out to $0 by $150k); unused losses carry forward. On sale, claimed depreciation is recaptured at up to 25%, and gains may owe capital-gains tax (a 1031 exchange can defer both). Figures are a year-1 estimate at your 24.0% rate — not tax advice; consult a CPA.
Schools (NCES district)
- District
- Owosso Public Schools
- NCES district ID
- 2627210
- Math proficiency
- 21% ▼ -6.00%
- Reading proficiency
- 33% ▲ 1.00%
- Median HH income
- $40,656
- Composite
- 22.78/100
- National rank
- #8025
- State rank
- #401 of 540 in MI
Livability — Owosso
- Score
- 76/100
- State rank
- #147
- US rank
- #3704
Category grades
Schools grade is shown separately in the Schools card above.
Census & demographics
- Census place
- Owosso, MI
- City population
- 27,399
- Population (ZIP)
- 27,399
Population outlook (Shiawassee County) Hauer SSP2
- Today (2025)
- 64,238 people
- By 2030
- 61,434 · -4.4%
- By 2040
- 55,054 · -14.3%
- By 2050
- 48,426 · -24.6%
- By 2075
- 35,995 · -44.0%
- By 2100
- 26,678 · -58.5%
Race, ethnicity, and origin ACS 2023
- Neighborhood character
- Predominantly White (92%)
- Race & ethnicity
- White 92% Hispanic / Latino 4% Two or more races 3%
- Common ancestry
- Romanian 6% Lithuanian 3% Iranian 3%
- Foreign-born
- 1%
- Languages at home
- 98% English-only · Spanish 1% Arabic 1%
Political lean MEDSL · Shiawassee
- 2024 margin
- Strong R (+23.1) · D 37.7% · R 60.8% · Other 1.6%
- 2008→2024 swing
- -31.7pp toward R · 2008: 8.6pp · 2024: -23.1pp
- All cycles
- 2024: R+23.1 2020: R+19.9 2016: R+19.6 2012: D+3.7 2008: D+8.6
Not yet ingested
- Civics
- —
Market trends
- HPI YoY
- ▼ -234.79%
- Current HPI
- 190.5775
- Rent YoY
- —
- Metro
- —
- State GDP YoY
- ▲ 1.37%
- F500 in state
- 28
Industry mix (Fortune 500 HQ in MI)
| Industry | F500 HQs | Revenue |
|---|---|---|
| Automotive Parts | 3 | $48B |
|
||
| Automotive | 2 | $372B |
|
||
| Chemicals | 1 | $45B |
|
||
| Automotive Retail | 1 | $29B |
|
||
| Healthcare / Medical Devices | 1 | $23B |
|
||
| Automotive Technology | 1 | $20B |
|
||
Price history
+18.1% since first listed8 events — show timeline
- 2026-05-18 Listed $129,900 REALCOMP
- 2026-05-17 Listed $129,900 MiRealSource-MiMLS
- 2025-04-16 Listing Removed — MiRealSource-MiMLS
- 2025-04-16 Listing Removed — REALCOMP
- 2025-03-27 Price Changed $99,900 MiRealSource-MiMLS
- 2025-03-27 Price Changed $99,900 REALCOMP
- 2024-11-03 Listed $110,000 MiRealSource-MiMLS
- 2024-11-03 Listed $110,000 REALCOMP
Property tax history
+2.5%/yrLatest (2025): $2,082 · +3.8% YoY. Source: county tax records.
Cash-flow waterfall
monthlySold comps — $/sqft
last 12 mo · ≤1 miLoading sold comps…